MNI EUROPEAN MARKETS ANALYSIS: A$ Outperforms On Crosses
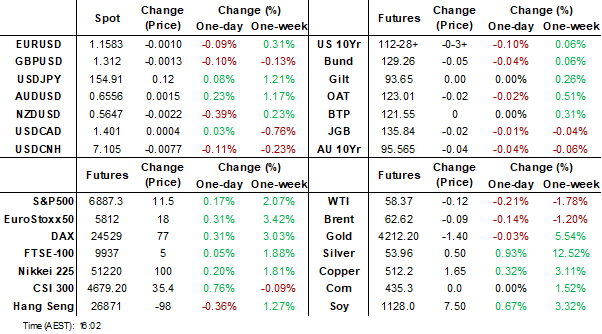
- The US government has re-opened as expected. Market impact has been minimal. US equity futures and Tsy yields are up a touch. All eyes now on when key data releases may now print.
- In Australia, the Oct jobs report was much stronger than forecast, driving a surge in local government bond yields (3yr +10bps), while the A$ has been an outperformer, up versus the USD and on key crosses. The USD is firmer against the rest of the G10.
- The Fed’s Daly, Kashkari, Musalem and Hammack speak later. The ECB’s Buch, Donnery, Elderson and Machado appear as well as BoE’s Greene. UK Q3 GDP, September IP & trade, France Q3 unemployment and euro area September IP are released.
MARKETS
US TSYS: Yields Higher Post Shutdown End, Awaits Data Release
Bond markets were somewhat subdued today in Asian trading with futures largely where they started and bond yields 0.5bp-1bps higher across the curve. The 10-Yr bond future did very little on low volumes, down -02 to 112-30 as it tries to break below the 112-30 20-day EMA.
Cash was mostly weaker with yields higher across the curve with the 3-Yr the underperformer, up +1.2bps in yield.
- The 2-Yr is at 3.574% (+0.2bps)
- The 5-yr is at 3.679% (+0.5bps)
- The 10-Yr is at 4.075% (+0.4bps)
- The 30-Yr is at 4.669% (+0.4bps)
A $25 billion 30-year bond auction Thursday is the next focus ahead.
It is too soon to expect data releases previously in the calendar. See the MNI Re-Opening guide from earlier this week: https://media.marketnews.com/Shutdown_Restart_Guide_Nov112025_4f06f43a37.pdf
The reality is it will take some time for the data to flow and bond markets could be volatile as it takes time to digest all of the delayed data.
JGBS: Market Looks Past 5Y Auction Result, BOJ Ueda: CPI Moving To Target
JGB futures are stronger, +9 compared to settlement levels.
- This comes despite today’s 5-year auction delivering mixed demand signals. The low price was in line with expectations, but the bid-to-cover fell to 3.33x from 3.69x, while the tail narrowed to 0.03 from 0.06. Overall, with an outright yield and the 2s/5s curve near cycle highs, today’s outcome points to generally lacklustre demand conditions.
- MNI BRIEF: BOJ's Ueda said that underlying CPI inflation, excluding temporary factors, is gradually moving toward the bank's 2% target, and that the mechanism in which wages and prices rise moderately in tandem will be maintained. Ueda is scheduled to deliver a speech in early December ahead of the Bank's next policy meeting, which is expected to provide a stronger signal on the BOJ's next move.
- Cash US tsys are little changed in today's Asia-Pac session. As expected, the US House has passed a bill to reopen the US government, and President Trump has signed it.
- Cash JGBs are ~1bp richer across benchmarks. The benchmark 5-year yield is 0.7bp lower at 1.241% versus a session high of 1.251%.
- Swaps have twist-steepened, with rates 1bp lower to 1bp higher.
- Tomorrow, the local calendar will see the Tertiary Industry Index.
JAPAN DATA: Import Prices Rising M/M, As USD/JPY Firms, But Y/Y Still Negative
Rebounding USD/JPY levels has helped push up imported price pressures in Japan. Recent comments from Japan policy makers suggest the weaker yen's impact is not going unnoticed. Still, it remarks to be seen if we see policy steps to address this, particularly as PM Takaichi remarks seemingly push back against an aggressive BoJ tightening cycle.
- Earlier data for Oct showed a 2.5%m/m gain, the strongest rise since late 2024. Still, in y/y terms, we remain negative at -1.5%. If USD/JPY continues to track higher, positive m/m gains are likely to continue if we see higher USD/JPY levels. In y/y terms if current levels hold around 155, the the y/y import price pulse is not likely to strengthen too much (see the chart below). If we get closer towards 160, this implies positive y/y import prices through to year end/early 2026 (roughly in the 3-4% region)
- From yesterday the Japan FinMin stated: "JAPAN FINMIN KATAYAMA: WON'T DENY DISADVANTAGES OF WEAK YEN OUTWEIGHING ADVANTAGES - [RTRS]"
- While earlier today, "JAPAN FINANCE MINISTER KATAYAMA: IF YEN MAKES FREE FALL, THAT WILL PUSH UP IMPORT COSTS AND CAUSE INFLATION UNSEEN IN THE PAST BUT WE WILL PURSUE 'RESPONSIBLE' FISCAL POLICY TO AVOID THIS FROM HAPPENING - [RTRS]"
- If current USD/JPY levels persist, y/y momentum in import price pressures may remain fairly contained. These metrics are likely to shift though if we trend towards 160.00.
Fig 1: USD/JPY Y/Y & Japan Import Prices Y/Y (Extended A Few Mths Assuming USD/JPY Holds Near 155)
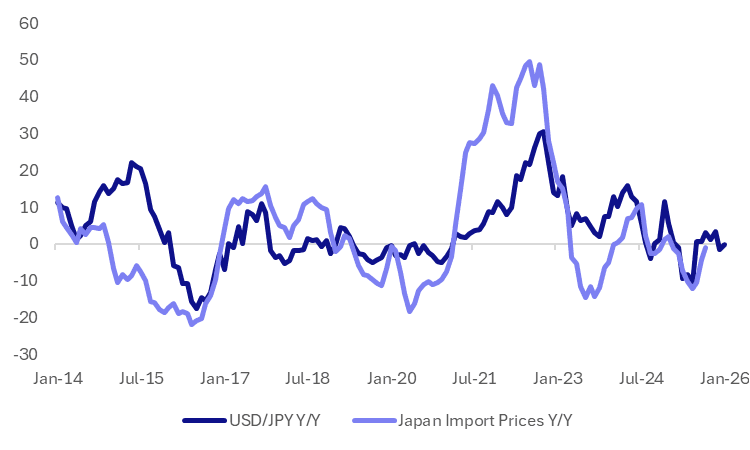
Source: Bloomberg Finance L.P./MNI
JAPAN DATA: Local Investors Return To Offshore Bonds, But Sell Global Equities
Aggregate Japan weekly investment flows were mixed in the week ending Nov 7 (last Friday). In terms of Japan outbound flows, we saw a pick up in offshore bond buying, which ended a 3 week run of net outflows from this segment. As we have noted in recent weeks, cumulative outflows to offshore bonds have remained positive, owing to chunky net buying through late Aug, early Sep. Global bond returns have broadly moved sideways, not providing a fresh impetus for local investors. Japan investors continued to sell overseas equities, with net outflows in 7 out of the last 8 weeks. Strength in local equities may be keeping the home bias firmer, particularly with new PM Takaichi's pro-growth regime.
- Offshore investors did sell local Japan equities last week, albeit only modestly. This ends a run of five straight week of inflows. Offshore cumulative inflows have also been strongly positive in the past 6 months. Japan equities remain supported on dips, but the NKY is off earlier Nov highs.
- Offshore investors added to local bonds, but only modestly.
Table 1: Japan Weekly Offshore Investment Flows
| Billion Yen | Week ending Nov 7 | Prior Week |
| Foreign Buying Japan Stocks | -347.3 | 690.1 |
| Foreign Buying Japan Bonds | 91.5 | 280.6 |
| Japan Buying Foreign Bonds | 566.3 | -354.5 |
| Japan Buying Foreign Stocks | -439.5 | -581.1 |
Source: Bloomberg Finance L.P./MNI
AUSTRALIA DATA: Steady Jobs Market Means RBA Can Hold To Reduce Inflation
After softer August/September prints, the labour market normalised in October in line with the RBA’s view that “labour market conditions remain a little tight”. The recent trend, if sustained, is likely to keep rates on hold given the Q3 increase in price pressures and uncertainty over policy restricitiveness.
- Much of the October data was in line with the Q3 average consistent with a stable labour market, looking through the monthly volatility.
- The October unemployment rate fell 0.2pp to 4.3% in line with Q3’s 4.3%. The number of unemployed fell 17k bringing the 3-month average to +5k (Q3 +7.2k).
Australia unemployment rate %
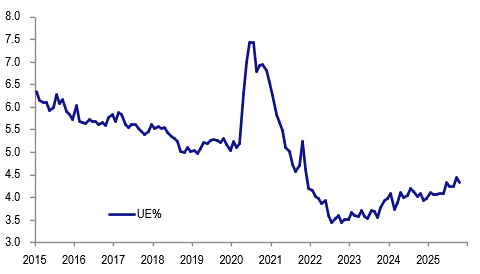
Source: MNI - Market News/ABS
- Employment rose 42.2k in October, the highest monthly gain since April, with the annual rate rising to 1.6% y/y from 1.3% y/y. It rose 1% 3m/3m average annualised in line with the rate in Q3.
- The balance shifted towards full-time (FT) jobs in October rising 55.3k compared with part-time (PT) falling 13.1k but in terms of 3-monthly growth, PT is outperforming rising 2.1% annualised compared to 0.5%.
- Firms may have increased the hours of their existing PT staff rather than hiring new ones in October as their hours rose 0.7% m/m to be up 4.7% 3m/3m saar, contributing to the 0.2pp fall in underemployment to 5.7%. FT rose 0.5% m/m but falling 0.6% 3m/3m saar.
- Labour force growth was stable at 1.9% y/y with the participation rate holding at 67% around where it has been since April and the employment ratio at 64.0% for the third straight month.
Australia employment 3m/3m average annualised %
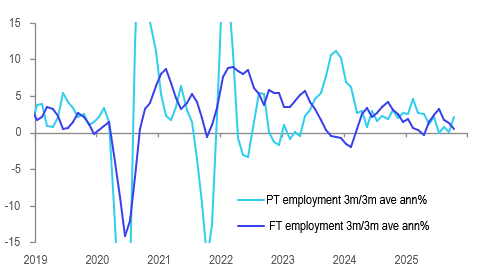
Source: MNI - Market News/ABS
RBA: Recent Data In Line With RBA View Of Stable Labour Market, Rates On Hold
In her November press conference, RBA Governor Bullock reiterated that the central bank looks at a range of labour market indicators and that overall they were stable and suggested a steady unemployment rate. The October jobs data were in line with this view. She also noted that the quit rate had jumped and that surveys and the RBA’s business liaison programme reported increased skilled labour difficulties. This will add to concern that policy may not be as restrictive as previously thought.
- The unemployment rate returned to 4.3% in line with the Q3 average. It has gradually risen and H2 is higher than H1 but it has been stable since June. Youth unemployment is another important indicator as the RBA says it leads the labour market. It fell 1pp in October to 9.6%, below Q3’s 10% and the lowest since May.
Australia unemployment rate 15-24 years %
Source: MNI - Market News/ABS
- Importantly underemployment fell 0.2pp in October to 5.7% below Q3’s 5.8% and Q2’s 5.9%. It has been trending lower since mid-2024.
- Hours worked rose 0.5% m/m to be up 2.1% y/y after 0.5% & 1.4% the previous month. Both full-time and part-time hours rose in October.
- Bullock observed that job vacancies remain elevated. SEEK new job ads are recovering recording their third consecutive monthly rise in September with the 3-month annualised rate rising to 6.8% from -2.5% in June.
- The Q3 NAB business survey showed “suitable labour being a constraint” up to 30.0 from 27.3. Also, labour demand was stronger with expected employment was up 3 points to 12.5 (highest since Q4 2023) and change in employees over next year +2 points to 18.6.
Australia NAB labour availability constraint
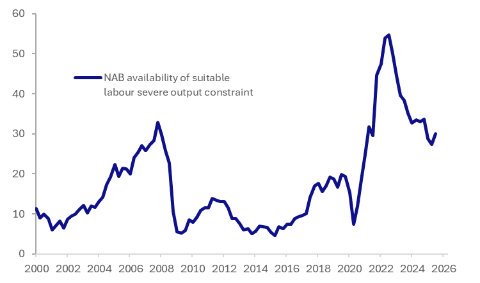
Source: MNI - Market News/LSEG
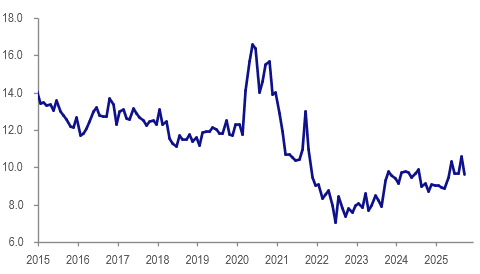
AUSTRALIA DATA: Q4 Inflation Expectations Above Q3
Melbourne Institute consumer inflation expectations for November moderated 0.3pp to 4.5% despite news that Q3 inflation increased more than expected and an increase in petrol prices at the end of October/start of November. Even though November moderated the Q4 average inflation expectations are higher than Q3 at 4.65% compared to Q2’s 4.4%.
- Households may have been reassured by RBA Governor Bullock’s message that inflation is expected to moderate towards the band’s 2.5% mid-point.
- Inflation expectations peaked this year at 5.0% in June and have been unable to hold breaks below 4%.
- Consumers also looked through higher inflation in Westpac’s November consumer confidence survey as it jumped 12.8% but 76% of respondents now expect rates to be unchanged or higher in 12 months up from 60% in October. This could be adding to confidence that the RBA will bring inflation back down.
Australia core inflation vs consumer inflation expectations y/y%
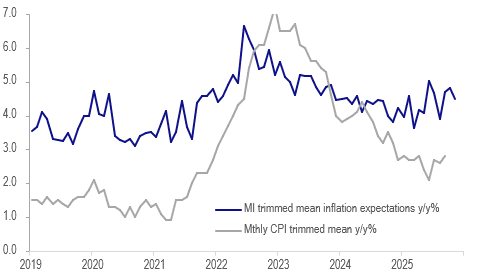
Source: MNI - Market News/ABS/LSEG
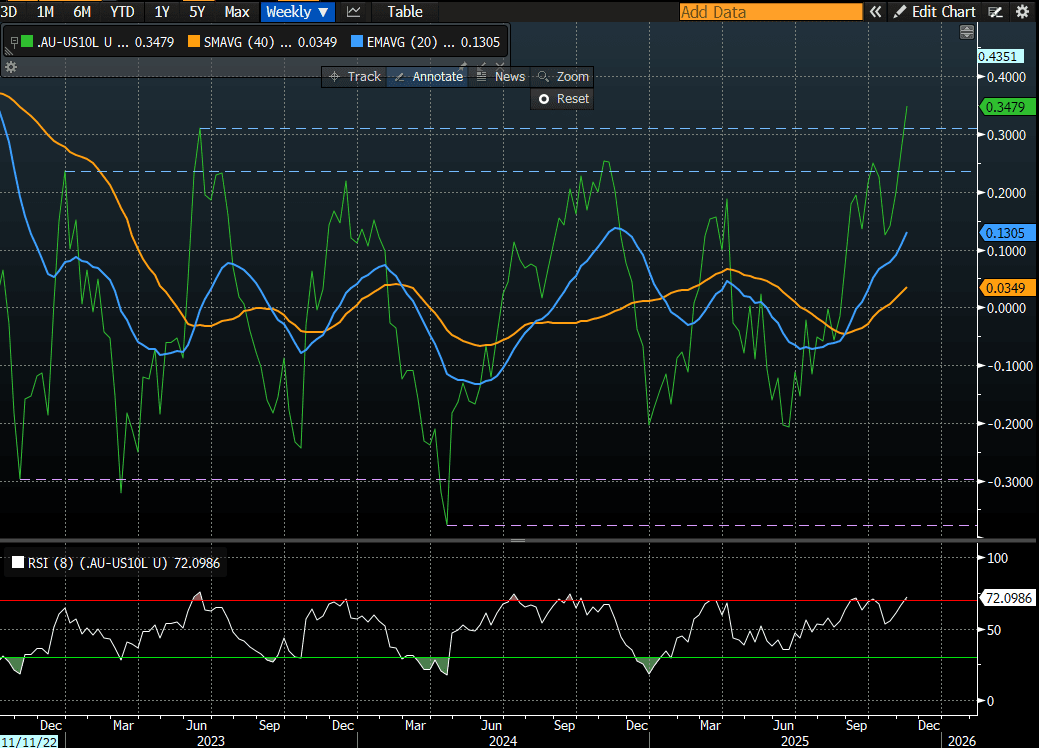
AUSSIE BONDS: AU-US 10Y Diff Narrowers May Still Be Premature
ACGBs (YM -10.0 & XM -4.0) are sharply weaker but above the session lows seen shortly after the release of today's October employment data.
- After softer August/September prints, the labour market normalised in October in line with the RBA’s view. The recent trend, if sustained, is likely to keep rates on hold given the Q3 increase in price pressures and uncertainty over policy restrictiveness.
- Cash US tsys are little changed in today's Asia-Pac session. As expected, the US House has passed a bill to reopen the US government, and President Trump has signed it.
- Cash ACGBs are 6-11bps cheaper than pre-data levels, with the AU-US 10-year yield differential at +34bps. At this level, the differential is through the top of its well-defined +/- 30bps trading range (see chart).
- However, with the market still pricing in almost a 40% chance of a 25bps cut by mid-2026, initiating 10-year differential narrowers may still be premature.
- The bills strip shunted cheaper and steeper, with pricing -2 to -16.
- RBA-dated OIS pricing shows a 25bp rate cut in December at a 1% probability (9% pre-data).
- Tomorrow, the local calendar will be empty apart from the AOFM’s planned sale of A$800mn of the 1.75% 21 November 2032 bond.
Bloomberg Finance LP
NEW ZEALAND: Retail Spending Growth Turns Down Again
Spending on cards continues to have positive momentum but remains soft with annual growth rates turning down. Data since the last RBNZ decision are consistent with only a weak recovery and so another rate cut, probably 25bp, on 26 November is likely. October retail transactions rose 0.2% m/m to be up only 0.2% y/y down from 0.9% but still up 2.2% 3m/3m annualised. Total expenditure was flat on the month and deteriorated to -1.7% y/y from -1.3%, the weakest since May.
- Core retail consumption was also up 0.2% m/m driven by a 0.8% m/m increase in consumables. However, apparel fell 0.6% m/m, hospitality -1.4% m/m and motor vehicles -1.2% m/m.
- Non-retail ex services fell 0.3% m/m while services were flat.
- Q3 real retail sales are released 27 November.
NZ card spending y/y%
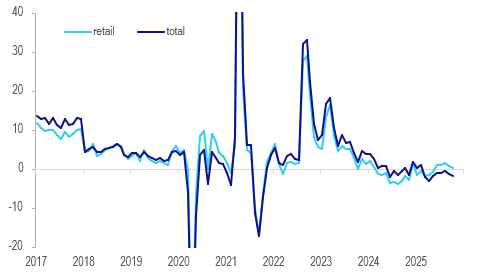
Source: MNI - Market News/LSEG
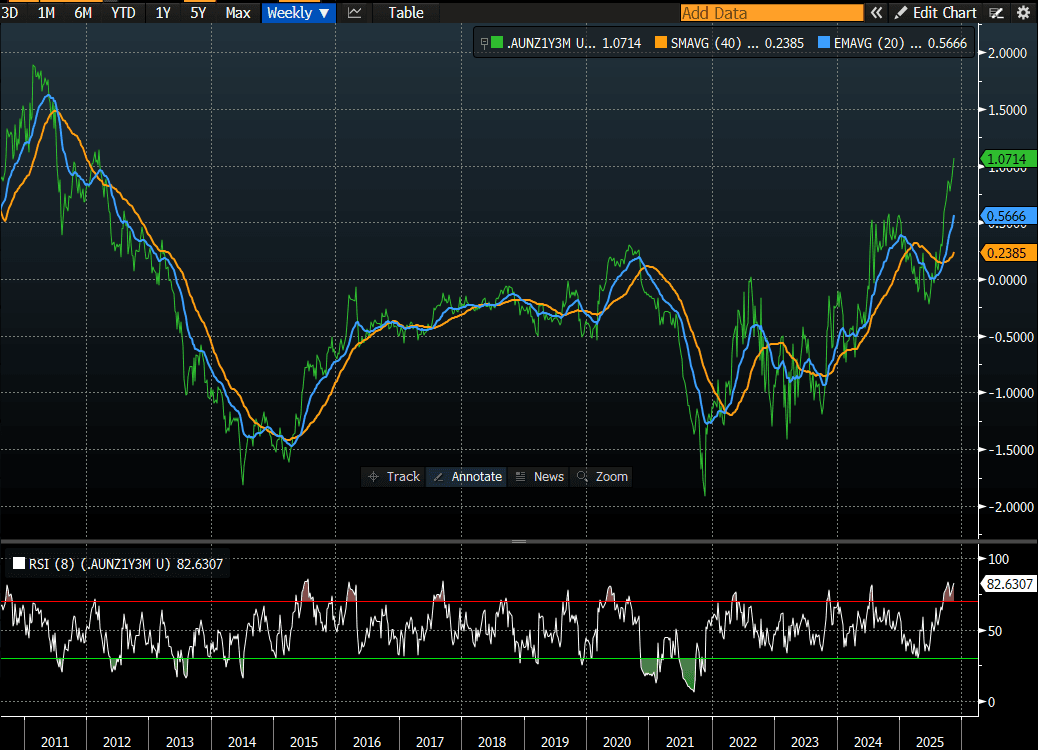
BONDS: NZGBS: Poor Weekly Auction & ACGB Sell-Off Weighs
NZGBs closed showing a bear-steepener, with benchmark yields 2-6bps higher.
- Today’s weekly supply auctions displayed muted demand, with the May-54 bond clearing at an average yield 1.07bps above prevailing mids. The bid-to-cover ratio dropped to 3.00x, the lowest for this tenor since May, from 3.24 at the previous offering of this tenor on 30 October. The May-34 bond also printed an average yield above prevailing mids (+0.17bp), while the May-30 showed a yield 0.89bp below the market rate. The cover ratios for these lines also declined.
- The poor showing also coincided with a broad-based selloff in ACGBs, following today’s October Employment Report. At the time of writing, ACGBs were 9-15bps cheaper than pre-data levels.
- Swap rates closed 4-8bps higher.
- Nonetheless, the AU-NZ 1-year forward 3-month swap rate (1Y3M) spiked to a new cycle high of 109bps, the highest level since 2012. With the spot 3M spread at 119bps, the market is now expecting very little convergence between the RBA's and RBNZ's policy rates over the next year.
- RBNZ dated OIS pricing closed slightly firmer across meetings. 27bps of easing is priced for November, with a cumulative 37bps by February 2026.
- Tomorrow, the local calendar will see BusinessNZ Manufacturing PMI and a speech from RBNZ MPC Member Prasanna Gai.
JPY: Asia- Pac: USD/JPY Capped Around 155.00 Again
The USD/JPY range today has been 154.63 - 155.01 in the Asia-Pac session, it is currently trading around 154.70, -0.05%. The pair stalled again around the 155.00 area as it did overnight. The return of a positive sentiment in risk has brought the focus in USD/JPY back to the 154-155 resistance area. A sustained break above this area is needed to potentially see the uptrend begin another extension higher, the focus would then turn toward the 160 area where I would start to become wary of intervention risks. On the day the support toward 154.30-154.50 needs to hold in order to have another test of the 155.00 area. More Jaw-Boning from Katayama overnight points to officials understanding what the risk of a move back through this area poses. The first strong buy-zone is back toward 152.50 then the more important 149-150 area.
- MNI BRIEF: BOJ's Ueda Sees Underlying CPI Toward 2% Target. He said Thursday that underlying CPI inflation, excluding temporary factors, is gradually moving toward the bank’s 2% target, and that the mechanism in which wages and prices rise moderately in tandem will be maintained. Ueda is scheduled to deliver a speech in early December ahead of the Bank’s next policy meeting, which is expected to provide a stronger signal on the BOJ’s next move.
- MNI AU - Import Prices Rising M/M, As USD/JPY Firms, But Y/Y Still Negative: Rebounding USD/JPY levels has helped push up imported price pressures in Japan. Recent comments from Japan policy makers suggest the weaker yen's impact is not going unnoticed. Still, it remains to be seen if we see policy steps to address this, particularly as PM Takaichi remarks seemingly push back against an aggressive BoJ tightening cycle.
- Options : Close significant option expiries for NY cut, based on DTCC data: none. Upcoming Close Strikes : 155.00($978m Nov17) - BBG.
- The USD/JPY Average True Range(ATR) for the last 10 Trading days: 101 Points
Fig 1 : USD/JPY Spot Daily Chart
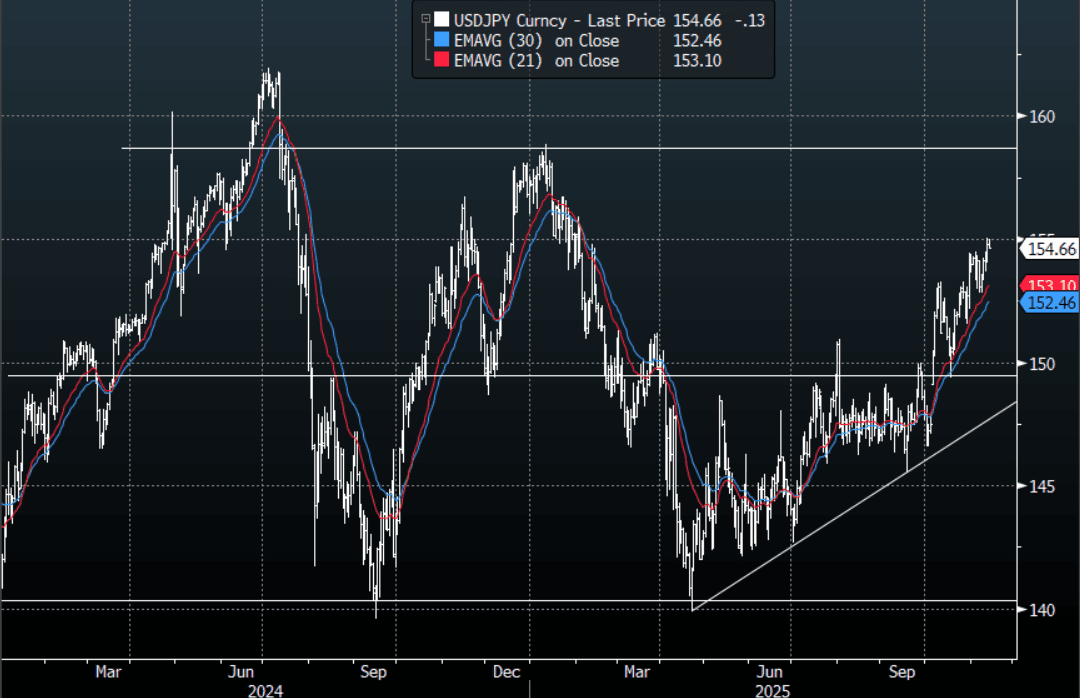
Source: MNI - Market News/Bloomberg Finance L.P
AUD: Asia-Pac: AUD/USD Trying To Push Above 0.6560 On Better Employment Data
The AUD/USD has had a range today of 0.6533 - 0.6565 in the Asia- Pac session, it is currently trading around 0.6555, +0.20%. The AUD/USD has been given a nudge higher by better employment data. The AUD/USD needs a sustained push above the 0.6560 area for the focus to turn back toward the 0.6650/0.6700 year highs. Look for intra-day dips toward 0.6530/0.6540 to be supported initially as the market tries to build upward momentum.
- MNI AU - Recent Data In Line With RBA View Of Stable Labour Market, Rates On Hold: In her November press conference, RBA Governor Bullock reiterated that the central bank looks at a range of labour market indicators and that overall they were stable and suggested a steady unemployment rate. The October jobs data were in line with this view. She also noted that the quit rate had jumped and that surveys and the RBA’s business liaison programme reported increased skilled labour difficulties. This will add to concern that policy may not be as restrictive as previously thought.
- Options : Closest significant option expiries for NY cut, based on DTCC data: 0.6500(AUD549m), 0.6520(AUD902m), 0.6525(AUD 680mm). Upcoming Close Strikes : 0.6400(AUD913m Nov 18), 0.6750(AUD2.17b Nov 14) - BBG
The AUD/USD Average True Range for the last 10 Trading days: 43 Points
Fig 1: AUD/USD spot Daily Chart
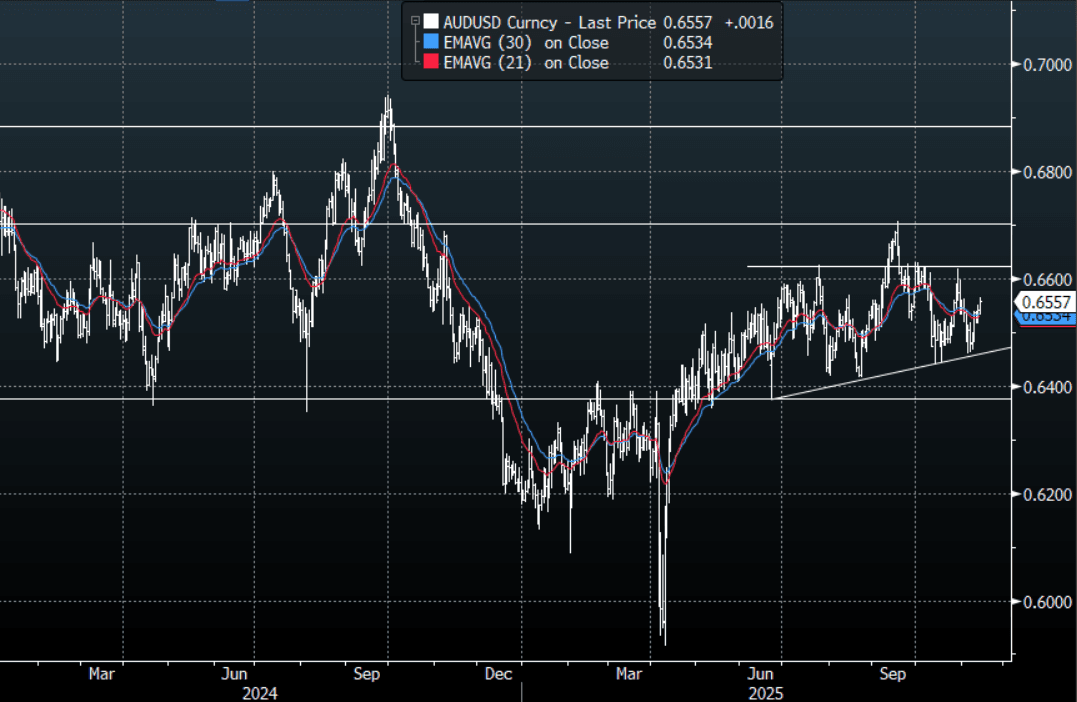
Source: MNI - Market News/Bloomberg Finance L.P
FOREX: Asia-Pac USD: BBDXY Drifts Sideways Below 1220
The BBDXY has had a range today of 1217.84 - 1219.36 in the Asia-Pac session; it is currently trading around 1218, +0.02%.The USD trades sideways below 1220 at the moment in a directionless market. I am caught a little undecided on the USD, I liked the fade into 1230 initially but short term I expect dips back toward 1210-1215 to now be supported first up. We could chop around sideways for a while while the market decides which way to go. Above 1230 and we could start to break higher, below 1205 and the downtrends momentum could be re-engaged. Short-term while the 1221-1222 area caps price my bias would be for a test toward the 1210-1215 support.
- EUR/USD - Asian range 1.1579 - 1.1594, Asia is currently trading 1.1590. The pair continued to build on its support below 1.1500, I suspect rallies will now find sellers toward the 1.1650 area initially. This has been the pivot within the larger 1.1400-1.1900 range over the past few months. On the day a move back below 1.1540-1.1550 needed to turn lower again.
- GBP/USD - Asian range 1.3111 - 1.3134, Asia is currently dealing around 1.3125. The pair is trading sideways chopping around the 1.31 handle. I continue to favor fading rallies though as GBP looks to have put in a medium term top. I suspect the 1.3250-1.3300 area is the place to fade if we see that level again.
- Cross asset : SPX +0.10%, Gold $4210, US 10-Year 4.0825%, BBDXY 1218, Crude Oil $58.40
- Data/Events : France ILO Unemployment Rate, EZ ECB Publishes Economic Bulletin/Industrial Production
Fig 1: BBDXY Spot Daily Chart
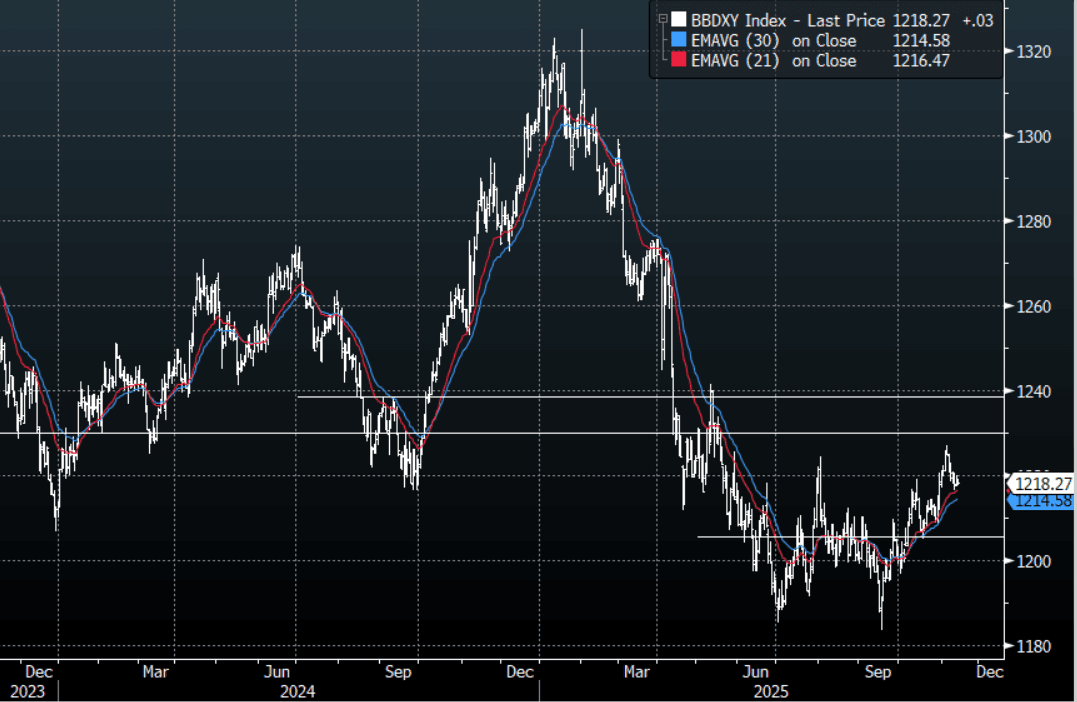
Source: MNI - Market News/Bloomberg Finance L.P
NZD: Asia-Pac: NZD/USD - Drifts Back Toward 0.5650
The NZD/USD had a range today of 0.5647 - 0.5667 in the Asia-Pac session, going into the London open trading around 0.5655, -0.25%. The NZD drifted lower as risk opened weaker on the Asia open, it has since recovered and the NZD has moved off the lows. The NZD does stand out as a vehicle to express a short in but should this bout of improved risk sentiment grow it will be tough for the NZD to ignore it and it could play catch up to the move at some point. I still suspect any decent bounce in the NZD will again attract sellers though. The first sell area on a pullback would be around 0.5750 and then the more pivotal 0.5850 area. Dips on the day toward 0.5630-40 needs to hold for the short-term retracement to potentially extend.
- MNI AU - Retail Spending Growth Turns Down Again: Spending on cards continues to have positive momentum but remains soft with annual growth rates turning down. Data since the last RBNZ decision are consistent with only a weak recovery and so another rate cut, probably 25bp, on 26 November is likely. October retail transactions rose 0.2% m/m to be up only 0.2% y/y down from 0.9% but still up 2.2% 3m/3m annualised. Total expenditure was flat on the month and deteriorated to -1.7% y/y from -1.3%, the weakest since May.
- Options : Closest significant option expiries for NY cut, based on DTCC data: 0.5380(NZD460m). Upcoming Close Strikes : none - BBG
- The NZD/USD Average True Range for the last 10 Trading days: 38 Points
Fig 1: NZD/USD Spot Daily Chart
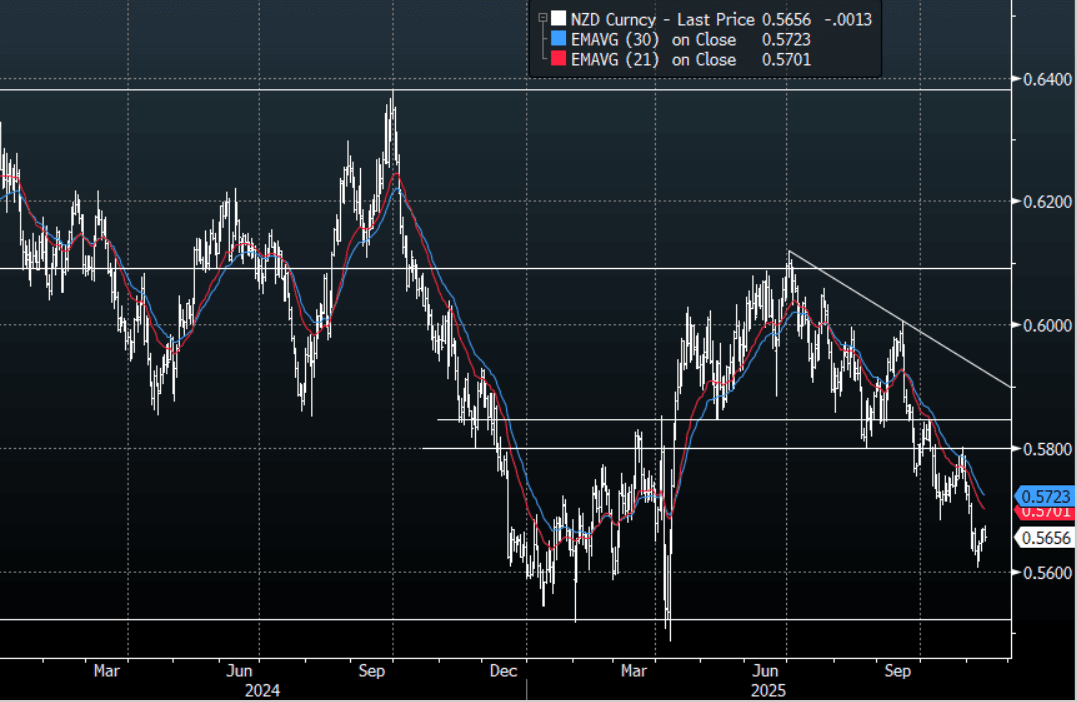
Source: MNI - Market News/Bloomberg Finance L.P
Bloomberg Finance LP
ASIA STOCKS: Stocks Subdued as US Ends Shutdown, Eyes on European Open
Asian bourses were mostly mixed as markets tread water and investors waited for further news on US shutdown as US futures rose marginally. In Japan, the Nikkei 225 advanced modestly while South Korea’s KOSPI edged up, reflecting cautious optimism about the resolution of the U.S. government shutdown. In contrast, Hong Kong’s Hang Seng Index slipped marginally, signaling mixed sentiment across the region and showcasing the onshore / offshore divergence again.
- The NIKKEI showed only modest strength today with local reports suggesting portfolio transitions out of the tech sector into more broader allocation in stocks suggesting that the strength of the recent rally, may be softening.
- The KOSPI is up +0.33% again with some reports that investors may be lightening their allocation to tech sector with names like SK Hynix up +270% from April lows.
- In China the ongoing theme of a divergent trend onshore and offshore continued with no sectorial trends evident, but liquidity ample following Central Bank injections earlier.
- SE Asia's major bourses were quiet also with limited movement from the open in what appears to be markets waiting on a catalyst
OIL: Crude Holds Losses As Waits For Thursday’s Supply Information
Oil prices fell sharply on Wednesday following OPEC estimates for Q3 shifting to a surplus after it previously approximated a deficit. Crude has held onto those losses during today’s APAC trading with little change in benchmarks as the market waits for more supply/demand information to be released later today. With geopolitical worries fading, the focus is firmly on excess supply developments.
- WTI is down 0.1% to $58.42/bbl off the intraday low of $58.12 and close to the high at $58.50. There is currently no spread between the December and January contracts signalling a weakening market. Brent is flat at $62.69, close to today’s peak of $62.77. It fell to $62.34 early in the session.
- The IEA November report is published Thursday and will be monitored for any changes to forecasts that increase the expected 2026 surplus, which is already projected to be a record. The IEA tends to be less optimistic than OPEC.
- Bloomberg reported a US oil inventory build of 1.3mn barrels last week, according to people familiar with the API data. Gasoline stocks continued to decline though (-1.4mn) but distillate rose 944k. The official EIA data is out today and previously showed product builds as refinery utilisation declined.
- Chevron sees lower oil prices in 2026 due to higher supply.
- The Fed’s Daly, Kashkari, Musalem and Hammack speak later. The ECB’s Buch, Donnery, Elderson and Machado appear as well as BoE’s Greene. UK Q3 GDP, September IP & trade, France Q3 unemployment and euro area September IP are released.
Gold Slightly Higher As Waits For Economic Clarity As Shutdown Ends
Gold was lower before the US House of Reps vote to end the record government shutdown but then stabilised thereafter and is currently up 0.4% to $4211.5/oz, remaining below the bull trigger at $4381.5. Overall it has moved in a narrow range today of $4180.16/$4212.56 as it now waits for data after already pricing in Fed easing in its Wednesday rally. Delayed data will probably be released from next week but the White House has said that October inflation and jobs data may never be published.
- The US dollar is flat so far today and the 2-year yield slightly higher. The market has around 15bp of easing priced in for the 10 December Fed decision with a full cut by January.
- US government funding has only been assured to 30 January and a compromise will again be needed to avoid a repeat of the 2025 shutdown. The Democrats have ensured a vote on an extension of healthcare subsidies for December.
- Silver has rallied rising another 1.5% after 4% on Wednesday. It is currently around $54.06, close to the intraday high at $54.167, approaching the bull trigger at $54.480. It fell to $52.8939 early in the session.
- The Fed’s Bostic and Collins appear to have a high bar for further easing as inflation remains above target and so other comments will be monitored closely. Later Daly, Kashkari, Musalem and Hammack speak.
- UK Q3 GDP, September IP & trade, France Q3 unemployment and euro area September IP are released. The ECB’s Buch, Donnery, Elderson and Machado speak as well as BoE’s Greene.
CHINA: Friday Data Preview: Retail Sales, CGBs in Tight Ranges
- China ends this week with a large data dump of October data Friday, with retail sales the most widely watched.
- Retail sales expanded +3.0% in September with some market observers suggesting a monetary policy intervention is needed to support domestic demand. Retail sales are forecast to rise +2.8% in October yet domestic press is focusing in on JD.COM's result release this week, where it reported orders surged 60% during Singles Day, with sales data from Alibaba and PDD holdings yet to come.
- The days of 10% growth in retail sales in China appear over, with the last few years seeing a fairly constant 2-3% result, consistent with October expectations.
- Industrial production surprised to the upside in September, in what some commentators suggested was exporters getting goods out ahead of the Xi / Trump meeting. September’s result of +6.5% was the biggest expansion in 3-months and back above the 3-Yr average of +5.7%. It is expected to moderate in October back towards the 3-Yr average.
- Other data out for the week includes New Yuan Loans / Aggregate Financing, Money Supply and Fixed Assets (ex Rural) YTD and Property Investment and Property Sales, New and Used home prices. Property Investment and Property Sales – much like new and used home prices – continues to be mired in deflation and this trend is expected to continue.
- Bond markets remain very stable with China's 10-Yr CGB trading in a tight +25bps range since the onset of the trade war. Bonds are reactive to the daily liquidity management via the OMO, with the uptick in injections earlier in the November seeing the 10-Yr CGB back away from 1.90%.
- Tomorrow's data is likely to show that the broader economy away from housing is continuing to expand at moderate pace. A fall back towards 2% for retail sales would be a warning signal that could predicate policy changes, though a low probability outcome. The data is released after the OMO which provides the PBOC and opportunity to dampen volatility if needed.
Fig 1: CGB 10-Yr yield : in tight channel since the onset of the trade war in April
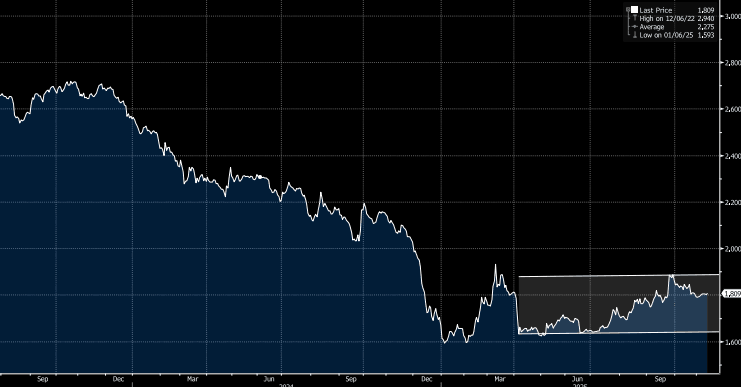
SOUTH KOREA: Bond Markets React to Rhee Comments, Rate Cuts a Memory
- Last week we noted that the recent BOK decision driven by concerns from the housing sector and an improving trend for CPI will likely see the BOK on hold for some time. The housing market challenge is something that many developed nations have faced or are still facing and that up until recently, the Korean swaps curve had a mid year 2026 cut priced in, but no longer does. In the bullet we asked the question whether the next move for the BOK is up? (source MNI)
- Korean bond futures have fallen for throughout November, down -1.97pts on the 10-Yr bond futures, with up days followed by losses the next day in excess of the gains.
- 10-Yr Korean treasury futures were down -0.28 in the morning session as the unwind of rate cuts continued. However, comments from the BOK Governor Rhee that the BOK 'remains in an easing cycle, but the timing and size of cuts may shift depending on data," and that Seoul's property prices were "way above" the central bank's expectations, and authorities need to see how the government's steps to cool the market play out" drove bond futures even lower, finishing down -0.71 at 114.29.
- The market reaction seems overdone, an idea supported by the rally at the open today as what Governor Rhee said, has been said before.
- However, as pointed out yesterday in our bullet "Inflation Green Shoots Could See Rates on Hold for Near Term, " given the focus on the Seoul property market, the BOK could be on hold for some time.
- In the cash government yield space, we are up strongly in Nov to date, see the chart below. Buying interest may emerge on further extensions higher (3% for 3yr and close to 3.50% for the 10yr), particularly with still modest growth prospects into 2026.
Fig 1: South Korean 3yr and 10yr Bond Yields
Source: Bloomberg Finance L.P./MNI
UP TODAY (TIMES GMT/LOCAL)
| Date | GMT/Local | Impact | Country | Event |
| 13/11/2025 | 0700/0700 | *** | UK Monthly GDP | |
| 13/11/2025 | 0700/0800 | *** | Final Inflation Report | |
| 13/11/2025 | 0700/0700 | ** | Trade Balance | |
| 13/11/2025 | 0700/0700 | ** | Index of Services | |
| 13/11/2025 | 0700/0700 | ** | Index of Production | |
| 13/11/2025 | 0700/0700 | ** | Output in the Construction Industry | |
| 13/11/2025 | 0700/0700 | *** | GDP First Estimate | |
| 13/11/2025 | 0700/0800 | *** | Final Inflation Report | |
| 13/11/2025 | 0730/0730 | BOE MPG Minutes Released | ||
| 13/11/2025 | 0930/0930 | Productivity Flash Estimates | ||
| 13/11/2025 | 1000/1100 | ** | EZ Industrial Production | |
| 13/11/2025 | 1200/1200 | BOE Greene in Panel on Central Bank Independence | ||
| 13/11/2025 | - | *** | Money Supply | |
| 13/11/2025 | - | *** | New Loans | |
| 13/11/2025 | - | *** | Social Financing | |
| 13/11/2025 | - | ECB de Guindos at ECOFIN Meeting in Brussels | ||
| 13/11/2025 | 1300/1400 | ECB Elderson Moderates Climate and Banks Panel | ||
| 13/11/2025 | 1300/0800 | San Francisco Fed's Mary Daly | ||
| 13/11/2025 | 1330/0830 | *** | Jobless Claims | |
| 13/11/2025 | 1330/0830 | ** | WASDE Weekly Import/Export | |
| 13/11/2025 | 1330/0830 | *** | CPI | |
| 13/11/2025 | 1330/0830 | *** | CPI | |
| 13/11/2025 | 1330/0830 | *** | CPI | |
| 13/11/2025 | 1530/1030 | Minneapolis Fed's Neel Kashkari | ||
| 13/11/2025 | 1630/1130 | ** | US Bill 04 Week Treasury Auction Result | |
| 13/11/2025 | 1630/1130 | * | US Bill 08 Week Treasury Auction Result | |
| 13/11/2025 | 1700/1200 | ** | DOE Weekly Crude Oil Stocks | |
| 13/11/2025 | 1700/1200 | ** | US DOE Petroleum Supply | |
| 13/11/2025 | 1715/1215 | St. Louis Fed's Alberto Musalem | ||
| 13/11/2025 | 1720/1220 | Cleveland Fed's Beth Hammack | ||
| 13/11/2025 | 1800/1300 | *** | US Treasury Auction Result for 30 Year Bond | |
| 13/11/2025 | 1900/1400 | ** | Treasury Budget | |
| 14/11/2025 | 0001/0001 | KPMG/REC Report on Jobs | ||
| 14/11/2025 | 0200/1000 | *** | Fixed-Asset Investment | |
| 14/11/2025 | 0200/1000 | *** | Retail Sales | |
| 14/11/2025 | 0200/1000 | *** | Industrial Output | |
| 14/11/2025 | 0200/1000 | ** | Surveyed Unemployment Rate M/M | |
| 14/11/2025 | 0700/0800 | ** | Unemployment | |
| 14/11/2025 | 0745/0845 | *** | HICP (f) | |
| 14/11/2025 | 0800/0900 | *** | HICP (f) | |
| 14/11/2025 | 0900/1000 | Foreign Trade | ||
| 14/11/2025 | 1000/1100 | * | Trade Balance | |
| 14/11/2025 | 1000/1100 | *** | EZ GDP 2nd (Flash) | |
| 14/11/2025 | 1030/1130 | ECB Elderson Keynote at ECB Banking Supervision Forum | ||
| 14/11/2025 | 1330/0830 | ** | Monthly Survey of Manufacturing | |
| 14/11/2025 | 1330/0830 | ** | Wholesale Trade | |
| 14/11/2025 | 1330/0830 | *** | Retail Sales | |
| 14/11/2025 | 1330/0830 | *** | PPI | |
| 14/11/2025 | 1330/0830 | *** | PPI | |
| 14/11/2025 | 1330/1430 | ECB Elderson Remarks at COP30 Finance Day |