MNI EUROPEAN MARKETS ANALYSIS: USD Firms, NZD/USD Near 0.5600
- China Oct trade figures were weaker than forecast, with exports falling for the first time since Feb. Fallout for market sentiment has been limited, with broader focus on risk trends.
- Most Asia Pac equities are weaker, albeit up from worst levels. Kospi volatility remains a standout. The USD is mostly higher. NZD/USD is the weakest G10 performer, tracking towards 0.5600.
- Japan household spending was weaker than forecast, while new PM Takaichi stated that Japan's economic policy has changed.
- Coming up, focus will be on Fed speakers, University of Michigan Sentiment / Expectations and Consumer Credit. Canadian jobs data is also due.
US TSYS: Treading Water Ahead Today's Fed Speakers & UofM Sentiment Data
TYZ5 is dealing at 112-26, -0-00+ from closing levels in today's Asia-Pac session.
- Yesterday, US tsys turned to alternative employment data due to the ongoing US Govt shutdown and finished richer.
- Cash US tsys are slightly cheaper in today's Asia-Pac session after yesterday's solid rally.
- Due to the ongoing US Government shutdown, the Bureau of Labour Statistics' October employment report has been suspended. Focus will be on Fed speakers, University of Michigan Sentiment / Expectations and Consumer Credit.
STIR: $-Bloc Pricing Shows Mixed Performance Over Past Three Weeks
- Interest rate expectations across the $-bloc have seen mixed performance over the past 3 weeks, with Australia (+25bps) and the US (+15bps) firmer, but New Zealand (-2bps) and Canada (-4bps) little changed.
- In Australia this week, the RBA Monetary Policy Board unanimously left rates at 3.6%, as was widely expected, and sounded generally cautious. With risks "in both directions" and the degree of restrictiveness difficult to assess, the Board doesn't have a stance. Neither a cut nor a hike was discussed.
- Staff trimmed mean projections were revised higher over the rest of 2025 and 2026, with the important 2q/2q annualised rate returning to 3% in Q1 and 2.6% in Q4, which may allow a rate cut from May if this eventuates. Decisions remain highly data dependent and will be made on a "meeting-by-meeting basis".
- In the US, markets appear to be still adjusting to the surprise from the October 29 FOMC meeting, where Chair Powell opened the post-meeting press conference by underscoring the Committee’s divisions on the path ahead: "In the Committee's discussions at this meeting, there were strongly differing views about how to proceed in December. A further reduction in the policy rate at the December meeting is not a foregone conclusion, far from it. Policy is not on a preset course."
- The next key regional event is the RBNZ policy decision on November 26. 28bps of easing is priced for November, with a cumulative 36 bps by February 2026.
- Looking ahead to December 2025, current market-implied policy rates expected easing is as follows: US (FOMC): 3.70%, -17bps; Canada (BOC): 2.24%, -1bp; Australia (RBA): 3.56%, -4bps; and New Zealand (RBNZ): 2.21%, -29bps.
Figure 1: $-Bloc STIR (%)
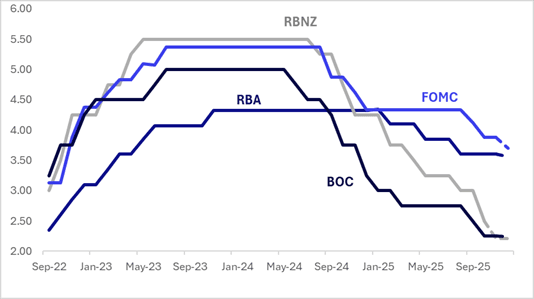
Source: Bloomberg Finance LP / MNI
JGBS: Slightly Cheaper After A Subdued End To the Week, BOJ SOO On Monday
JGB futures are unchanged after giving up overnight gains fueled by a rally in US tsys.
- Yesterday, US tsys turned to alternative employment data due to the ongoing US Govt shutdown. Revelio Labs' estimate of October nonfarm payrolls growth showed its first negative M/M reading since May.
- Cash US tsys are slightly cheaper in today's Asia-Pac session after yesterday's solid rally.
- MNI - Sep Household Spending Below F/Cs, Focus To Get Real Wages Higher: Japan Sep real household spending data was softer than forecast. Real spending fell 0.7% m/m, against a -0.1% forecast (per Rtrs). In y/y terms, we were up 1.8%y/y, against a 2.5% forecast. Given generally softer cash earning outcomes in recent month,s some moderation in spending was not a surprise. The authorities' focus will remain on returning cash earnings growth to real positive territory, as without that, we may see spending trends soften as we progress towards year-end and into 2026.
- Cash JGBs are flat to 1bp cheaper across benchmarks. The benchmark 10-year yield is 0.1bp higher at 1.684% versus the cycle high of 1.705%.
- Swap rates are 1-2bps higher.
- On Monday, the local calendar will see BOJ Summary of Opinions (Oct. MPM) and Leading/Coincident Index data alongside a speech by BOJ Board Nakagawa in Okayama.
JAPAN DATA: Sep Household Spending Below F/Cs, Focus To Get Real Wages Higher
Japan Sep real household spending data was softer than forecast. Real spending fell 0.7%m/m, against a -0.1% forecast (per Rtrs). In y/y terms we were up 1.8%y/y, against a 2.5% forecast. Given generally softer cash earning outcomes in recent months some moderation in spending was not a surprise, although as the chart below highlights there is still somewhat of a wedge between spending and earnings trends. The real spending backdrop has remained fairly resilient, staying positive in y/y terms for the past 5 months. The authorities focus will remain on returning cash earnings growth to real positive territory as without that we may see spending trends soften as we progress towards year end and into 2026.
- Incomes were flat in y/y terms for Sep, after rising 2.8%y/y in Aug. Food and housing spending fell in y/y terms, while medical care and transport were up above 11% as an offset.
Fig 1: Japan Real Household Spending & Cash Earnings Y/Y
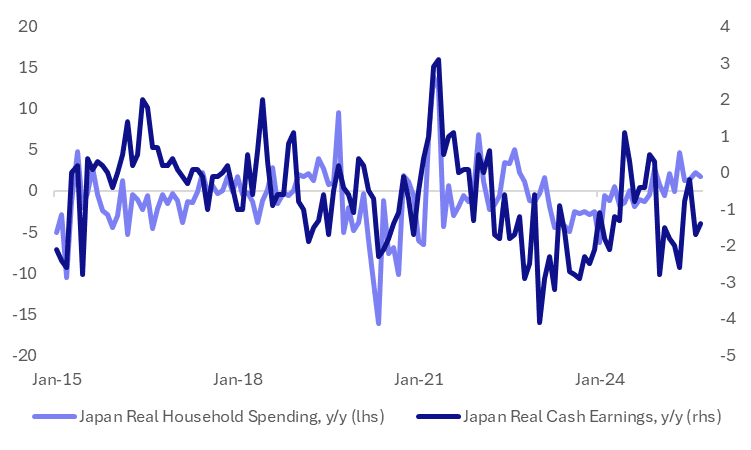
Source: Bloomberg Finance L.P./MNI
JAPAN DATA: Inflows Into Japan Stocks Continued, Locals Sold Offshore Assets
At the end of Oct we still had positive offshore inflow momentum to local Japan stocks. Last week's inflow bought the late to Sep to early Oct inflow sum to nearly ¥7.15trln. Since the start of Nov we have seen equity weakness emerge, although so far the NKY 225 is supported sub the 50000 level. Market risk aversion is elevated amid AI valuation concerns and given the extent of recent run ups. We may see offshore investors trim some of their Japan holdings in response, although dips since April in benchmark Japan equity indices have been very well supported. Offshore investors added to Japan bonds as well, last week, but cumulative inflows were only modestly positive for most of Oct.
- In terms of Japan outbound flows, we saw local investors continue to sell offshore bonds. This marked the fifth out the last six weeks we have seen net selling in this space. Cumulative outflows to offshore bonds are still positive in recent months, due to chunky buying through September. Global bond returns have struggled for upside in recent months, largely flat since early Sep.
- Local investors also sold offshore equities, which was a consistent theme through much of Oct.
Table 1: Japan Weekly Offshore Investment Flows
| Billion Yen | Week ending Oct 31 | Prior Week |
| Foreign Buying Japan Stocks | 690.1 | 1345.3 |
| Foreign Buying Japan Bonds | 280.6 | -249.2 |
| Japan Buying Foreign Bonds | -354.4 | -354.6 |
| Japan Buying Foreign Stocks | -581.1 | -62.1 |
Source: Bloomberg Finance L.P./MNI
JAPAN: Fair To Say Japan's Economic Policy Has Changed - Takaichi
New Japan PM Takaichi was speaking in parliament earlier and stated that it is fair to say that the country's economic policy has changed (via BBG). Takaichi stated that a single year goal of a primary government budget surplus was being abandoned and rather the focus would be on a multiple year horizon (for such an objective). Other points Takaichi noted was that, nominal growth should be stronger than JGB yield levels, while she also planned to bring down the country's debt to GDP ratio (per BBG). Earlier she remarked that Abenomics had not generated strong enough economic growth, with Covid impact impacting momentum.
- The mantra of the Takaichi regime has been expansive but responsible fiscal policy. Focus will be on the first extra budget of the Takaichi regime, which is expected before the end of this year.
AUSSIE BONDS: Richer But Off Bests, YC Vulnerable To Rates Outlook
ACGBs (YM +2.0 & XM +2.5) are stronger but near-session cheaps.
- Cash ACGBs are 2-3bps richer with the AU-US 10-year yield differential at +25bps.
- Unlike its NZ counterpart, which has steepened to its highest level since 2021, the ACGB yield curve remains near its flattest point since April, following the RBA’s decision this week to keep the cash rate unchanged at 3.60%. The RBA was generally cautious with future decisions remaining highly data dependent. Consistent with this message, the AU 3s10s yield curve appears vulnerable to any upward revision in year-ahead cash rate expectations (see chart).
- The latest round of ACGB Nov-33 supply sees very strong pricing, with the weighted average yield printing 0.66bp through prevailing mids (per Yieldbroker) with a cover ratio of 4.9300x.
- Over the past three weeks, interest expectations for year-end in NZ, along with Canada, have been the clear outperformer in the $-bloc, with a slight softening (-2bps). In contrast, year-end expectations for official rates have risen 15bps in the US and 25bps in Australia over the same period.
- The bills strip is flat to +2 across contracts, with a flattening bias.
- RBA-dated OIS pricing is showing a 25bp rate cut in December at an 11% probability, with a cumulative 20bps of easing priced by mid-2026.
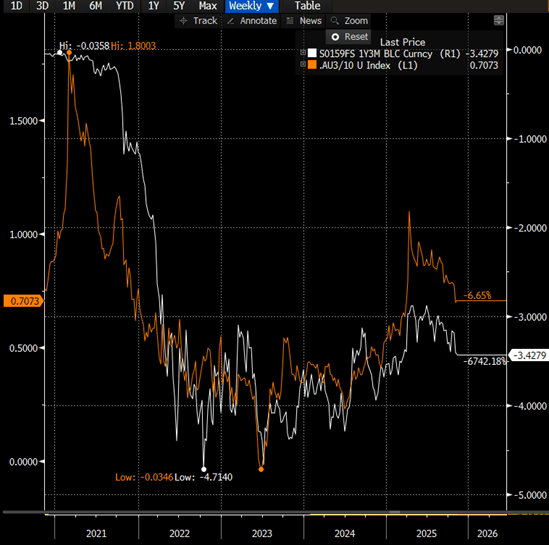
Bloomberg Finance LP
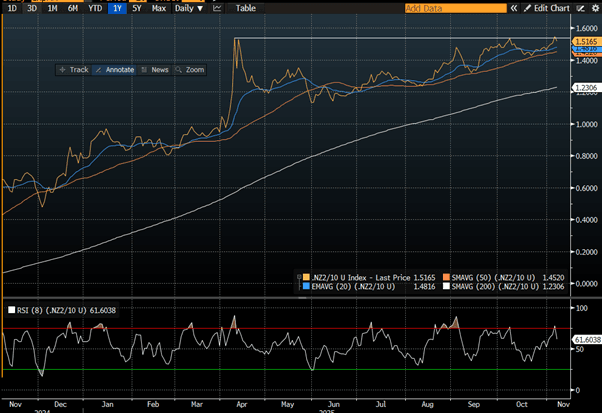
BONDS: NZGBS: Curve Steepener Takes A Breather
NZGBs closed showing a bull-flattener, with benchmark yields 2-5bps lower.
- Today's move sees the 2/10 curve pull back from cycle highs, just shy of the 2021 high. (see chart)
- The NZ-US 10-year yield differential was unchanged on the day at -1bp, while the NZ-AU differential was 3bps narrower at -26bps.
- Swap rates closed 3-4bps lower.
- RBNZ dated OIS pricing closed little changed across meetings. 28bps of easing is priced for November, with a cumulative 37bps by February 2026.
- Over the past three weeks, year-end rate expectations in NZ — along with Canada — have been the clear outperformers within the $-bloc, easing slightly by 2bps. In contrast, year-end expectations for policy rates have risen by 15bps in the US and 25bps in Australia over the same period.
- On Monday, the local calendar will be empty. The next release of note will be the RBNZ's Inflation Expectations data on Tuesday.
Bloomberg Finance LP
FOREX: Asia-Pac FX: The USD Drifts Higher As Risk Struggles In Asia
The BBDXY has had a range today of 1220.82 - 1222.64 in the Asia-Pac session; it is currently trading around 1222, +0.10%. Some interesting price action overnight as risk took another leg lower but the USD actually fell outside of pairs that are used as risk proxies such as the AUD, JPY and CHF. Some poor employment data and a market awaiting the Supreme Court ruling has given the USD bulls some pause. Intra-day I suspect sellers should re-emerge back toward the 1223.50 area, the first real buy zone is back toward the 1215 area. Look for the USD to do some work and chop around within the 1215-1230 range. A negative Supreme court ruling would be a dagger in the heart of the USD but these cases can take months to be decided so it's tough to be taking a clear directional view based on that outcome in the present moment.
- EUR/USD - Asian range 1.1535 - 1.1552, Asia is currently trading 1.1535. The pair continued to build on its support below 1.1500, I suspect rallies will now be sold toward the 1.1600-1.1650 area initially.
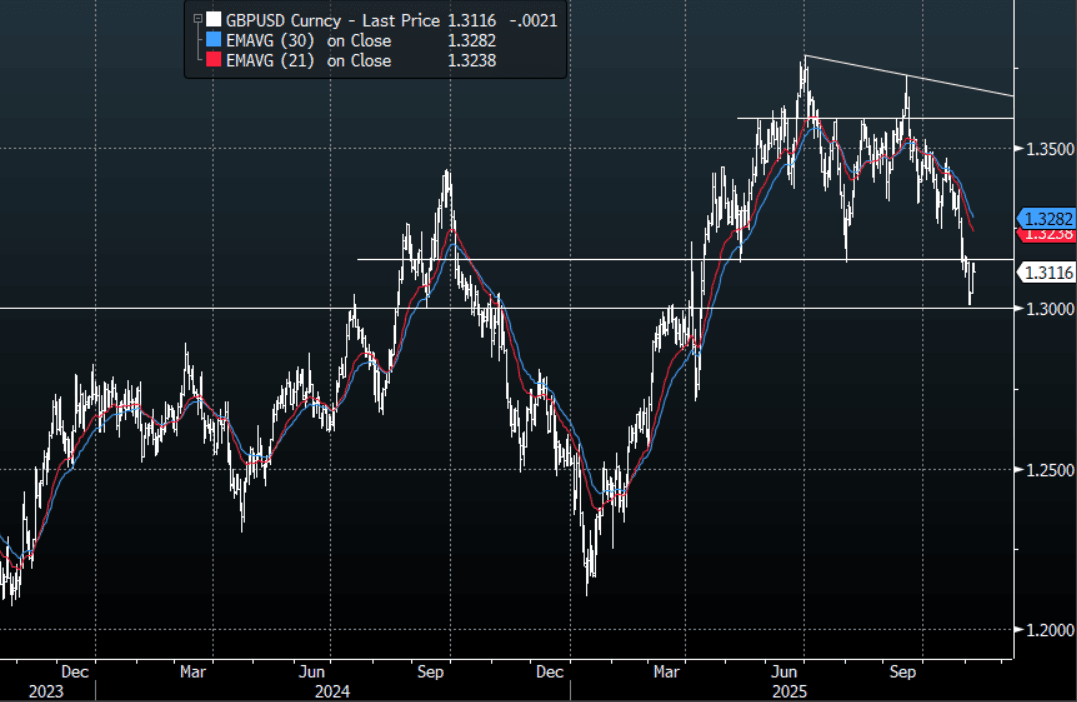
- GBP/USD - Asian range 1.3116 - 1.3142, Asia is currently dealing around 1.3115. The pair built on its bounce off the 1.3000 area yesterday. I continue to favor fading rallies though as GBP looks to have put in a medium term top. The first resistance is around 1.3150 but the 1.3250-1.3300 area is the place to fade if we see that level again.
- Cross asset : SPX -0.05%, Gold $3995, US 10-Year 4.093%, BBDXY 1222, Crude Oil $59.77
- Data/Events : France Trade Balance, Germany Trade Balance
Fig 1: GBP/USD Spot Daily Chart
Source: MNI - Market News/Bloomberg Finance L.P
NZD: Asia-Pac: NZD/USD Trades Heavy Toward 0.5600 As Risk Slides
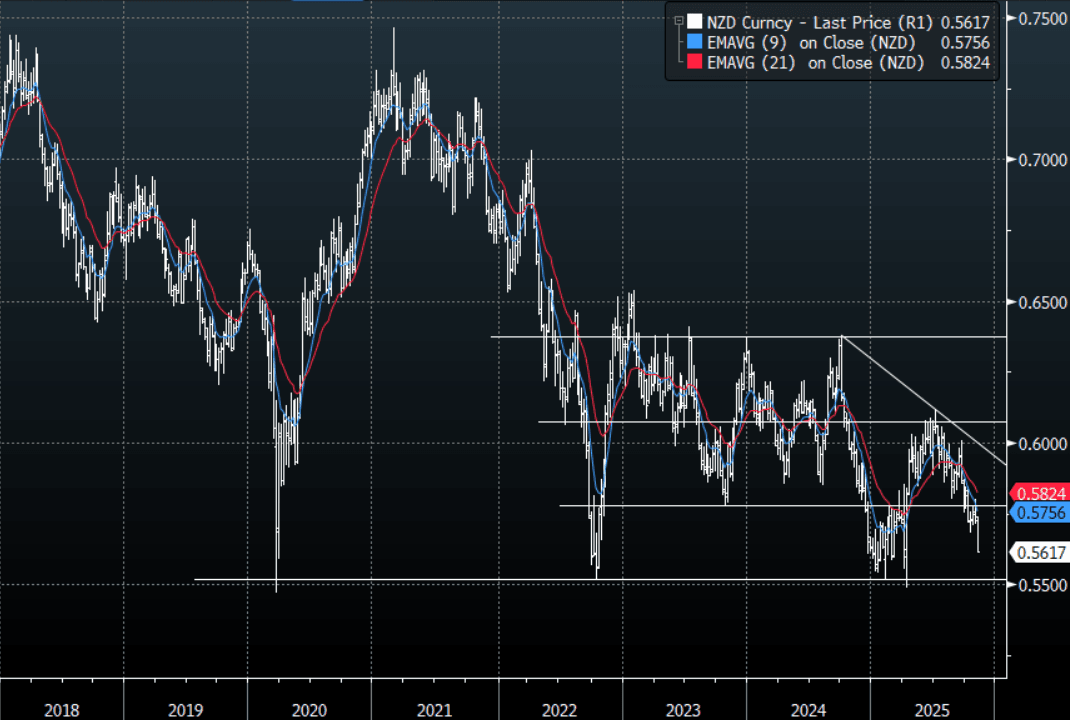
The NZD/USD had a range of 0.5615 - 0.5641 in the Asia-Pac session, going into the London open trading around 0.5620, -0.25%. Looks like there could be more to this pullback in risk and the NZD is being dragged lower with the AUD as a risk proxy. The price action is interesting in that the NZD was able to move lower even with the USD back under pressure. I am a little wary of positioning in the NZD market but price action for the moment is re-assuring. Look for rallies to remain heavy while risk stays under pressure, with the 0.5600 target basically reached the next target will be the pivotal 0.5500 area.
- China Weaker Headline Export & Import Growth, But Caveats Apply: China's headline Oct trade figures were weaker than forecasts, with export growth falling to -1.1%y/y, the weakest result since Feb this year (the market forecast a drop from 8.3% to 2.9%). Imports also moderated to 1.0%y/y from 7.4% in Sep (2.7% was the forecast). The important caveat is that we had the National Day holiday period in the first part of Oct (1st to the 8th), which could have impacted, while we were also coming off a high base of export growth from last year (+12.6%y/y for Oct 2024).
- Options : Closest significant option expiries for NY cut, based on DTCC data: none. Upcoming Close Strikes : 0.5600(NZD538m Nov12), 0.5800(NZD461m Nov 12) - BBG
Fig 1: NZD/USD Spot Weekly Chart
Source: MNI - Market News/Bloomberg Finance L.P
AUD: Asia-Pac: AUD/USD Drifts Lower With Risk
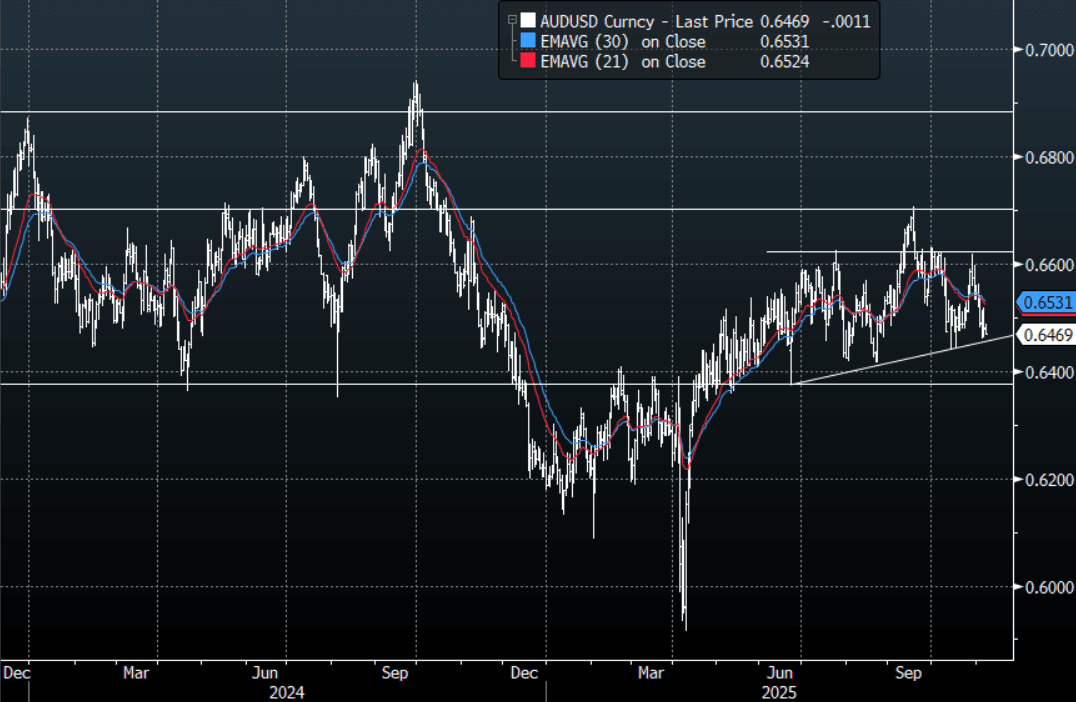
The AUD/USD has had a range today of 0.6468 - 0.6487 in the Asia- Pac session, it is currently trading around 0.6470, -0.20%. Looks like there could be more to this pullback in risk and the AUD is normally everyone's favourite proxy to use, should this correction in risk build the recent outperformance of the AUD especially in the crosses would be most at risk. The AUD/USD has moved back toward the 0.6450 area where it found good support earlier in the week. A lot rides on how risk trades from here, a break of the 0.6450 area would then target the more important 0.6350 area. Rallies above 0.6500 should find sellers on the day while risk trades poorly.
- "CHINA, AUSTRALIA OFFICIAL DISCUSS MULTILATERAL TRADING SYSTEM" - BBG
- MNI AU - Weaker Headline Export & Import Growth, But Caveats Apply : China's headline Oct trade figures were weaker than forecasts, with export growth falling to -1.1%y/y, the weakest result since Feb this year (the market forecast a drop from 8.3% to 2.9%). Imports also moderated to 1.0%y/y from 7.4% in Sep (2.7% was the forecast). The important caveat is that we had the National Day holiday period in the first part of Oct (1st to the 8th), which could have impacted, while we were also coming off a high base of export growth from last year (+12.6%y/y for Oct 2024).
- Options : Closest significant option expiries for NY cut, based on DTCC data: 0.6500(AUD1.22b), 0.6550(AUD 415m), 0.6600(AUD682m). Upcoming Close Strikes : 0.6500(AUD1.19b Nov 12), 0.6530(AUD882m Nov 12)- BBG
Fig 1: AUD/USD spot Daily Chart
Source: MNI - Market News/Bloomberg Finance L.P
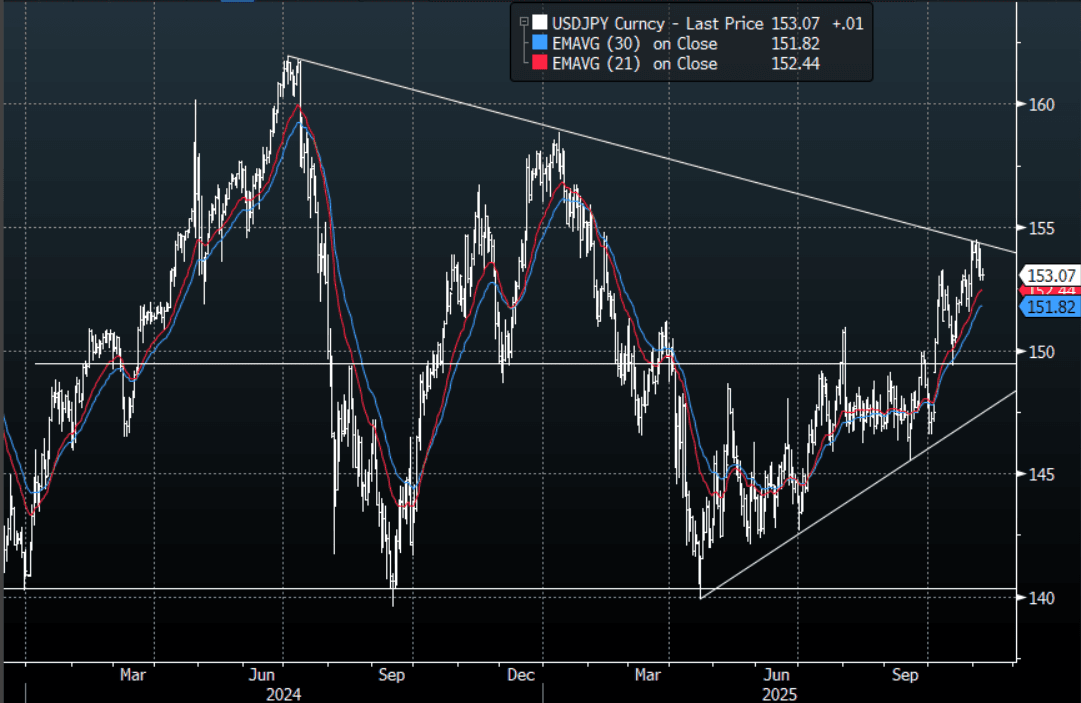
JPY: Asia-Pac: USD/JPY Consolidates Around 153.00
The USD/JPY range today has been 152.82 - 153.31 in the Asia-Pac session, it is currently trading around 153.10, +0.05%. The pair failed overnight again above the 154.00 area as cross-Yen came back under pressure as risk turned lower again. A lot depends on what your view is for risk from here, but the price action of the last few days signals we could be putting in a potential top and if a correction in risk plays out then I suspect the resistance around the 154/155 area should continue to offer solid resistance. With the crosses under pressure we could see some further pullbacks and therefore I suspect rallies on the day toward 153.50 should find better sellers, but I do think any correction lower will still find buyers happy to fade. The first buy zone is toward 151.50-152.00 and then the more important 149.00-150.00 area.
- MNI AU - Sep Household Spending Below F/Cs, Focus To Get Real Wages Higher: Japan Sep real household spending data was softer than forecast. Real spending fell 0.7%m/m, against a -0.1% forecast (per Rtrs). In y/y terms we were up 1.8%y/y, against a 2.5% forecast. Given generally softer cash earning outcomes in recent months some moderation in spending was not a surprise. The authorities focus will remain on returning cash earnings growth to real positive territory as without that we may see spending trends soften as we progress towards year end and into 2026.
- Options : Close significant option expiries for NY cut, based on DTCC data: none. Upcoming Close Strikes : none - BBG.
Fig 1 : USD/JPY Spot Daily Chart
Source: MNI - Market News/Bloomberg Finance L.P
ASIA STOCKS: Down As Kospi Pullback Continues, Philippines Near 2022 Lows
Major Asia Pac equity indices are faltering into the end of the week, amid concerns around US jobs momentum and elevated AI/tech valuations. US equity futures are modestly in the red, struggling for fresh upside, post cash losses in Thursday trade. Kospi weakness/volatility remains a standout. The Main index is off close to 3% at the time of writing, putting the index back near the 3900 level. Japan markets are down 2.2% in terms of the NKY 225, while most other markets are weaker as well, despite some modest pockets of strength in South East Asia.
- Offshore investors have sold close to $5bn of local South Korea stocks this week, the most since 2021. Trends today are skewed towards selling by offshore investors but in much more modest size, while local retail investors are buying the dip. South Korean stocks are a good barometer for both global and tech related trends, and given the extent of the recent run higher, some paring in risk is not surprising. Note even with this recent correction, the Kospi index is still 71% above early Apr lows.
- Japan markets had also seen strong offshore inflows through much of Oct, so some paring of risk may also be playing a role in this week's correction. The NKY 225 is challenging 20-day EMA support and is back under 50,000.
- China and Hong Kong markets are also weaker, the HSI down 1.1%. The tech sub index is off 2%. Earlier headlines crossed that the US would restrict Nvidia chip sales to China (even for scaled down products). The CSI 300 index is off 0.20%. We had Oct trade data which was weaker than expected earlier, with exports falling into negative territory, but there was a large holiday period in Oct and this also pre-dates the US-China trade truce.
- In South East Asia, most markets are only down modestly or up slightly. Indonesia remains an outperformer, while a resilient growth and domestic backdrop is also helping the Malaysian market (although recent ranges hold).
- The exception is the Philippines, where much weaker than expected Q3 GDP growth has weighed. The PCOMP was last down 1.5% to fresh lows last seen in 2022 (last around 5750 in index terms).
ASIA STOCKS: Few Bright Spots, South Korean Outflows Surge Amid Tech Concerns
Outflows, particularly from South Korea, have been the dominant feature of EM Asian market flows as we approach the end of the week. The past 5 trading days has seen just over $3.7bn in net outflows from South Korea, while the first 4 days of this week has seen close to $5bn in net outflows, the most since 2021 (on a weekly basis). Kospi volatility remains very high (the market down a further 2.5% so far today). South Korean stocks are a good barometer for both global and tech related trends, and given the extent of the recent run higher, some paring in risk is not surprising. Net flows are now back into negative territory for the year.
- Taiwan markets also continue to see outflows, albeit at a more modest pace. As we noted yesterday, the past trading month has seen stronger outflow momentum from Taiwan (nearly $7.4bn), so short term positioning may be more balanced relative to South Korea. Still, Taiwan maintains a modestly YTD inflow sum.
- Indian inflow momentum remains negative, while in South East Asia there are few bright spots, outside of Indonesia.
- Philippines markets may come under fresh pressure, as today's much weaker than expected Q3 GDP result has seen the PCOMP slump back to multi year lows.
Table 1: Asia Markets Net Equity Flows
| Yesterday | Past 5 Trading Days | 2025 To Date | |
| South Korea (USDmn) | -1251 | -3716 | -1376 |
| Taiwan (USDmn) | -321 | -3131 | 2502 |
| India (USDmn)* | -37 | -1486 | -16453 |
| Indonesia (USDmn) | -7 | 220 | -2373 |
| Thailand (USDmn) | -25 | 28 | -2972 |
| Malaysia (USDmn) | -31 | -61 | -4179 |
| Philippines (USDmn) | 4 | -13 | -759 |
| Total (USDmn) | -1669 | -8159 | -25609 |
| * Data Up To Nov 4 |
Source: Bloomberg Finance L.P./MNI
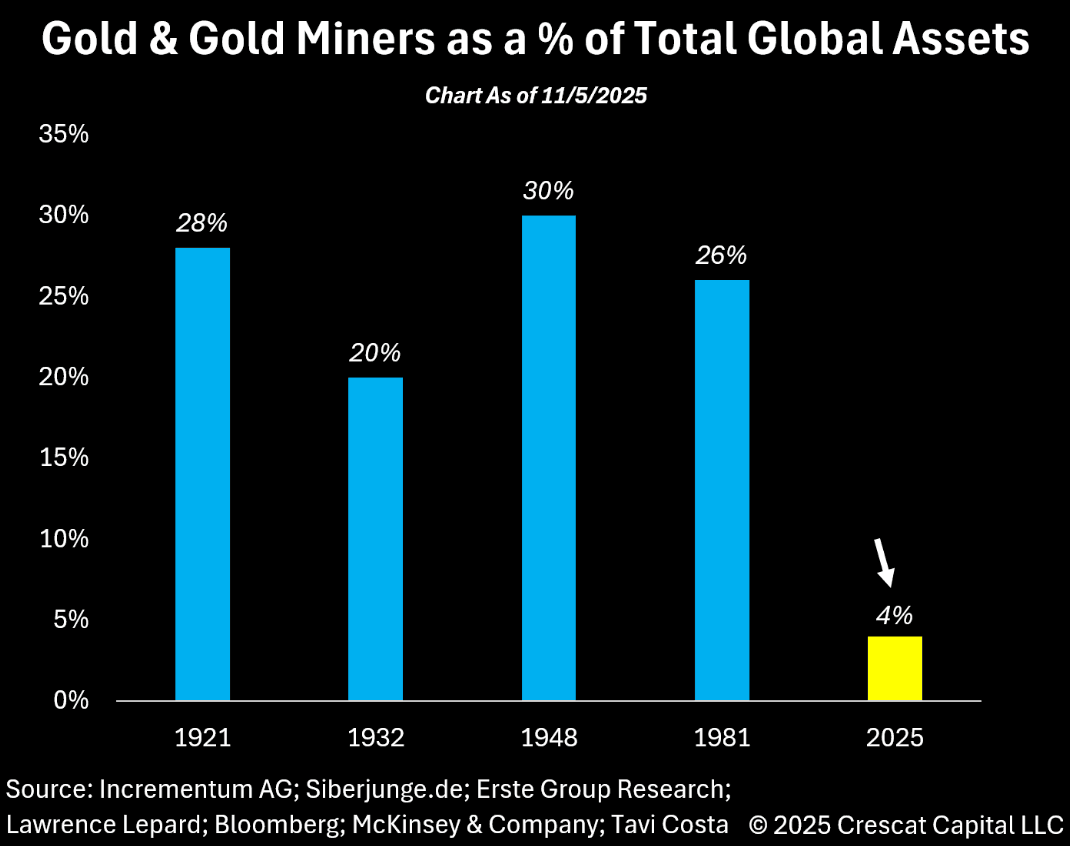
Gold - Trades In A $3900-$4100 Range As It Tries To Build A Base
The range overnight for gold was $3 965.87 - $4 019.60/oz, Asia is currently trading around 3991.00/oz, +0.35%. It had little reaction to the weakening US jobs data seen overnight. Gold has been chopping around sideways the last few days after finding support once more toward the $3,900/oz area. The market is trying to form a base from which to test higher again, the range looks set to be $3900-$4100/oz while this plays out.
- Otavio Costa of Crescat Capital reiterated his bullish sentiment on X, “This is a useful gauge of how far we still are from bubble territory in gold and the mining sector, in my view. Together, they currently represent about 5% of total global assets. That is approximately 7–5 times below the highs reached in prior cycles. Keep in mind that today’s debt imbalances are far worse than at any other time in history.
Fig 1 : Gold & Gold Miners % Of Total Global Assets
Source: MNI - Market News/Bloomberg/Crescat Capital
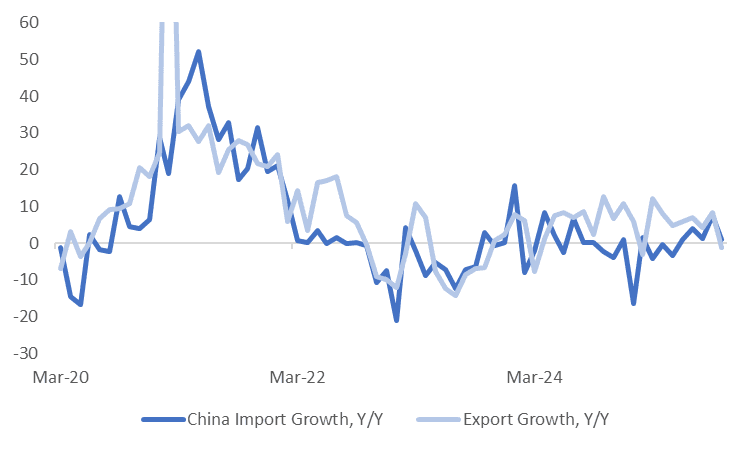
CHINA DATA: Weaker Headline Export & Import Growth, But Caveats Apply
China's headline Oct trade figures were weaker than forecasts, with export growth falling to -1.1%y/y, the weakest result since Feb this year (the market forecast a drop from 8.3% to 2.9%). Imports also moderated to 1.0%y/y from 7.4% in Sep (2.7% was the forecast). The important caveat is that we had the National Day holiday period in the first part of Oct (1st to the 8th), which could have impacted, while we were also coming off a high base of export growth from last year (+12.6%y/y for Oct 2024). These outcomes also pre-date the thawing in tensions between the US-China following the recent Xi/Trump meeting (which has seen tariffs lowered, albeit from elevated levels). China exports to the US were down 25.1%y/y in Oct. Hence the market may not downgrade China's growth expectations off the back of this data.
- Exports to other regions/economies were also generally softer in Oct. To the EU we fell to $43.89bn from $48.02bn. To ASEAN we were down a touch to $53.29bn from $53.66bn.
- Rare earth exports were up in volume terms from Sep levels (4343.5t versus 4000.3t)
- On the import side, growth also slowed, but remained marginally positive. In terms of commodity import volumes, oil rose to 48.36 mln tonnes, from 47.25 in Sep. Natural gas was lower though to 9.78 from 11.05.
- Copper imports were down modestly, while iron ore fell to 111.31 mln tonnes from 116.33 (which is coming off a high level). Coal imports were also down to 41.74 mln tonnes from 46.00.
Fig 1: China Exports & Imports Y/Y
Source: Bloomberg Finance L.P./MNI
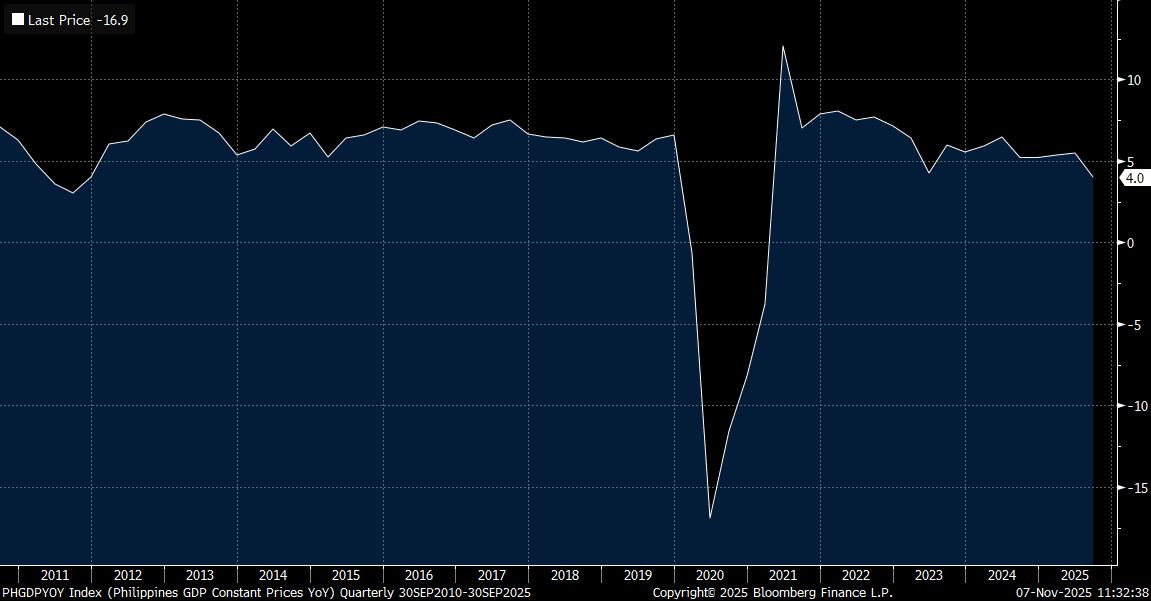
PHILIPPINES: Q3 GDP Well Below Forecasts, Adds To BSP Easing Case in Dec
Philippines Q3 GDP growth was well below expectations, printing at 4.0%y/y (versus 5.2% forecast, while 5.5% was the Q2 outcome). In q/q terms we rose 0.4%, half the pace expected (0.8% was consensus) and well below the 1.5% gain seen in Q2 q/q growth. The y/y pace is now at its slowest since 2021 (as growth rebounded from the Covid pandemic), see the chart below. Today's data adds firmly to the case for a BSP cut at the Dec policy meeting (held Dec 11). Economic Planning Minister Balisacan was confident growth would improve (with efforts to step up by the government) but noted it would be a challenge to meet the lower end of the growth target (5.5-6.5%).
- In terms of the detail, investment fell -2.8%y/y, from +1.2% in Q2, with construction down -0.5%y/y. The corruption scandal, around flood mitigation projects, which was revealed in July, was a headwind on activity and confidence.
- Private consumption rose 4.1%y/y, versus 5.3% in Q2. Government consumption was 5.8%y/y, versus 8.7% in Q2. Exports, up 7.0%y/y was one of the few bright spots.
- Q3 agricultural output fell 2.9%q/q, with typhoons impacting. This sector may perform better in Q4.
- Balisacan noted: "“We are fast tracking social protection and financial aid for families and capabilities affected by the recent calamities,” Economic Planning Secretary Arsenio Balisacan said at a briefing in Manila. “The government now has the authority to access emergency funds, mobilize national and local resources.” (via BBG).
Fig 1: Philippines Q3 Y/Y Growth At Multi Year Lows
Source: Bloomberg Finance L.P./MNI
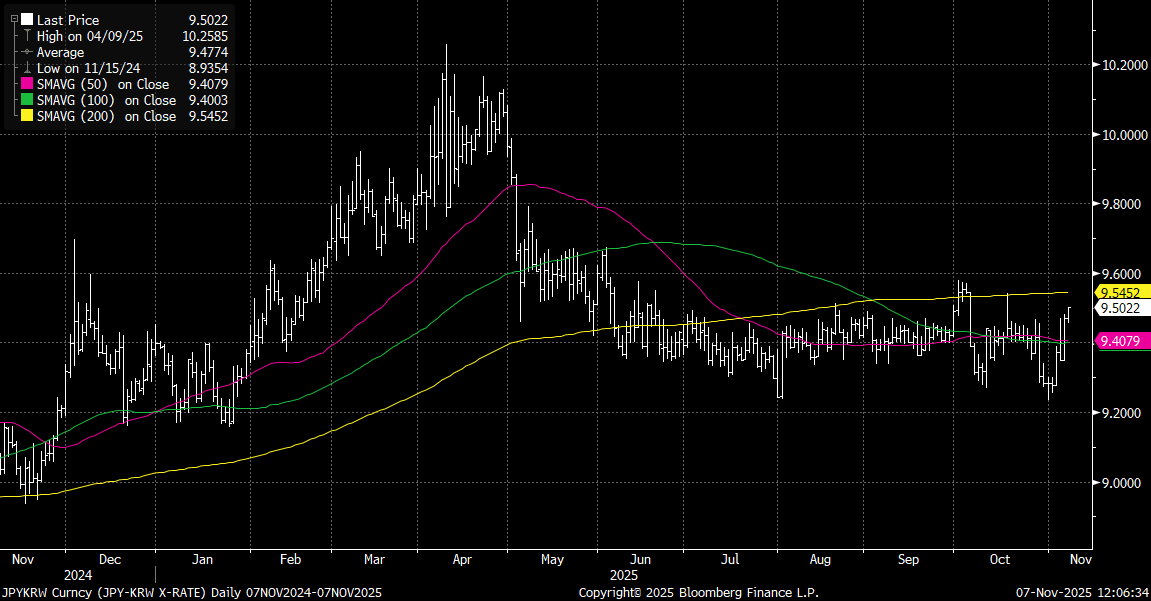
KRW: USD/KRW Breaks Above 1450, JPY/KRW Targeting 200-day MA Upside Test
Spot USD/KRW is comfortably above 1450 in latest dealings, last near 1454/55, up a further 0.30%. This puts us within striking distance of the 1460 region, levels last seen in early April of this year. The regional and local equity backdrop remains softer, the Kospi down around 1.8% and under 4000. Per the NBUY function on BBG, offshore investor flows have been positive so far today (but only for +$20mln). US equity futures are in the green but only modestly, with upside limited so far today. Earlier headlines around US restricting Nvidia chip sales (even scaled down versions) to China adding some caution to the broader tech equity outlook.
- The CNH/KRW cross is pressing to fresh cyclical highs, through, 204 (the lower USD/CNY fixing bias aiding CNH outperformance) while the JPY/KRW cross is around 9.5000, with the simple 200-day MA near 9.5450, a potential upside target.
- We are yet to hear from the authorities around this fresh bout of FX weakness.
Fig 1: JPY/KRW Pushing Towards Simple 200-day MA
Source: Bloomberg Finance L.P./MNI
UP TODAY (TIMES GMT/LOCAL)
| Date | GMT/Local | Impact | Country | Event |
| 07/11/2025 | 0700/0800 | ** | Trade Balance | |
| 07/11/2025 | 0745/0845 | * | Foreign Trade | |
| 07/11/2025 | 0800/0300 | New York Fed's John Williams | ||
| 07/11/2025 | 1110/1110 | BOE Saporta At ECB Money Market Conference | ||
| 07/11/2025 | 1200/0700 | Fed Vice Chair Philip Jefferson | ||
| 07/11/2025 | 1200/1200 | BOE Market Participants Survey | ||
| 07/11/2025 | - | BOE MPG Agenda Published | ||
| 07/11/2025 | 1330/0830 | *** | Labour Force Survey | |
| 07/11/2025 | 1330/0830 | *** | Employment Report | |
| 07/11/2025 | 1330/0830 | *** | Employment Report | |
| 07/11/2025 | 1330/0830 | *** | Employment Report | |
| 07/11/2025 | 1330/0830 | *** | Employment Report | |
| 07/11/2025 | 1330/1430 | ECB Elderson At Bundesbank Event | ||
| 07/11/2025 | 1500/1000 | ** | University of Michigan Surveys of Consumers Inflation Expectation | |
| 07/11/2025 | 1500/1000 | *** | U. Mich. Survey of Consumers | |
| 07/11/2025 | 1515/1515 | BOE Pill At National Agency Briefing | ||
| 07/11/2025 | 1600/1100 | ** | NY Fed Survey of Consumer Expectations | |
| 07/11/2025 | 1800/1300 | ** | Baker Hughes Rig Count Overview - Weekly | |
| 07/11/2025 | 1800/1300 | ** | Baker Hughes Rig Count Overview - Weekly | |
| 07/11/2025 | 1800/1300 | ** | Baker Hughes Rig Count Overview - Weekly | |
| 07/11/2025 | 2000/1500 | * | Consumer Credit | |
| 07/11/2025 | 2000/1500 | Fed Governor Stephen Miran |