CHINA DATA: Weaker Headline Export & Import Growth, But Caveats Apply
China's headline Oct trade figures were weaker than forecasts, with export growth falling to -1.1%y/y, the weakest result since Feb this year (the market forecast a drop from 8.3% to 2.9%). Imports also moderated to 1.0%y/y from 7.4% in Sep (2.7% was the forecast). The important caveat is that we had the National Day holiday period in the first part of Oct (1st to the 8th), which could have impacted, while we were also coming off a high base of export growth from last year (+12.6%y/y for Oct 2024). These outcomes also pre-date the thawing in tensions between the US-China following the recent Xi/Trump meeting (which has seen tariffs lowered, albeit from elevated levels). China exports to the US were down 25.1%y/y in Oct. Hence the market may not downgrade China's growth expectations off the back of this data.
- Exports to other regions/economies were also generally softer in Oct. To the EU we fell to $43.89bn from $48.02bn. To ASEAN we were down a touch to $53.29bn from $53.66bn.
- Rare earth exports were up in volume terms from Sep levels (4343.5t versus 4000.3t)
- On the import side, growth also slowed, but remained marginally positive. In terms of commodity import volumes, oil rose to 48.36 mln tonnes, from 47.25 in Sep. Natural gas was lower though to 9.78 from 11.05.
- Copper imports were down modestly, while iron ore fell to 111.31 mln tonnes from 116.33 (which is coming off a high level). Coal imports were also down to 41.74 mln tonnes from 46.00.
Fig 1: China Exports & Imports Y/Y
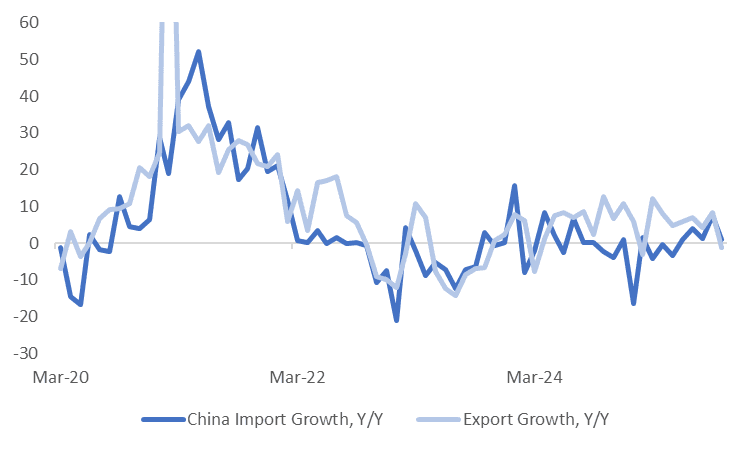
Source: Bloomberg Finance L.P./MNI
Want to read more?
Find more articles and bullets on these widgets:
Historical bullets
BONDS: Bull-Steepener After RBNZ Cuts By 50bp
NZGBs closed 4-7bps richer after the RBNZ cut 50bps to 2.50%.
- The MPC discussed cutting the OCR by 25bp or 50bp and all members agreed the latter was appropriate given material spare capacity in the economy. Given that this is likely to persist for some time and that while the economy has begun to recover it remains lacklustre, further cuts bringing policy into stimulatory territory are likely. In line with this it said that “the Committee remains open to further reductions in the OCR”.
- The MPC’s inflation concern appeared to shift this month. In August, it said it could ease policy further “if medium-term inflation pressures continued to ease as expected”, whereas this month it seemed more concerned with undershooting the target mid-point, stating it “remains open to further reductions … for inflation to settle sustainably” near the 2% mid-point over the medium-term.
- Swap rates closed 4-6bps lower on the day.
- RBNZ dated OIS pricing closed 9-15bps softer across meetings. 34bps of easing had been priced for this meeting. A cumulative 62bps of easing had been priced by November 2025 versus 75bps now (including today’s move).
- Tomorrow, the local calendar will see the NZ Government 12-Month Financial Statements.
- The NZ Treasury also plans to sell NZ$275mn of the 1.50% May-31 bond and NZ$175mn of the 4.25% May-34 bond.
GOLD: Gold Clears $4000 As Global Uncertainties Mount, More Fed Comments Later
Gold has tested psychological round number resistance at $4000 and decisively breached it reaching a record high of $4014.62 driven by political instability in the G7 that may not be resolved imminently. Issues in heavily indebted US, France and Japan are driving safe-haven flows, but ETF and central bank buying are providing structural support and geopolitics, US rate cuts and threats to Fed independence have also driven buying of gold. The US dollar (BBDXY +0.2%) has strengthened again today and yields are little changed, but gold’s rally is immune.
- Bullion is currently up 0.7% to around $4012.0/oz. Given it has rallied 4% so far this month and over 16% since 1 September, the risk of a pause in the uptrend is growing.
- The US shutdown is not just an issue for political stability but it also weighs on growth and government-issued data is being delayed making it difficult to gauge the economic situation ahead of the 29 October Fed decision. The OIS market has almost a full 25bp rate cut priced in for the meeting, despite a lack of data.
- Silver is outperforming gold after Tuesday’s underperformance. It is up 1.2% to $48.40, after a high of $48.46. It will also be benefiting from flight-to-quality flows as well as a tight physical market.
- Later the Fed’s Musalem, Barr, Goolsbee, Kashkari and the ECB’s Lagarde, Elderson, Buch, Tuominen and BoE’s Pill speak. The September FOMC meeting minutes will also be published.
CRYPTO: Ethereum - Rejected Above $4700, Moves Lower With Risk
Ethereum had a range overnight of $4435.40 - $4757.59, Asia is trading around $4485, -0.60%. Ethereum had a strong bounce after triggering stop losses sub $4000 at the end of September. It pushed back through what should have been initial resistance towards $4500 as risk surged higher across the board globally. Overnight we have seen some signs of potential exhaustion after some huge rallies in risk, the pullback in Ethereum reflects this and should this correction have more legs the risks are skewed to the downside. Very strong support lies in the $3800/$4000 area, it looks like it might need to do some work and consolidate within a range for a period as it tries to build for its next leg higher.
- Daily Chartbook on X: "Digital asset investment products attracted [a record] US$5.95bn last week ... Bitcoin saw a record US$3.55bn in inflows, Ethereum US$1.48bn, while Solana (US$706.5m) and XRP (US$219.4m) also set notable records." - @CoinSharesCo.
- David Lee on X: “Citadel CEO Griffin - “People are looking for ways to effectively de-dollarize or de-risk their portfolio vis-a-vis US sovereign risk.”
- Altcoin Vector on X: “This is the moment for $ETH to make its claim. If ETH/BTC keeps recovering and builds upward impulse, capital rotation returns to ETH and Large caps. If BTC dominance stays calm, it opens the door for liquidity to flow outward. This is ETH’s moment to lead the next rotation.”
Fig 1: Ethereum spot Daily Chart
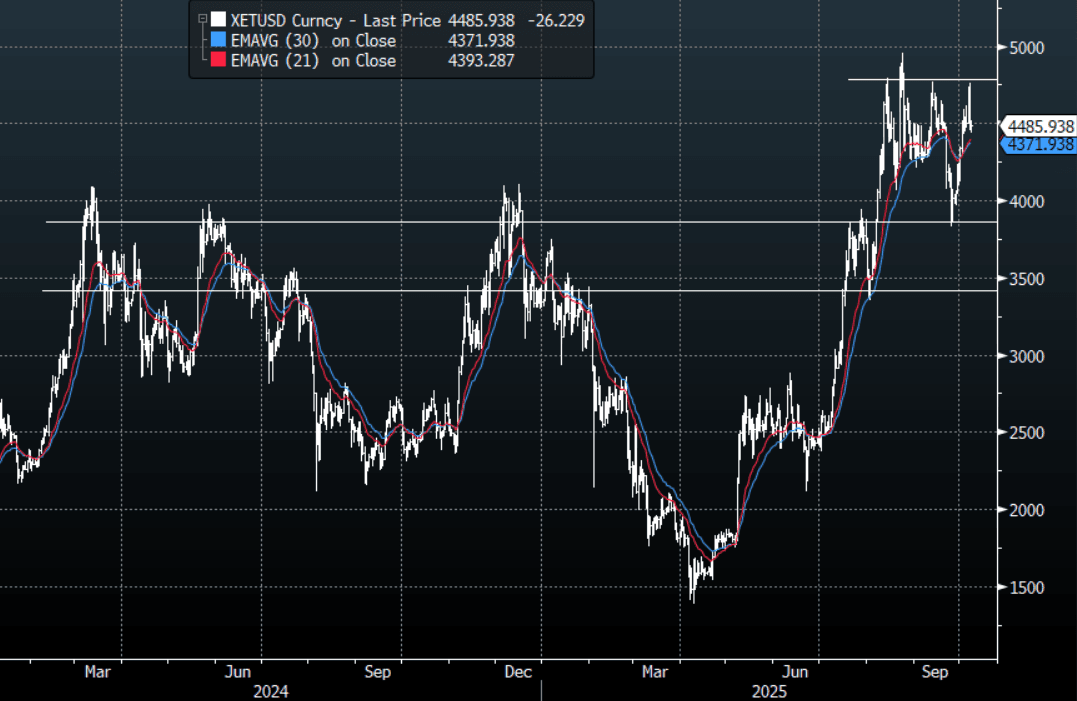
Source: MNI - Market News/Bloomberg Finance L.P