MNI EUROPEAN MARKETS ANALYSIS: USD/JPY To Fresh Highs
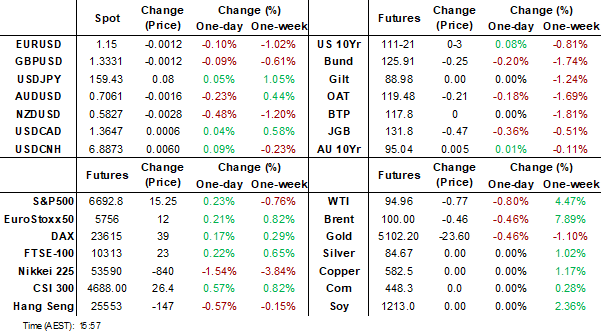
- Oil is steadier today, but there appear to be few signs of an end to the Iran conflict. The USD is firmer and looking to test higher. USD/JPY rose to fresh multi year highs, despite fresh FX jawboning. AUD and NZD are weaker. US Tsy yields are little changed
- Regional equities are mostly in the red, while Asian markets continue to see FX pressure. USD/THB is through its 200-day EMA, but the CNH outperformance theme continues.
- Friday’s calendar is headlined by US PCE and Canadian Employment data.
MARKETS
US TSYS: 10-Yr Yields Eye 4.30% as Data Releases Ignored
A familiar theme played out each day this week for USTs trading in Asia. Modest decline in yields during the morning session - as investors took profit on overnight positions and locked in the rise in yields - followed by a resumption of higher yields in the afternoon.
The momentum for higher yields is strong. The US 10-Yr is higher on the week by +12.2bps - easily trading through 4.20%. Barring a sea change in the Iran war - there appears no barrier to the 10-Yr reaching 4.30% in the short term as the inflationary pressures intensify.
- The 2-Yr is down Friday by -1.1bps at 3.736% (+17.2bps for the week)
- The 5-Yr is down -0.5bps at 3.863% (+13.6bps for the week)
- The 10-Yr is flat at 4.263% (+12.2bps for the week)
- The 30-Yr is up +0.7bps at 4.893% (+13.2bps for the week)
US treasury futures are up modestly Friday with the 10-Yr at 111-16+ for gains of +03+ (-0-29+ for the week)
Looking ahead to Friday: Decent amount of data though investors focus will likely remain on Oil
- Personal Income (0.3%, 0.5%), Spending (0.4%, 0.3%)
- PCE Price Index MoM (0.4%, 0.3%), YoY (2.9%, 2.9%)
- Core PCE Price Index MoM (0.4%, 0.4%), YoY (3.0%, 3.1%)
- Personal Consumption (2.4%, 2.4%)
- Durable Goods Orders (-1.4%, 1.1%)
- Cap Goods Orders Non def Ex Air (0.8%, 0.5%), Ship (1.0%, 0.5%)
- GDP Annualized QoQ (1.4%, 1.4%), GDP Price Index (3.6%, 3.6%)
- U. of Mich. Sentiment (56.6, 54.6)
- U. of Mich. 1 Yr Inflation (3.4%, 3.7%), 5-10 Yr Inflation (3.3%, 3.4%)
- JOLTS Job Openings (6.542M, 6.750M), Quits Level (3.204M, 3.109M)
STIR: $-Bloc Pricing Firmer Again Over Past Week On ME Conflict & Oil Price
Over the past week, interest-rate expectations across the $-bloc through December 2026 have firmed further in response to the Middle East conflict and its impact on oil prices, with moves led by the Canada (+28bps), followed by the US (+19bps), New Zealand (+14bps) and Australia (+11bps). This followed a 9-19bp firming the week before.
- Oil prices remained highly elevated and volatile during the US trading day on Thursday as the market balanced a historic supply disruption against a massive emergency reserve release.
- Brent crude climbed above $100/bbl (peaking near $101) after Iran's new Supreme Leader issued his first public statement vowing to keep the Strait of Hormuz closed. This de facto closure has halted roughly 20 million barrels per day, effectively removing one-fifth of global supply from the market.
- In a direct attempt to cool prices, the International Energy Agency (IEA) announced its largest-ever coordinated release of 400 million barrels from strategic reserves. While this provided a temporary soft ceiling, prices rose anyway, signalling that the market views the reserve release as likely insufficient.
- Prices were further bolstered by reports of Iranian-led attacks on oil terminals and tankers in Iraqi waters. Iraq's production reportedly collapsed by 70% as export routes became unusable, forcing authorities to shutter major terminals overnight for safety.
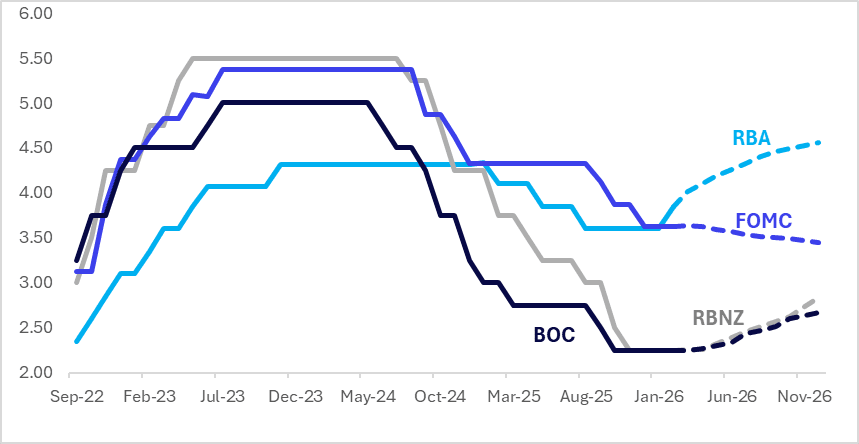
- The next major regional policy events are the RBA meeting on 17 March and the FOMC and BOC meetings on the 18 March. 71% probability of a 25bp tightening by the RBA is priced, while the US and Canadian markets attach a 1% and 4% probability of a 25bp easing.
- Looking ahead to December 2026, current market-implied policy rates expected are as follows: US (FOMC): 3.44%, -18bps; Canada (BOC): 2.67%, +42bps; Australia (RBA): 4.33%, +48bps; and New Zealand (RBNZ): 2.84%, +59bps.
Figure 1: $-Bloc STIR (%)

Source: Bloomberg Finance LP / MNI
JGBS: Bear-Steepener, Oil Remains The Main Focus
JGB futures are sharply weaker and at session lows, -45 compared to settlement levels.
- (Dow Jones) “Japan, including the Bank of Japan, will likely need to be more cautious about the economic consequences of the Middle East conflict, DBS Group Research's Chang Wei Liang says in commentary. The foreign-exchange and credit strategist cites the country's heavy reliance on the Middle East for crude oil imports, with around 70% of its imports transiting through the Strait of Hormuz.”
- MNI Policy: BOJ's Renewed Price Focus Improves Hike Conditions. The BOJ is increasingly vigilant about second-round effects from Yen weakness and crude oil prices, particularly the risk of rising inflation expectations, with conditions for a rate hike gradually falling into place and raising the possibility of a move as early as next week MNI understands.
- "JAPAN FINMIN KATAYAMA: NEED TO MITIGATE IMPACT AS MUCH AS POSSIBLE, READY TO TAKE ALL POSSIBLE MEASURES, KEEPING IN MIND THAT OIL PRICES COULD HAVE ON DAILY LIVES. IN CLOSER CONTACT WITH US AUTHORITIES ON FOREX - [RTRS]"
- Cash US tsys are slight mixed in today's Asia-Pac session after yesterday’s bear-flattener.
- Cash JGBs are 1-5bps cheaper, with a steepening bias, across benchmarks out to the 30-year.
- Swap rates are ~1bp higher
- On Monday, the local calendar will be empty.
JPY: Market May Question Whether Now Is A Good Intervention Window
USD/JPY has shrugged off the earlier FX jawboning comments from Japan FinMin Katayama, and continues to test the authorities resolve. We were last near 159.40, just short of 159.40/45, the mid and late Jan high (before the reported US rate check was conducted). Katayama's comments didn't touch on language used previously that might suggest intervention was imminent. Via BBG: "Key phrases include describing moves as "one-sided," "rapid," or "excessive," stating they do not reflect "fundamentals," and warning they will "take appropriate action" or "not tolerate" speculation" were not present earlier.
- Katayama stating: WILL TAKE ALL POSSIBLE MEASURES ON FOREX AS HIGHER OIL PRICES COULD HAVE IMPACT ON DAILY LIVES - [RTRS]" RTRS, and "JAPAN FINMIN KATAYAMA: IN CLOSER CONTACT WITH US AUTHORITIES ON FOREX - [RTRS]"
- As we noted earlier, the risk/reward around intervention, during the current market risk off/oil price spike, may not give the authorities great bang for their buck.
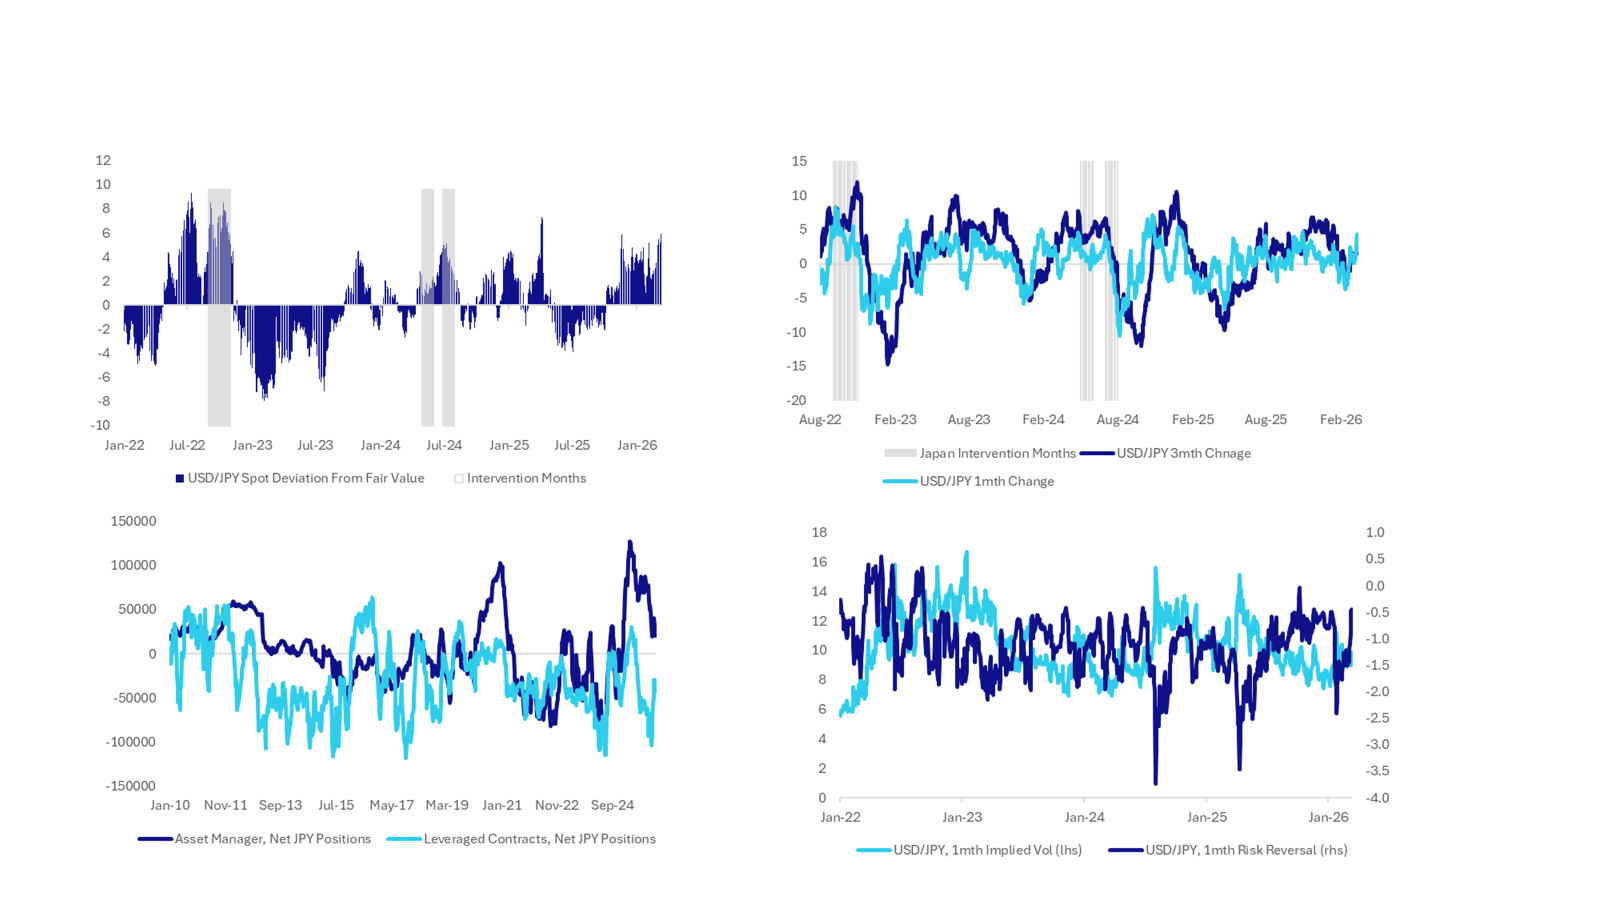
- The slide below presents 4 charts, all of which suggest intervention risks are evident but that has been the case for a while.
- The top left hand corner is the deviation between spot USD/JPY and our simple short term fair value estimate. The fair value estimate is close to 150.50, representing close to a 6% wedge, which is wide, although we have been more stretched in recent years. Essentially, the two inputs into the model have offset each in recent weeks, with weaker global equities negated by higher US-JP yield differentials.
- Rates of change, in USD/JPY, are elevated but more so over a 1 month than 3 month period, see the top right hand panel chart.
- Leveraged positioning is still short but away from extremes, per CFTC data, while asset managers are still long, but have cut back noticeably (see the chart at the bottom left hand panel).
- Risk reversals are closer to recent cycle highs compared to implied 1 month vols (see the bottom right hand panel chart).
Source: Bloomberg Finance L.P./MNI
AUSSIE BONDS: Slightly Stronger As Early Losses Reversed
ACGBs (YM flat & XM +2.5) are slightly stronger, reversing early weakness driven by overnight losses for US tsys.
- (Bloomberg) “Goldman Sachs says the conflict in the Middle East could send the oil price as high as $US150 a barrel amid growing fears that a crucial channel will remain closed for months. The Wall Street investment bank expects oil to peak at around $US150 a barrel should the Strait of Hormuz remain closed for the next two months.”
- Cash US tsys are flat to 1bp richer, with a steepening bias.
- Cash ACGBs are flat to 2bps richer after being 3-5bps cheaper early. The AU-US 10-year yield differential is at +68bps after +71bps early.
- The bills strip is flat to -2 across contracts.
- The local calendar will be empty until next Tuesday's RBA meeting.
- Going into next week's policy decision, RBA-dated OIS pricing implies a 72% probability of a 25bp hike, up from 35% at last Friday's close.
- RBA-dated OIS pricing shows tightening across all meetings, with the probability of a 25bp hike rising to 165% by June and 277% by December 2026.
- Next week, the AOFM plans to sell $1000mn of the 4.25% 21 March 2036 bond on Wednesday.
Bloomberg Finance LP
BONDS: NZGBS: Bear-Flattener To End A Heavy Week
NZGBs closed showing a bear-flattener, with benchmark yields flat to 5bps higher.
- NZGBs relative performance was mixed, with the NZ-US 10-year yield differential 3bps lower but the NZ-AU differential 1bp higher.
- Cash US tsys are flat to 1bp richer, with a steepening bias.
- (Bloomberg) “New Zealand’s economic recovery probably lost momentum in the final months of 2025, highlighting its fragile nature even before any impact from the spiraling Middle East conflict and surging oil prices. Economists at the nation’s four biggest banks have cut their GDP forecast, with all now seeing it growing by less than the Reserve Bank’s 0.5% prediction, citing a stuttering recovery.”
- Swap rates closed flat to 6bps higher, with the 2s10s curve flatter.
- RBNZ-dated OIS pricing closed flat to 4bps firmer across meetings with late 2026 / early 2027 leading. No tightening is priced for April, while December 2026 assigns 59bps.
- Over the past week, interest-rate expectations across the $-bloc through December 2026 have firmed further in response to the Middle East conflict and its impact on oil prices, with moves led by the Canada (+28bps), followed by the US (+19bps), New Zealand (+14bps) and Australia (+11bps).
- On Monday, the local calendar will see the Performance Services Index and Card Spending Retail data.
Bloomberg Finance LP / MNI
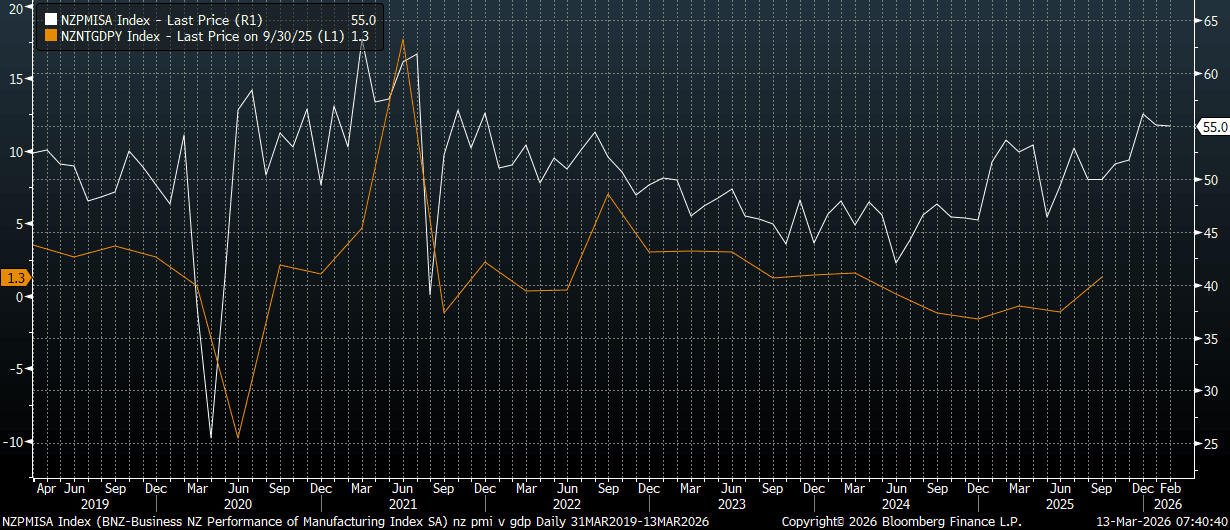
NEW ZEALAND: Feb PMI Elevated But BNZ Notes Note Too Early Assess Iran Impact
The New Zealand Feb BNZ-Business NZ PMI (manufacturing) edged down a touch to 55.0 (from a revised 55.1 in Jan, originally reported as 55.2). The chart below plots the PMI against NZ GDP y/y. The PMI is still pointing to better y/y GDP momentum in to early 2026. Note next Thursday we get Q4 GDP for NZ, with the market consensus at 0.5%q/q (1.1% was the Q3 rise), while the y/y is projected at 1.7% (versus 1.3% prior). BNZ via BBG notes: "Subcomponents provide further evidence that the manufacturing sector started 2026 well. The new orders and production indexes are meaningfully above their long run-averages: BNZ" but adds: “Recent economic data have taken a backseat relative to the conflict in Middle East. “It is too early for the PMI to capture any of these impacts”
- The employment index eased to 50.4 from 52.6, while deliveries also eased, but new orders to 57.6 (from 56.6) were firmer,
Fig 1: New Zealand Manufacturing PMI Versus GDP Y/Y
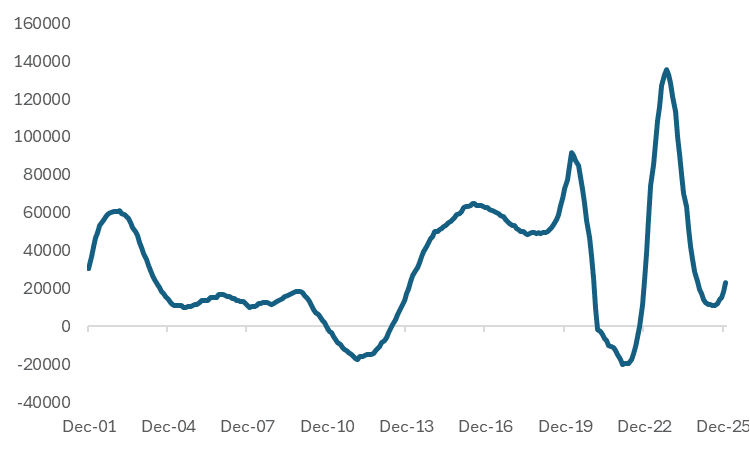
NEW ZEALAND: Further Improvement In Net Migration, But Rolling Annual Sum Modest
Jan net migration continued to improve, rising to 4460, from a revised 3600 gain in Jan. The Feb outcome was the highest since end 2023 in terms of net monthly migration. The start of 2025 was delivering close to flat net monthly migration. The rolling annual sum of net migration sits back at just over 23k. This takes us back to end 2024 levels for this metric. The chart below shows the trend improvement is coming from a low base though. Further improvement will support the broader economic recovery, all else equal.
Fig 1: New Zealand Net Migration - Rolling 12mth Sum
Source: Stats NZ/MNI
FOREX: USD - BBDXY Looking To Challenge 1213-1215 Resistance
The BBDXY has had a range today of 1207.45 - 1209.93 in the Asia-Pac session; it is currently trading around 1210, +0.12%. The BBDXY had another leg up as risk-aversion begins to expand, though it remains in its recent range. The stock market is beginning to take off its rose tinted glasses and the gravity of the situation is beginning to take its toll. I am not very optimistic going forward and the longer this conflict plays out the more the headwinds for risk will grow. On the day, I suspect dips back toward 1203.50-1205.50 will now be supported as the market looks to test the top-end of the range toward 1213-1215. A sustained break above 1215 is needed to signal a potential deeper pullback toward the pivotal 1230-1235 area.
- EUR/USD - Asian range 1.1500-1.1530, Asia is currently trading 1.1501. The pair traded heavy again all through the overnight session as the USD grinds higher. The Pair is again looking to test the pivotal 1.1400-1.1500 area as the pressure on the Euro longs builds. Going forward unless we get a quick cessation in Iran and the Straits open up again, the pressure looks likely to persist. On the day, the first sell-zone is back toward 1.1550-1.1580 and then the 1.1650-1.1700 area, looking for another test of the pivotal 1.1400-1.1500 support. A sustained break back through 1.1400 could potentially signal a much deeper retracement.
- GBP/USD - Asian range 1.3330-1.3370, Asia is currently dealing around 1.3331. The GBP trades heavily as risk-aversion grows. On the day, look for resistance toward 1.3390-1.3420 and then the more important 1.3500 area as the USD grinds higher. Sellers will be looking for the 1.3300 area to give way at some point to confirm a top is in place, this could signal the start of a deeper move, the first target toward 1.3000.
- Data/Events: France February CPI, Italy January Industrial Production, ECB’s Wunsch Speaks, Eurozone January Industrial Production, US 4Q GDP, US 4Q Personal Consumption, US 4Q PCE
Fig 1: GBP/USD Spot Weekly Chart
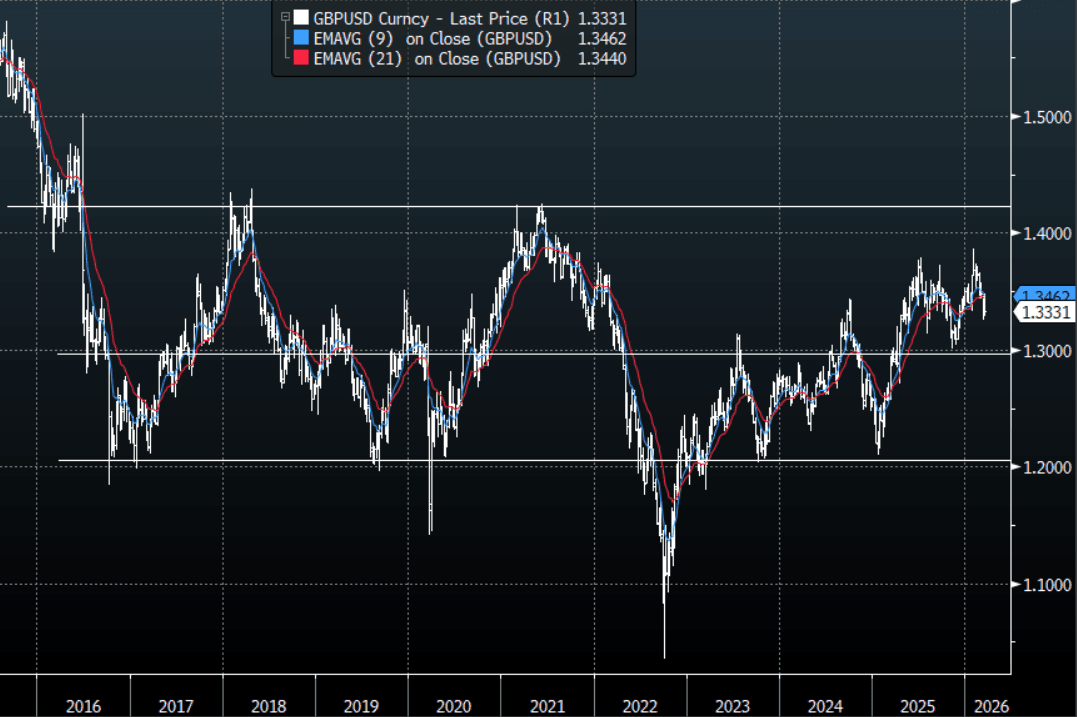
Source: MNI - Market News/Bloomberg Finance L.P
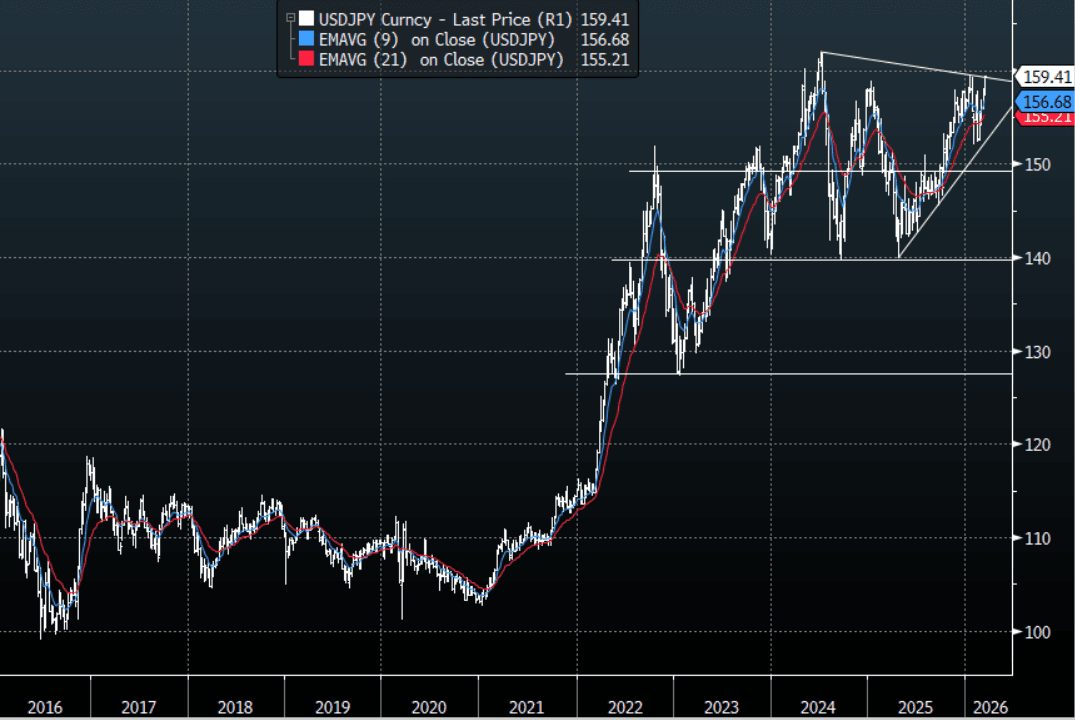
JPY: USD/JPY-Looks To Challenge 160-162, Potentially Bringing Rate Hike Forward
The USD/JPY range today has been 159.01-159.43 in the Asia-Pac session, it is currently trading around 159.40. The pair had a brief dip as officials Jaw-Boning got louder but dips continue to be well supported and is now looking to challenge the all important 160-162 area. The jaw-boning by officials is probably set to intensify but personally with the USD so bid and risk struggling I think the BOJ/MOF are in a tough place, who wants to sell USD’s into a market that is looking for them. Hiroshi Inoue’s article below raises the possibility of a rate hike next week as an alternative. This is similar to the conundrum the SNB had intervening in EUR/CHF by offering an unlimited bid in EUR when the whole world was selling. So for now, I suspect they hold off until this market has calmed down and the demand for USD’s has turned lower again. Where does this leave USD/JPY and how high can it go before they are forced to come back in ? This is a tough question because you cannot discount them coming in back above 162 but for my mind I suspect it could be a lot higher than most expect given the current back drop, but it does increase the chances of them moving on rates. On the day, the first support is back toward 158.50-158.80 and then the 157.50 area.
- MNI Policy: BOJ’s Renewed Price Focus Improves Hike Conditions. The BOJ is increasingly vigilant about second-round effects from Yen weakness and crude oil prices, particularly the risk of rising inflation expectations, with conditions for a rate hike gradually falling into place and raising the possibility of a move as early as next week MNI understands.
- "JAPAN FINMIN KATAYAMA: NEED TO MITIGATE IMPACT AS MUCH AS POSSIBLE, READY TO TAKE ALL POSSIBLE MEASURES, KEEPING IN MIND THAT OIL PRICES COULD HAVE ON DAILY LIVES. IN CLOSER CONTACT WITH US AUTHORITIES ON FOREX - [RTRS]"
- Options : Close significant option expiries for NY cut, based on DTCC data: 156.00($1.01b). Upcoming Close Strikes : 156.00($1.29b March 16) - BBG.
- The USD/JPY Average True Range(ATR) for the last 10 Trading days: 88 Points
Fig 1 : USD/JPY Spot Weekly Chart
Source: MNI - Market News/Bloomberg Finance L.P
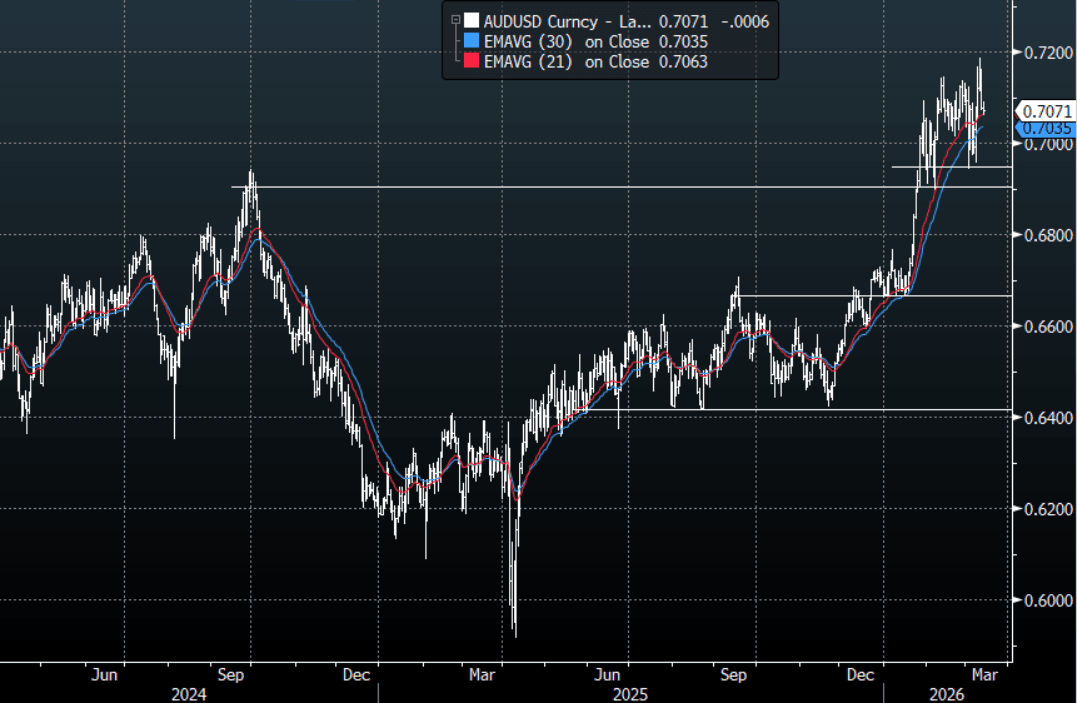
AUD/USD - Pulls Back Below 0.7100 As Risk Aversion Grows
The AUD/USD has had a range today of 0.7061-0.7092 in the Asia- Pac session, it is currently trading around 0.7070, -0.10%. The AUD could not hold above the 0.7100 area as it stalled toward 0.7150 and when US stocks got hit overnight the pair could no longer shrug off the backdrop for risk and quickly fell lower. The AUD is being caught between those wanting to be long as rate hikes are brought forward and those looking for a proxy for risk. Ultimately the price remains within this 0.6900-0.7200 range as the conflict continues for now and while above the pivotal 0.6900-0.6950 area the bulls hold the slight edge, but the market is already long so will be hoping for risk to stablise. On the day, this price action is tough to trade with conviction but I suspect with risk back under pressure and the inability to hold above 0.7100 will probably see any bounce back toward 0.7110-0.7140 faded initially.
- MNI AU - 25bp Hike By RBA Next Tues At ~70% Chance: Going into next week's RBA policy decision, RBA-dated OIS pricing implies a 71% probability of a 25bp hike, up from 35% at last Friday's close. The market is now as confident about a hike as it was ahead of February's 25bps hike to 3.85%
- “Institutional investors are buying US dollars at the fastest pace in nearly two years, as the Middle East conflict fuels a rush into safe havens, State Street said.” - BBG
- Options : Closest significant option expiries for NY cut, based on DTCC data: 0.7000(AUD853m), 0.7100(AUD896m), 0.7130(AUD839m). Upcoming Close Strikes : 0.6950(AUD1.07b Mar 18 ), 0.7100(AUD1.41b Mar 16), 0.7100(AUD752m Mar 18) - BBG
- The AUD/USD Average True Range for the last 10 Trading days: 93 Points
Fig 1: AUD/USD spot Daily Chart
Source: MNI - Market News/Bloomberg Finance L.P
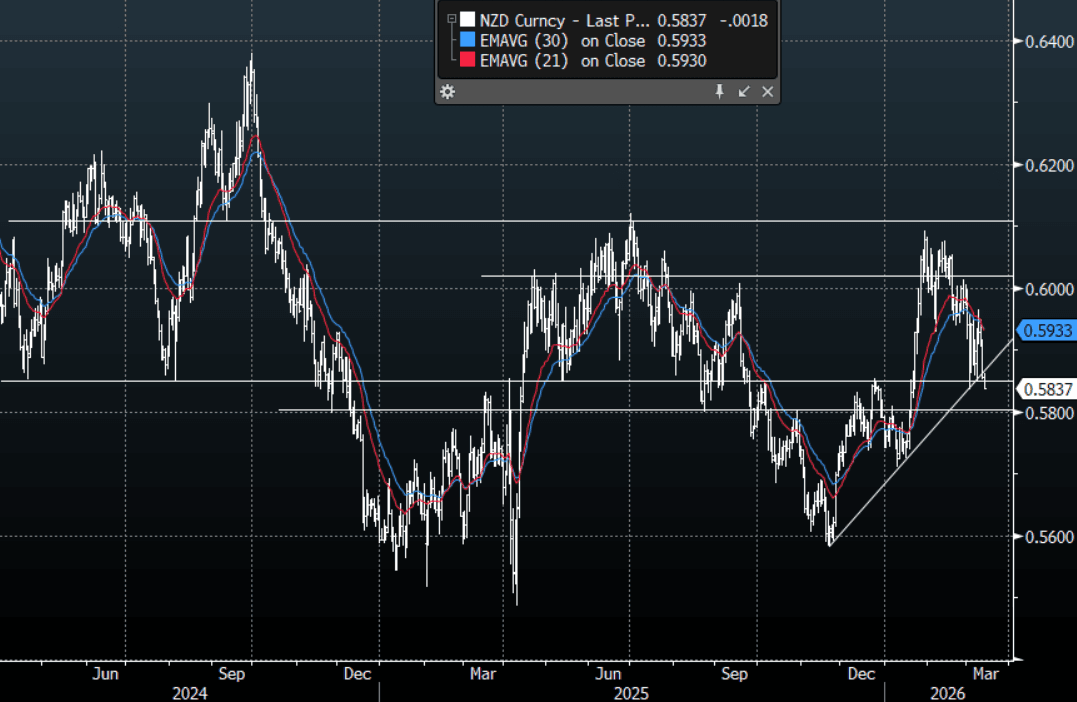
NZD/USD - Looking To Challenge Pivotal 0.5800-0.5850 Support
The NZD/USD had a range today of 0.5836-0.5862 in the Asia-Pac session, it is currently trading around 0.5836, -0.30%. Risk aversion seems to be building now and the NZD fell away very quickly in the New York session when US stocks turned lower. The USD is bouncing in this scenario and the NZD is now pressing the lows of its recent messy 0.5840-0.6020 range. The NZD has traded with a heavy bias consistently throughout this conflict and a sustained break below 0.5800-0.5850 could potentially see the move begin to accelerate. On the day, I suspect sellers could return back toward the 0.5890-0.5920 area and then toward 0.6000, looking for the pair to challenge lower at some point.
- MNI AU - Feb PMI Elevated But BNZ Notes Note Too Early Assess Iran Impact: The New Zealand Feb BNZ-Business NZ PMI (manufacturing) edged down a touch to 55.0 (from a revised 55.1 in Jan, originally reported as 55.2). The PMI is still pointing to better y/y GDP momentum in to early 2026. BNZ via BBG notes: "Subcomponents provide further evidence that the manufacturing sector started 2026 well. The new orders and production indexes are meaningfully above their long run-averages: BNZ" but adds: "Recent economic data have taken a backseat relative to the conflict in Middle East. "It is too early for the PMI to capture any of these impacts."
- Bloomberg - “Traders are now predicting a Fed rate cut in mid-2027, with Goldman pushing back its reduction call to September from June.”
- Options : Closest significant option expiries for NY cut, based on DTCC data: 0.5790(NZD310m). Upcoming Close Strikes : none - BBG
- The NZD/USD Average True Range for the last 10 Trading days: 64 Points
Fig 1: NZD/USD Spot Daily Chart
Source: MNI - Market News/Bloomberg Finance L.P
ASIA STOCKS: AI Tech vs $100 Oil Key to Asia's Next Move for Stocks
The escalation of the US-Iran conflict and the blockade of the Strait of Hormuz triggered a violent risk-off rotation, with oil-dependent economies like Japan and India bearing the brunt of the selling in equities.
The Nikkei 225 suffered its third-largest point drop in history on Monday -2,800 points as investors dumped Automakers and Tech as the weak Yen + high oil combination threatened to crush corporate margins. Defense stocks and financial institutions with trading Houses were the only positive areas. This sees the NKY back below 54,000 and down over 8% month to date.
India’s VIX spiked over 20% this week as the Nifty 50 broke below its 200-day moving average. Auto and FMCG sectors were hammered on fears that $100 oil would lead to immediate fuel price hikes, denting rural and urban discretionary spending. A spike in bond yields put pressure on banks given expected mark-to-market losses on their government bond holdings.
Chinese markets were the most resilient this week, partly because China is less reliant on oil imports for its energy, making it less physically sensitive to the Hormuz blockade than Japan or Korea. Beijing officially set a 2026 GDP growth target of 4.5%–5.0%, whilst the government signaled a reluctance to deploy large-scale stimulus, maintaining a budget deficit target around 3%–4% of GDP. Key bourses are mixed this week though both gains and losses were modest, outperforming their regional peers.
Korea's KOSPI is down, though losses capped due to their flagship AI names. The KOSPI is down around -1.8% for the week with SK Hynix flat and Samsung down just -0.7%
Oil in Standoff Between Reserve Release and Hormuz Closure
- This week may go down as one of the most volatile periods in energy history, with prices undergoing a parabolic spike followed by a partial retreat as the world’s emergency response mechanisms were triggered.
- The week began with a historic shock as Brent crude surged toward $120/bbl on Monday. This followed reports that nearly 20 million bpd of supply—one-fifth of the global total—was effectively stranded due to the closure of the Strait of Hormuz amidst the escalating US-Iran conflict.
- In a desperate bid to prevent a global recession, the International Energy Agency (IEA) announced a record-breaking release of 400 million barrels from strategic reserves on Wednesday. This intervention helped pull prices back from their $120 peak to stabilize near the $92–$100 range, though markets quickly assessed this as not enough.
- By mid-week, the narrative shifted to production loss as storage tanks in the Persian Gulf reached maximum capacity due to the shipping blockade. This saw producers in Saudi Arabia, Kuwait, and the UAE forced to cut output by an estimated 8 to 10 mb/d.
- The IEA and OPEC both issued rare downward revisions to demand forecasts this week. High prices and widespread flight cancellations in the Middle East are expected to wipe out 1 mb/d of global demand in March and April, creating a stagflationary drag on the global economy.
- Brent has traded in a range of US$81.16 - $119.50 and is currently near US$100.24 bbl - a rise of +8.1% for the week.
- WTI has traded in a range of US$76.73 - $119.48 and is currently near $95.32 - a rise of +4.8% for the week.
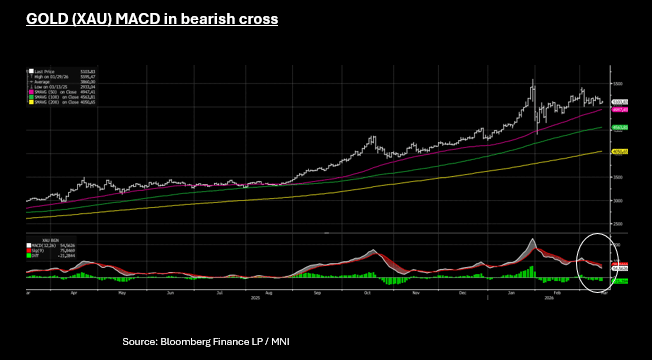
GOLD: Gold Gains Capped by USD, Tight Ranges to Remain
- Whilst gold has eked out modest gains Friday in Asia, it is currently lower for the week as USD strength and the path of US interest rates weighs heavy on the precious metal.
- Gold has traded in a range this week of $5,015 -$5,238 and is currently near to $5,104.
- Short term momentum indicators like the MACD suggest downward pressure on gold could continue. The MACD (white) line sits below the Signal (red) line in a bearish cross as gold investors remain wary of a stronger USD, as the hope of interest rate cuts evaporate.
- Many forecasters are suggesting that gold's has a natural floor under it of around $5,000 on geopolitical uncertainty and ongoing purchases by Central Banks. Reports this week showed Chile made its first major gold purchase in decades, joining giants like China and India.
- These factors should see gold continue to trade in tight ranges into next week.
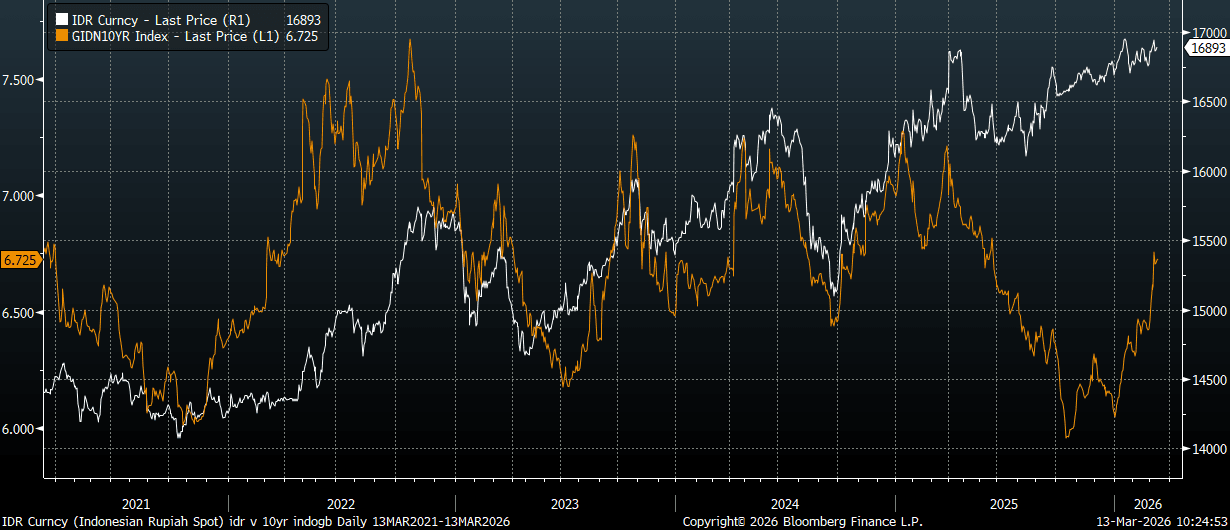
INDONESIA: 10-Yr Yields Risk 7.00% Test; BI Faces 17,000 IDR
- The current surge in oil prices has similarities to the fiscal challenge Indonesia faced during the 2022 Russia-Ukraine conflict. During that period local 10yr government yields surged beyond 7.50%, while USD/IDR spent most of the year tracking higher as well (see the chart below). 10yr yields were last around 6.725%, while USD/IDR was close to 16900, largely kept in check by continued BI intervention.
- In 2022, Indonesia's energy subsidies tripled to over Rp 500 trillion to keep fuel prices stable. Today, every $1/bbl increase in local price of oil adds an estimated Rp 6.8 trillion ($400 million) to the deficit. Whilst higher palm oil / coal prices provide an offset the cost of fuel compensation consistently outpaces these gains.
- Indonesia has a strict legal limit on fiscal deficits at 3% of GDP. Forecasts suggest that if oil averages $92/bbl, the deficit could hit 3.6%. Note as well, the starting point for the fiscal position was arguably better in 2022 compared to today: -2.4% as a share of GDP for 2022, as the balance improved post the Covid shock, while 2025's deficit was -2.6%.
- To avoid a repeat of the 2022 legal suspension of this cap, the government is likely to scale back ambitious new projects, whilst trying to stave off being forced to raise subsidized fuel prices to protect the budget.
- 10-Yr yields are correlated to fiscal discipline, rising recently on fiscal fears. Yields are likely to face upward pressure toward 7.00% on widening deficits and weakening Rupiah concerns.
- This leaves the BI in a difficult spot, whilst trying to defend a weak currency and in 2022, BI was forced into aggressive rate hikes.
- The Subianto government seems to have little appetite for higher rates which will likely see the BI try to hold the BI rate steady for now to try and anchor bond yields and the currency.
- The risks are now are for either rate hikes to be forced upon the BI, or risk a steeper curve.
Fig 1: Indonesia 10yr Yield & USD/IDR
Source: Bloomberg Finance L.P./MNI
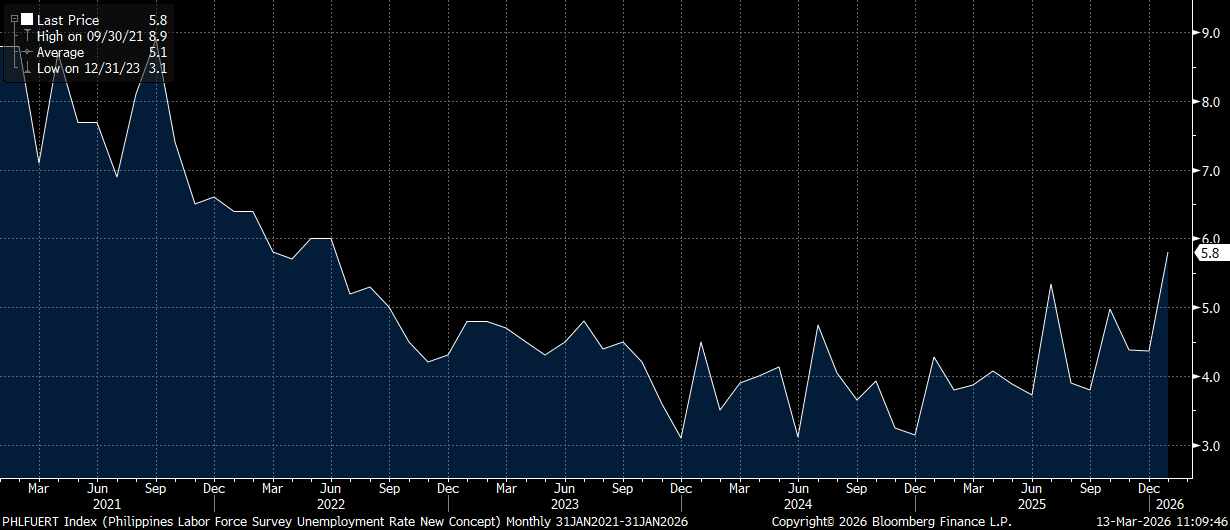
PHILIPPINES: Unemployment Rate Rises To 5.8%, Fresh Highs Back To mid 2022
The Philippines unemployment rate has risen to 5.8% for January (from 4.4% in Dec), fresh highs back to mid 2022, see the chart below. The rate does tend to rise at the start of the year versus Dec levels. Still, it does point to a more challenging economic backdrop for the Philippines, as growth slowed sharply through the second half of last year amid the corruption scandal. The underemployment rate surged to 13.2% from 8.0%. The BSP may be a little stuck to provide further strong policy support given the surge in oil prices and higher USD/PHP levels.
Fig 1: Philippines Unemployment Rate Back To Mid 2022 Levels
Source: Bloomberg Finance L.P./MNI
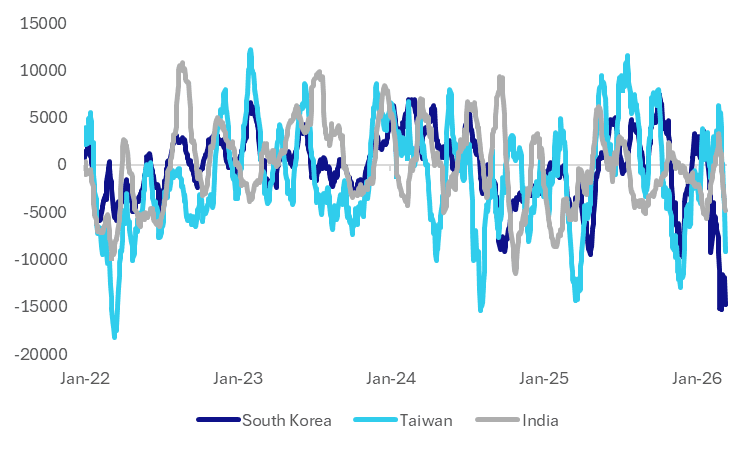
ASIA STOCKS: Net Outflows Strong Last Week, Rolling Monthly Outflows Large
It has been a fairly consistent theme of net selling by offshore investors over the past week, albeit with a few days of net inflows into South Korea and Indonesia. Cumulative outflows stand at -$16bn as markets grapple with the oil price shock from the Iran conflict. As we noted earlier in the week, outside of South Korea, markets in the region aren't at previous cycle lows in terms outflow pressures on a rolling 1 month sum basis. We are getting close though, see the updated chart for South Korea, Taiwan and India below. Taiwan net outflows for the past trading month are nearing -$10bn, India is close to -$5bn.
- Sentiment may remain cautious though, with little signs, on the surface at least, of de-escalation in terms of the Iran conflict.
- In South East Asia, we have seen some stability in Indonesian outflow pressures, but it is mostly outflow momentum elsewhere.
- Thailand net inflows for 2026 to date continue to be pared back, now just over +$1bn (the peak was just under $1.9bn).
Table 1: Asian Markets Net Equity Flows
| Yesterday | Past 5 Trading Days | 2026 To Date | |
| South Korea (USDmn) | -2061 | -5942 | -20826 |
| Taiwan (USDmn) | -2423 | -6157 | -4230 |
| India (USDmn)* | -643 | -3020 | -5906 |
| Indonesia (USDmn) | 59 | -102 | -523 |
| Thailand (USDmn) | -75 | -687 | 1057 |
| Malaysia (USDmn) | -35 | -55 | 338 |
| Philippines (USDmn) | -8 | -50 | 307 |
| Total (USDmn) | -5186 | -16013 | -29784 |
| * Data Up To Mar 11 |
Source: Bloomberg Finance L.P./MNI
Fig 1: South Korea, Taiwan & India Net Equity Flows, Rolling 1month Sum (USD Mn)
Source: Bloomberg Finance L.P./MNI
ASIA FX: USD/Asia Pairs Firmer, CNH Outperforms, USD/THB Above 200-day EMA
USD/Asia pairs are biased higher, again to varying degrees. South East Asia currencies have faltered more, although this is mainly reflective of the sharp rise in USD/THB, as it has played catch up from yesterday's onshore close. Still, THB has fallen the most within the region since the onset of the Iran conflict (down 3.5%), amid the negative terms of trade shock and likely some comfort around weaker local FX levels compared to elsewhere in the region.
- USD/CNH has firmed, but is well under recent highs in the 6.9300/6.9400 region. We were last around 6.8865, with support around 6.8600 holding recently. The USD/CNY fixing edged up but is still consistent with yuan outperformance. The CNY CFETS basket tracker rose to 100.11, fresh highs since the early parts of 2025. Focus in coming days will be on US-China talks taking place in France.
- Spot USD/KRW has been relatively steady, with moves above 1490 proving to be short lived, although pull backs have also been quite modest. Close to 1500 is likely to see an increased intervention threat though. USD/TWD continues to drift higher, last near 31.92, with the pair continuing to close the gap with the 32.00 level.
- USD/THB is at fresh highs above 32.20, which is above the 200-day EMA (and also the simple 200-day MA). Upside focus is likely to rest with the 32.50 region, with little signs of official pushback yet.
- USD/IDR is above 16930, with sights still on the 17000 level. A repeat of the 2022 energy price spike episode points to bearish risks for both IDR and local government bonds.
UP TODAY (TIMES GMT/LOCAL)
| Date | GMT/Local | Impact | Country | Event |
| 13/03/2026 | 0700/0700 | ** | UK Trade Balance | |
| 13/03/2026 | 0700/0700 | *** | UK Short-Term Activity Indicators | |
| 13/03/2026 | 0700/0800 | ** | Unemployment | |
| 13/03/2026 | 0700/0700 | *** | UK Short-Term Activity Indicators | |
| 13/03/2026 | 0700/0700 | *** | UK Short-Term Activity Indicators | |
| 13/03/2026 | 0700/0700 | *** | UK Short-Term Activity Indicators | |
| 13/03/2026 | 0700/0800 | * | Wholesale Prices | |
| 13/03/2026 | 0745/0845 | *** | HICP (f) | |
| 13/03/2026 | 0800/0900 | *** | HICP (f) | |
| 13/03/2026 | 0900/1000 | * | Industrial Production | |
| 13/03/2026 | 0930/0930 | BOE/Ipsos Inflation Attitudes Survey | ||
| 13/03/2026 | 1000/1100 | ** | EZ Industrial Production | |
| 13/03/2026 | - | *** | New Loans | |
| 13/03/2026 | - | *** | Money Supply | |
| 13/03/2026 | - | *** | Social Financing | |
| 13/03/2026 | 1230/0830 | *** | Labour Force Survey | |
| 13/03/2026 | 1230/0830 | ** | Monthly Survey of Manufacturing | |
| 13/03/2026 | 1230/0830 | *** | Labour Force Survey | |
| 13/03/2026 | 1230/0830 | * | Intl Investment Position | |
| 13/03/2026 | 1230/0830 | *** | GDP / PCE Quarterly | |
| 13/03/2026 | 1230/0830 | *** | GDP / PCE Quarterly | |
| 13/03/2026 | 1230/0830 | *** | Personal Income and Consumption | |
| 13/03/2026 | 1230/0830 | ** | Durable Goods New Orders | |
| 13/03/2026 | 1230/0830 | ** | Durable Goods New Orders | |
| 13/03/2026 | 1400/1000 | *** | JOLTS | |
| 13/03/2026 | 1400/1000 | *** | UMich Surveys of Consumers | |
| 13/03/2026 | 1400/1000 | *** | JOLTS | |
| 13/03/2026 | 1400/1000 | *** | UMich Surveys of Consumers | |
| 13/03/2026 | 1700/1300 | ** | Baker Hughes Rig Count Overview - Weekly | |
| 13/03/2026 | 1700/1300 | ** | Baker Hughes Rig Count Overview - Weekly | |
| 13/03/2026 | 1700/1300 | ** | Baker Hughes Rig Count Overview - Weekly |