JPY: Market May Question Whether Now Is A Good Intervention Window
USD/JPY has shrugged off the earlier FX jawboning comments from Japan FinMin Katayama, and continues to test the authorities resolve. We were last near 159.40, just short of 159.40/45, the mid and late Jan high (before the reported US rate check was conducted). Katayama's comments didn't touch on language used previously that might suggest intervention was imminent. Via BBG: "Key phrases include describing moves as "one-sided," "rapid," or "excessive," stating they do not reflect "fundamentals," and warning they will "take appropriate action" or "not tolerate" speculation" were not present earlier.
- Katayama stating: WILL TAKE ALL POSSIBLE MEASURES ON FOREX AS HIGHER OIL PRICES COULD HAVE IMPACT ON DAILY LIVES - [RTRS]" RTRS, and "JAPAN FINMIN KATAYAMA: IN CLOSER CONTACT WITH US AUTHORITIES ON FOREX - [RTRS]"
- As we noted earlier, the risk/reward around intervention, during the current market risk off/oil price spike, may not give the authorities great bang for their buck.
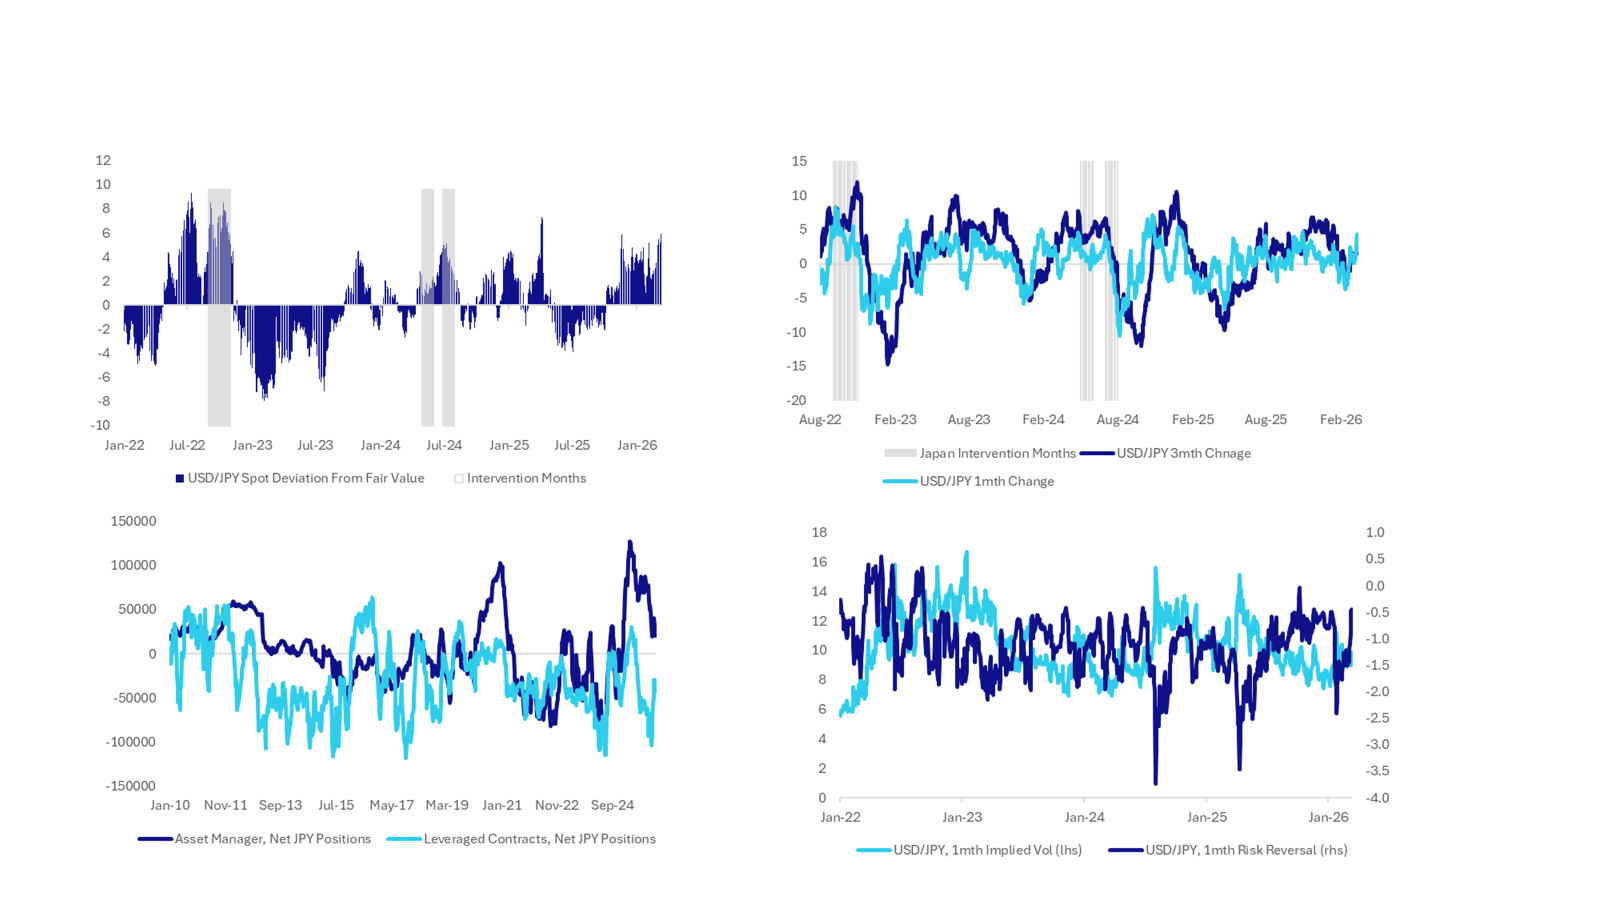
- The slide below presents 4 charts, all of which suggest intervention risks are evident but that has been the case for a while.
- The top left hand corner is the deviation between spot USD/JPY and our simple short term fair value estimate. The fair value estimate is close to 150.50, representing close to a 6% wedge, which is wide, although we have been more stretched in recent years. Essentially, the two inputs into the model have offset each in recent weeks, with weaker global equities negated by higher US-JP yield differentials.
- Rates of change, in USD/JPY, are elevated but more so over a 1 month than 3 month period, see the top right hand panel chart.
- Leveraged positioning is still short but away from extremes, per CFTC data, while asset managers are still long, but have cut back noticeably (see the chart at the bottom left hand panel).
- Risk reversals are closer to recent cycle highs compared to implied 1 month vols (see the bottom right hand panel chart).
Source: Bloomberg Finance L.P./MNI
Want to read more?
Find more articles and bullets on these widgets:
Historical bullets
OPTIONS: +$3bn In USD/JPY Options So Far Today, O/N Vol Elevated Ahead Of NFP
In the FX option space, JPY volumes have dominated so far in Wednesday trade, with around $3.1bn in total volumes so far. This is 46.6% of total volumes, per DTCC via BBG and comes despite onshore markets in Japan being out today. Next on the volumes list is USD/TWD with 10.8% of total volumes. AUD/USD, which has broken above 0.7100 for the first time since 2023 just under $600mn in FX options volumes so far today (around 9.5% of total).
- For USD/JPY, the larger volume transactions ($100mn or more), are mostly for puts, with a variety of strike levels. A 143 strike, expiry end April this year was executed for +200mn per DTCC. This comes as USD/JPY continues to unwinds its pre-election bounce, amid signs that government wants to earn the markets trust around fiscal policy etc. Softer US yields are also weighing on USD/JPY.
- USD/JPY risk reversals are rolling back over, but are above late Jan lows. The 1 month is around -1.64.
- In the vol space, overnight vol is elevated near 16.45%, which reflects the upcoming US payrolls print later. Other implied vol measures are sub 10%.
CHINA: CPI Misses With LNY Distortions
- CPI YoY in January rose just 0.2%, missing the consensus forecast of 0.4% and down from 0.8% in December. The MoM edged up 0.2%, matching the December pace but falling short of the 0.3% forecasts. Core CPI slowed to 0.8% YoY, down from 1.2% driven by base effects and food prices.
- PPI remained negative, reflecting continued pressure on industrial profitability. Down 1.4% YoY, it was an improvement over December's 1.9% decline. However this is the 40th consecutive month of declines, reflecting weak domestic demand and overcapacity in manufacturing.
- Calls for monetary policy intervention remain with the PBOC pledging in its latest quarterly report to employ “flexible and efficient” cuts to interest rates and RRR to maintain an accommodative financial environment emphasizing a deepening coordination with fiscal policy to lower financing costs and boost domestic demand, according to Shanghai Securities News. Undoubtedly expectations will grow ahead of the National People's Congress in March.
- China bond futures are up modestly, the 10-Yr up +.06 at 108.53 and the 2-Yr flat at 102.47. The 2-Yr NDIRS has broken below major moving averages and could test the December lows.
- CGB 10-Yr is modestly lower in yield at 1.80% following liquidity injections this morning during the OMO.
- Look for further liquidity support ahead of the LNY and the 10-Yr to test below 1.80% .
CNY 2-Yr NDIRS vs 20, 50, 100 and 200-day EMA
source: Bloomberg Finance LP / MNI
EUR: EUR/USD - Consolidating Gains Above 1.1900 Heading Into US Employment
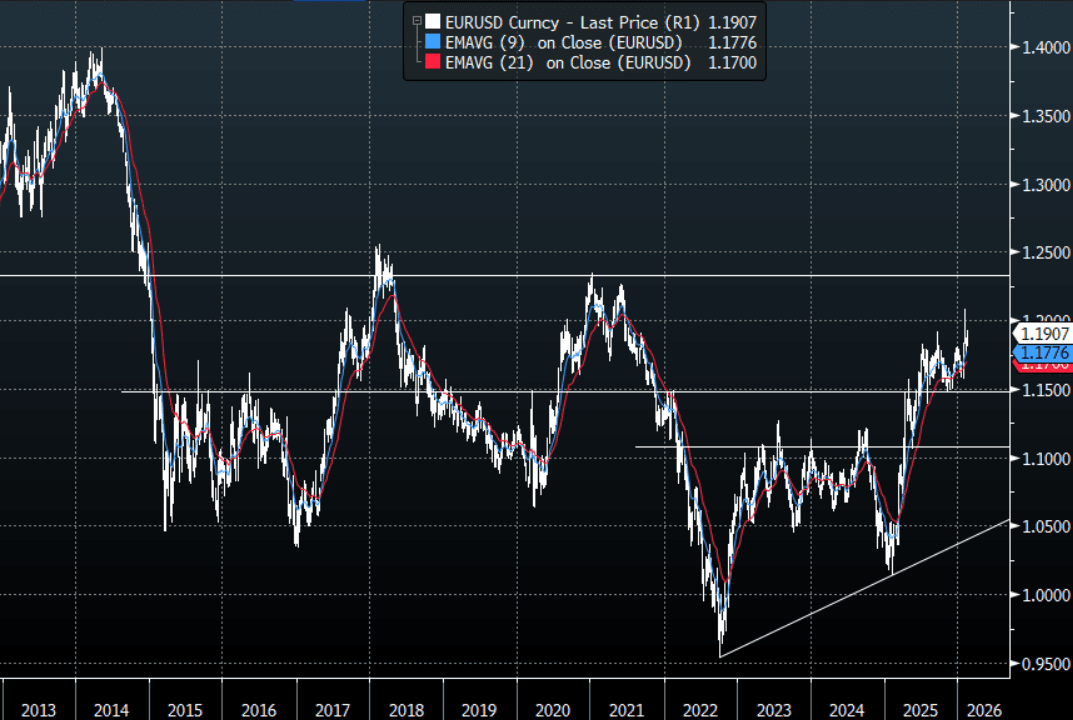
The EUR/USD range overnight was 1.1887 - 1.1929, Asia is currently trading around 1.1905. The pair is consolidating around 1.1900 as the USD comes back under pressure and we await US employment data tonight. Price action has been pretty constructive after the initial sell-off and the support just below 1.1800 proved to be solid, can it now build some momentum from that base ? On the day, the first support is back toward the 1.1860-1.1890 area and then 1.1770-1.1800.
- MNI BRIEF: ECB Villeroy: Downside Risks A Little Stronger. In an interview with Les Echos published Tuesday, Villeroy said that ECB monetary policy was in a "good place" but that did not mean the current policy stance was either comfortable or fixed, noting that "risks to the downside for price developments nevertheless seem to me to be a little stronger than the risks to the upside".
- Options : Closest significant option expiries for NY cut, based on DTCC data: 1.1825(EU1.22b), 1.2000(EU2.17b). Upcoming Close Strikes : 1.1800(EU2.68b Feb 13), 1.1850(EU3.89b Feb 13), 1.1950(EU2.36b Feb 13) - BBG
- The EUR/USD Average True Range for the last 10 Trading days: 67 Points
Fig 1 : EUR/USD Spot Weekly Chart
Source: MNI - Market News/Bloomberg Finance L.P