MNI EUROPEAN MARKETS ANALYSIS: USD/JPY Nears 155
- The USD has recovered its post ADP losses. Focus remains on USD/JPY, which has pushed through 154.50. We did see fresh FX jawboning from the FinMin, but dips in USD/JPY have been shallow. US yields have re-opened weaker.
- In Australia, there was a strong rise in the number of new dwelling loans and their value in Q3 as house price inflation rose. The recovery in home lending began in Q2 after the RBA began easing in February and the 75bp to August appears to have contributed to the sharp rise.
- Later the Fed’s Barr, Williams, Paulson, Waller, Bostic, Miran and Collins speak as well as the ECB’s Schnabel and de Guindos. The Eurogroup meeting is taking place. There are no data of note.
MARKETS
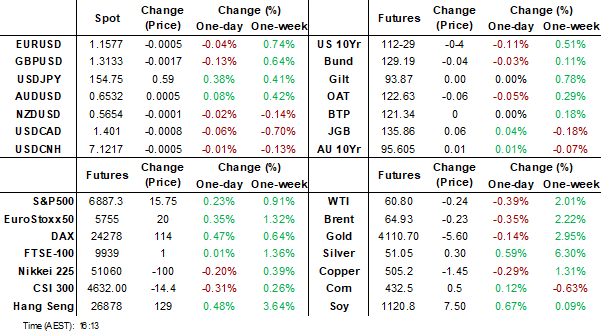
US TSYS: TYZ5 Nears Key Tech Level, Cash Yields Lower Across Curve
US treasury futures were mostly lower along with bond yields in a disjointed, post holiday market. The 10-Yr bond future TYZ5 is down -03 at 112-30, in touch with the 20-day EMA. A break lower could bring the 50-day EMA of 112-26+ into focus.
Cash's morning rally moderated somewhat in the afternoon, but remains a very strong day with bond yields lower across the curve.
- The 2-Yr is at 3.56% (-3.3bps)
- The 5-Yr is at 3.673% (-4.2bps)
- The 10-yr is at 4.083% (-3.5bps)
- The 30-Yr is at 4.683% (-2.3bps)
FED speakers dominate tonight with Williams, Paulson, Waller, Bostic, Miran and Collins all speaking throughout Wednesday, whilst economic data remains on hold.
Investors will focus on the US$42bn 10-Yr issuance as the next guide for market demand, with markets remaining fixated on the US shutdown outcome.
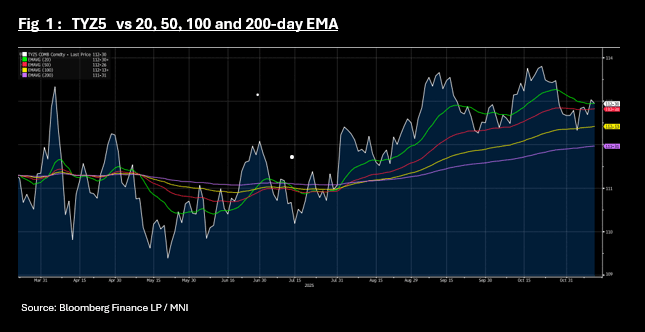
JGBS: 5Y Richer Ahead Of Tomorrow's Supply, Long-End Cheaper
JGB futures are stronger and at session highs, +14 compared to settlement levels, on a data-light day.
- Cash US tsys are 2-4bps richer in today's Asia-Pac session after being closed yesterday for Veterans Day.
- Cash JGBs are 1.5bps richer (7-year) to 1.5bps cheaper (20- and 40-year) across benchmarks. The benchmark 5-year yield is 0.9bp at 1.243% versus the cycle high of 1.272% (see chart).
- Ahead of tomorrow's 5-year supply, the 2s/5s curve has steepened to near its cycle high of 32bps, last reached in late 2023.
- Regression analysis shows a strong pro-cyclical, but atypical, relationship between the 5-year yield and the 2s/5s curve over the past 12 months.
- This dynamic is supported by expectations that the 5-year sector will sit in the "sweet spot" for increased issuance, as Prime Minister Sanae Takaichi looks to deploy her first stimulus package to jump-start the economy.
- Swap rates are 1bp lower to 1bp higher, with a steepening bias.
- Tomorrow, the local calendar will see PPI and International Investment Flow data alongside 5-year supply.
AUSTRALIA: Other Measures Of Core Price Pressures Also Rose In Q3
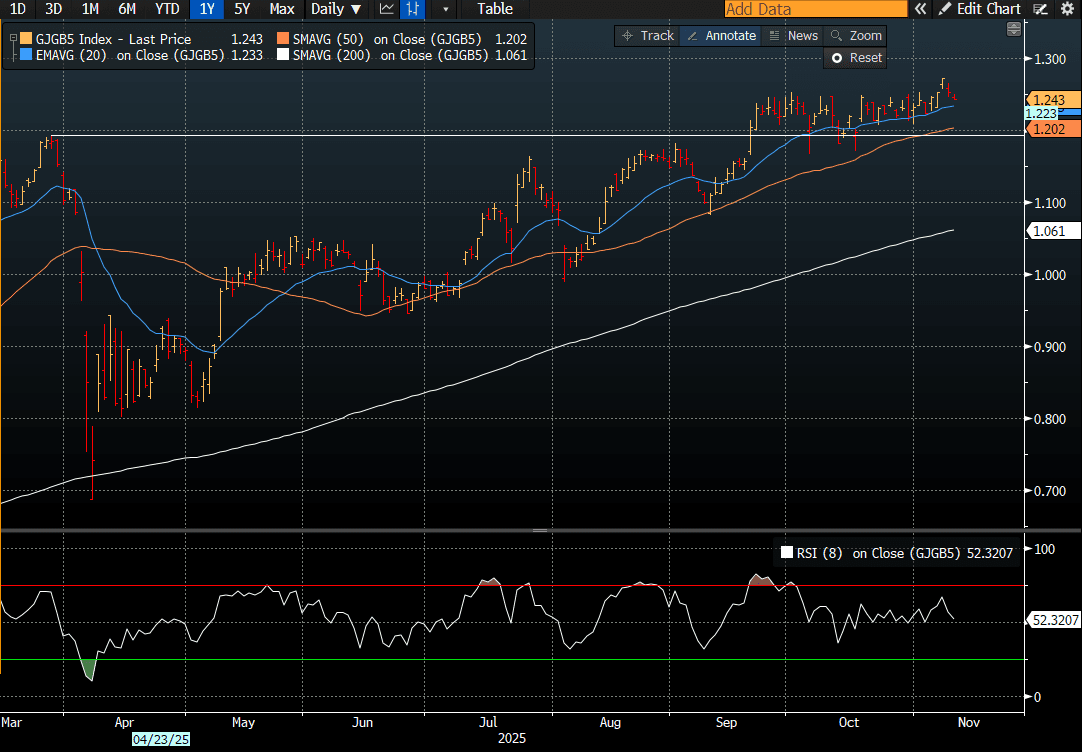
The RBA is unsure of the degree of its restrictiveness and if it’s not “mildly restrictive” there could be “implications” for policy as the economy may be at trend growth, according to comments from Deputy Governor Hauser this week. In November, the RBA assumed that around two-thirds of the Q3 underlying inflation increase was temporary but around one-third could be persistent. It was not just trimmed mean inflation that rose but other measures of core price pressures. Our Q3 PCA measure of underlying inflation rose 0.2pp to 2.8% but is still within the band.
- Measures of underlying inflation include trimmed mean, excluding volatile items such as food and energy, the median. We have one using principal components analysis (PCA) based on Bank of Canada research. Unlike Q2, not all of these were within the band in Q3.
- The chart below shows PCA CPI against other measures. It is less volatile, with a standard deviation below trimmed mean’s. After running ahead of trimmed mean from 2019 until mid-2021, it was below trimmed mean, CPI ex volatile items and ex food & energy in Q3.
Australia underlying inflation y/y %
Source: MNI - Market News/ABS/LSEG
- PCA is useful for when there are a large number of variables, as it finds common patterns that explain most of the variance in the data. In this case, it extracts the common movement in prices and thus creates a measure that reflects underlying developments in inflation and not sector-specific shocks.
- The share of CPI components above 3% also picked up in Q3 to 39% from 37% to be in line with Q4 2024.
- The median CPI has been stable through 2025 at just above 2%.
AUSTRALIA DATA: Strong Home Lending May Contribute To Extended RBA Hold
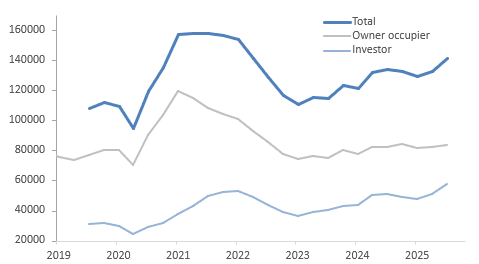
There was a strong rise in the number of new dwelling loans and their value in Q3 as house price inflation rose. The recovery in home lending began in Q2 after the RBA began easing in February and the 75bp to August appears to have contributed to the sharp rise. The Board is unsure how restrictive policy is and remains cautious. It noted this month that “the housing market is continuing to strengthen, a sign that recent interest rate reductions are having an effect”. The lending data is consistent with this and likely to add to its caution about easing further.
- The total number of home loans rose 6.4% q/q to be up 5.8% y/y driven by both owner occupiers and investors, but particularly the latter. Values increased 9.6% q/q to be 13.2% y/y higher as higher home prices added to the amount.
- Owner-occupier loans rose 2.0% q/q after 0.9% q/q to be +1.7% y/y with the growth split between first-time buyers (+2.3% q/q & 0.9% y/y) and others (+2.8% q/q & 3.3% y/y). The level is below that recorded in Q4 2024.
- The softness in owner-occupier lending compared to investors likely reflects poor affordability in the Australian housing market. Our affordability index has improved since Q2 2024 helped by higher incomes and lower rates but remains around 36% below trend and close to its series low.
- Loans to first-time homebuyers are likely to rise further in Q4 with the introduction of the government’s 5% deposit scheme.
- Investor loans soared 13.6% q/q after 5.9% in Q2 to be up 12.3% y/y with strength across states and territories.
No. of new loan commitments dwellings ex refi
Source: MNI - Market News/ABS
Source: Bloomberg Finance LP
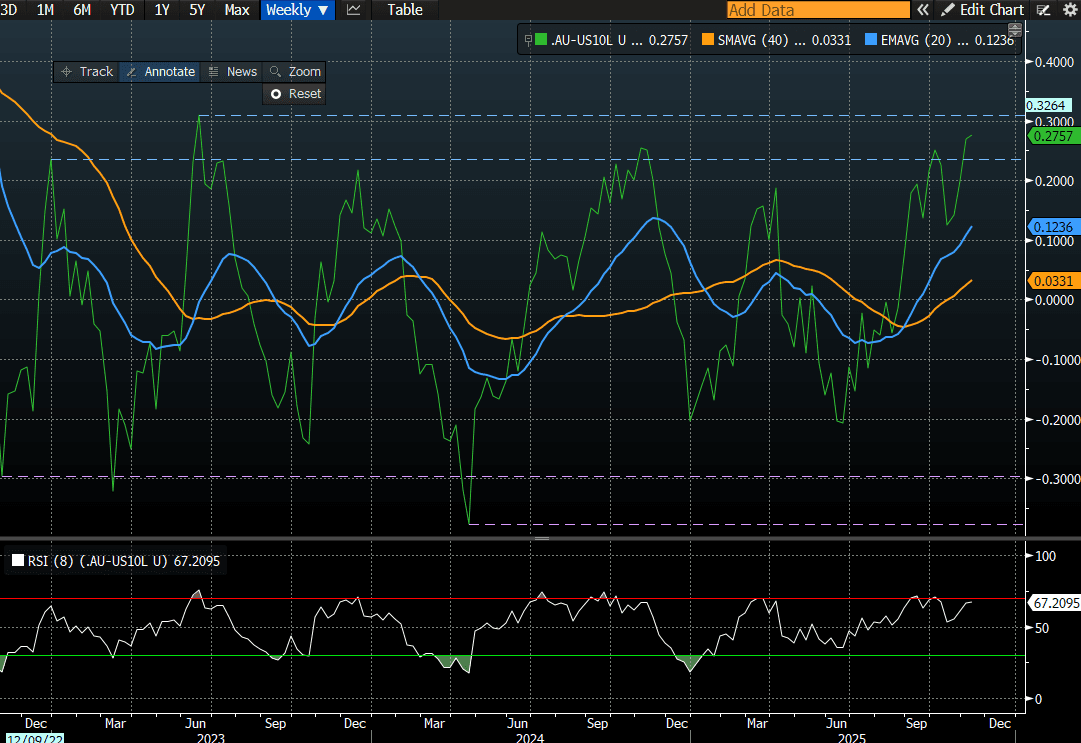
AUSSIE BONDS: Richer But AU-US 10Y Diff At Range Top Ahead Of Jobs Data
ACGBs (YM +1.5 & XM +2.0) are modestly stronger despite today’s much stronger-than-expected home loan data.
- The recovery in home lending began in Q2 after the RBA began easing in February and the 75bp to August appears to have contributed to the sharp rise.
- Cash ACGBs are 1-2bps richer with the AU-US 10-year yield differential at +29bps. At this level, investors may be tempted to position for a narrowing in the differential, as it sits near the top of its well-defined ±30bps trading range (see chart).
- However, such trades carry meaningful risk ahead of tomorrow’s October employment data. The unemployment rate rose 0.2pp to 4.5% in September.
- The unemployment rate is widely expected to normalise somewhat at 4.4% but there are a few economists who expect it to stay at 4.5% or fall back to 4.3%.
- Last month's weak employment data triggered a solid ACGB rally, but those gains were more than fully reversed after the much hotter-than-expected Q3 CPI report.
- RBA-dated OIS pricing is showing a 25bp rate cut in December at a 9% probability, with a cumulative 16bps of easing priced by mid-2026.
- The AOFM plans to sell A$800mn of the 1.75% 21 November 2032 bond on Friday.
Bloomberg Finance LP
BONDS: Closed Slightly Richer But Underperforms $-Bloc
NZGBs closed 1bp richer across benchmarks.
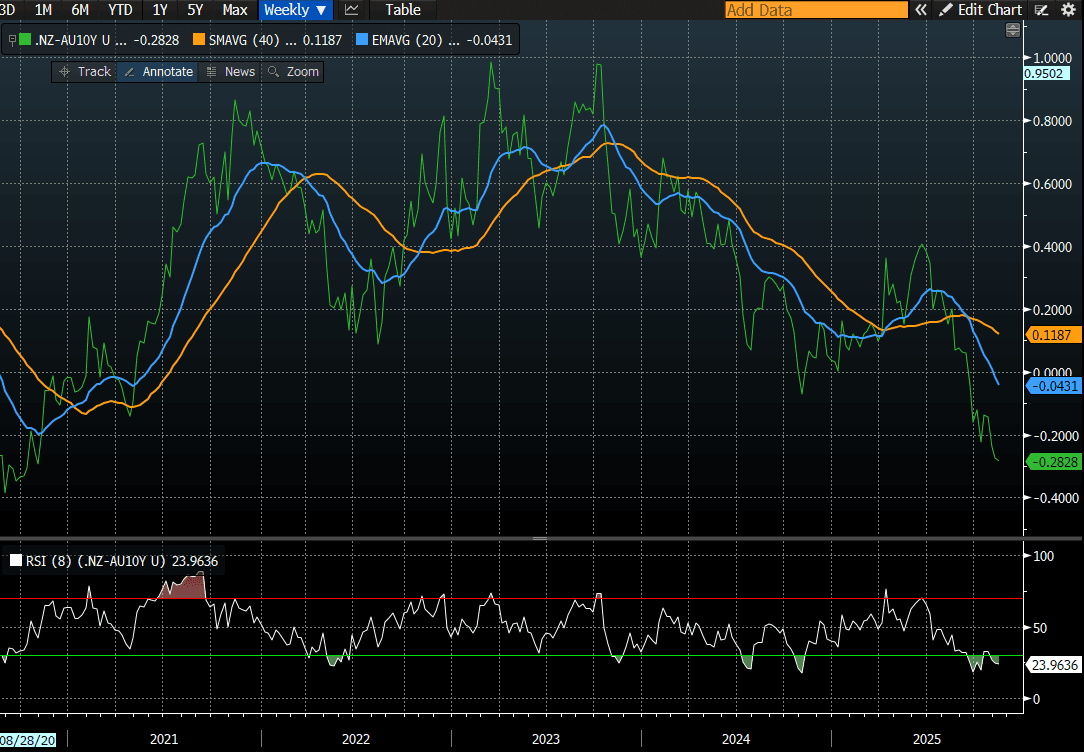
- On a relative basis, NZGBs have underperformed the $-bloc, with the NZ-US and NZ-AU 10-year yield differentials both 3bps wider at +2bps and -27bps, respectively.
- Nevertheless, the NZ-AU 10-year yield differential remains close to its lowest level since 2020. At this level, investors could be lured into taking differential reversal trades. That said, such trades carry meaningful risk ahead of tomorrow’s October employment data. (see chart)
- Swap rates closed flat to 2bps lower, with the 2s10s curve flatter.
- RBNZ dated OIS pricing closed little changed across meetings. 28bps of easing is priced for November, with a cumulative 38bps by February 2026.
- The local calendar will see Card Spending data tomorrow.
- Tomorrow, the NZ Treasury plans to sell NZ$250mn of the 4.50% May-30 bond, NZ$150mn of the 4.25% May-34 bond and NZ$50mn of the 5.00% May-54 bond.
- The NZ Treasury has today announced the appointment of the following joint lead managers to form the panel for the syndicated tap of the 15 May 2036 nominal bond: ANZ Bank; J.P. Morgan; UBS; and Westpac.
- As previously announced, the Treasury expects to launch this transaction before calendar year-end 2025, subject to market conditions. As per usual practice, if the syndication occurs, the scheduled bond tender for that week will be cancelled.
Bloomberg Finance LP
FOREX: Asia-Pac FX: USD Retraces ADP Losses
The BBDXY has had a range today of 1217.77 - 1219.65 in the Asia-Pac session; it is currently trading around 1219, +0.15%.The USD has retraced most of its move lower from overnight in reaction to a weaker ADP print. I am caught a little undecided on the USD at the moment, I liked the fade into 1230 initially but short term I expect dips back toward 1210-1215 to now be supported first up. We could chop around sideways for a while while the market decides which way to go. Above 1230 and we could start to break higher, below 1205 and the downtrends momentum could be re-engaged. Short-term while the 12221/22 area caps price my bias would be for a test toward the 1210-1215 support, above there and the market will look back toward the 1230 area once again.
- EUR/USD - Asian range 1.1571 - 1.1587, Asia is currently trading 1.1572. The pair continued to build on its support below 1.1500, I suspect rallies will now find sellers toward the 1.1650 area initially. This 1.1650-1.1700 area has been the pivot within the larger 1.1400-1.1900 range over the past few months. On the day a move back below 1.1530-1.1540 needed to turn lower again.
- GBP/USD - Asian range 1.3130 - 1.3164, Asia is currently dealing around 1.3130. The pair is trading sideways consolidating on a 1.31 handle. I continue to favor fading rallies though as GBP looks to have put in a medium term top. I suspect the 1.3250-1.3300 area is the place to fade if we see that level again.
- Cross asset : SPX +0.15%, Gold $4110, US 10-Year 4.08%, BBDXY 1219, Crude Oil $60.85
- Data/Events : Germany Wholesale Price Index/CPI/Current Account Balance, Italy Industrial Production,
Fig 1: EUR/USD Spot Daily Chart
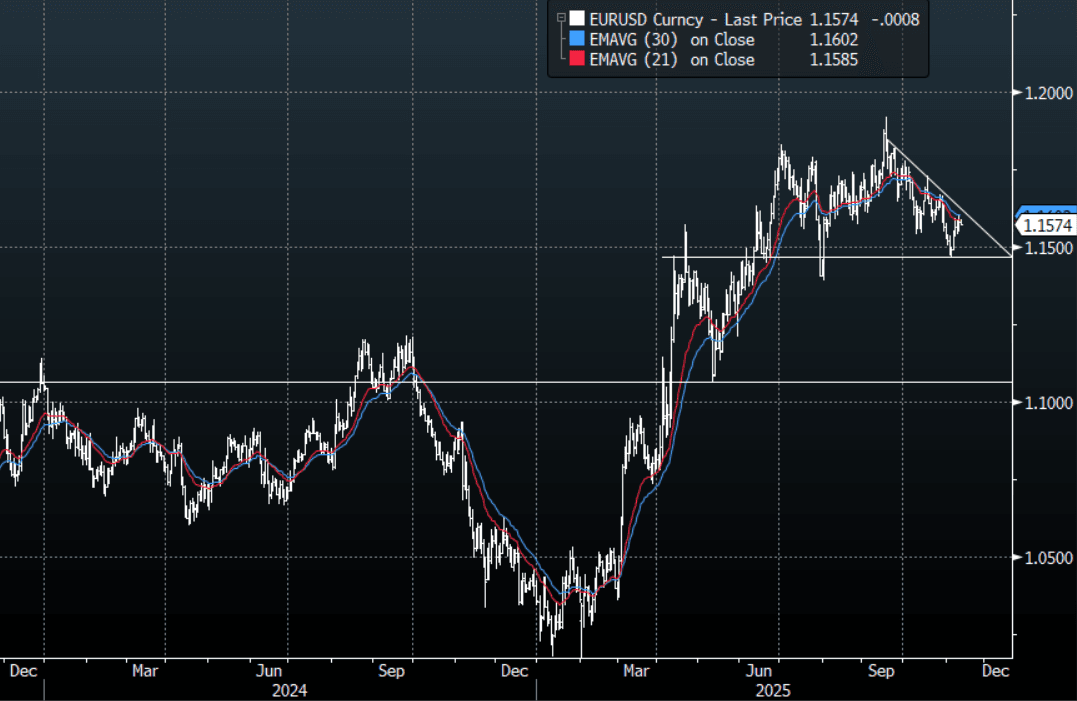
Source: MNI - Market News/Bloomberg Finance L.P
JPY: FinMin Delivers Fresh FX Jawboning, But USD/JPY Pullback Limited So Far
USD/JPY tracks back near 154.60/65 in latest dealings. The pair hit earlier highs of 154.79, fresh highs since Feb of this year. Jawboning from FinMin Katayama has crossed a short while ago, which has helped temper the run higher in USD/JPY. Notably: "JAPAN FINMIN KATAYAMA: CLOSELY WATCHING FX MOVES WITH HIGH SENSE OF URGENCY, INCLUDING UNORDERLY, SPECULATIVE MOVES - [RTRS]"
- Katayama also stated that the disadvantages of a weaker yen are outweighing the advantages. This may be edging us closer to intervention risks, although remarks like, “We can’t tolerate speculative moves.” “We will take appropriate action if needed.” don't appear to be part of the verbal rhetoric yet. So far USD/JPY has been supported sub 154.60 on this pullback.
- Perhaps limiting USD/JPY downside so far has also been remarks from PM Takaichi, who again stated that Japan has not yet emerged from deflation and that she hopes the BoJ conducts policy which achieves the price target sustainably (i.e via wage growth).
- At face value these comments are again pushing back on fresh BoJ tightening in the near term.
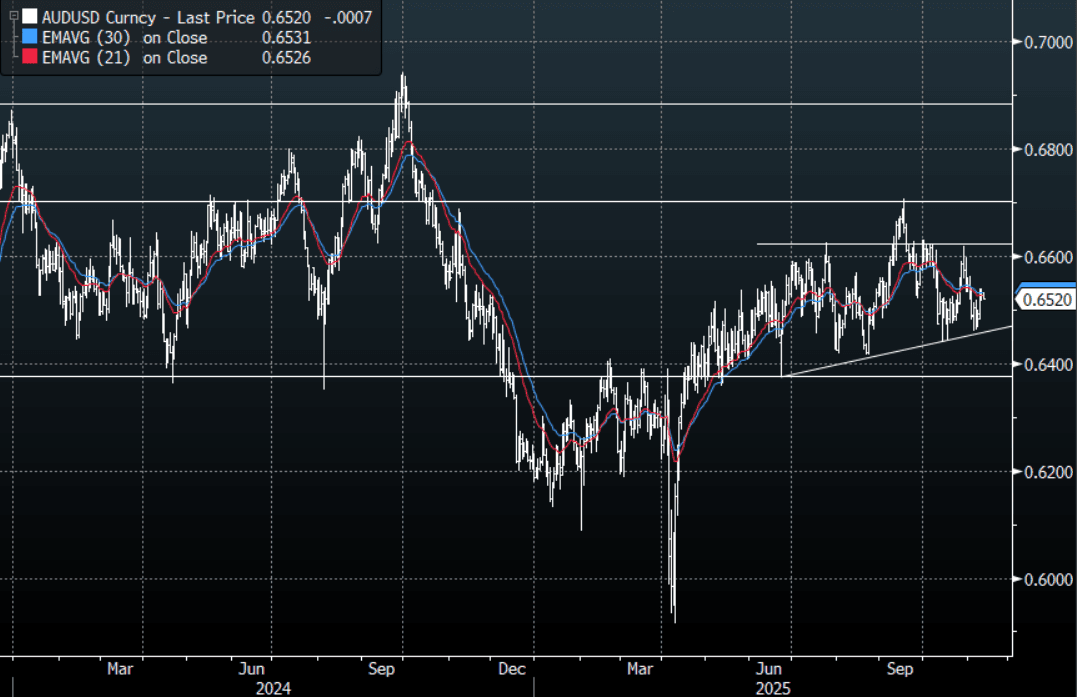
AUD: Asia-Pac: AUD/USD Drifts Lower
The AUD/USD has had a range today of 0.6520 - 0.6532 in the Asia- Pac session, it is currently trading around 0.6520, -0.10%. The AUD/USD has drifted sideways in our session consolidating its gains above 0.6500. The AUD will be one of the main beneficiaries while this positive sentiment dominates the market. The AUD/USD needs a sustained push above the 0.6550 area for the focus to turn back toward the 0.6650/0.6700 year highs. Look for intra-day dips toward 0.6480-0.6500 to be supported if this move higher is to come to fruition.
- MNI AU - Strong Home Lending May Contribute To Extended RBA Hold. The RBA noted this month that “the housing market is continuing to strengthen, a sign that recent interest rate reductions are having an effect”. The lending data is consistent with this and likely to add to its caution about easing further.
- Hauser Says RBA Debating Current Policy Stance - Per RTRS: Headlines have crossed from an Rtrs interview with RBA Deputy Governor Hauser. Rtrs notes: "A top Australian central banker said on Wednesday that there was increasing debate about whether the current cash rate of 3.6% is restrictive enough to keep inflation in check, adding that the question is critical for the policy outlook."
- Options : Closest significant option expiries for NY cut, based on DTCC data: 0.6500(AUD1.37b), 0.6530(AUD 939m). Upcoming Close Strikes : 0.6520(AUD852m Nov 13), 0.6750(AUD2.17b Nov 14) - BBG
Fig 1: AUD/USD spot Daily Chart
Source: MNI - Market News/Bloomberg Finance L.P
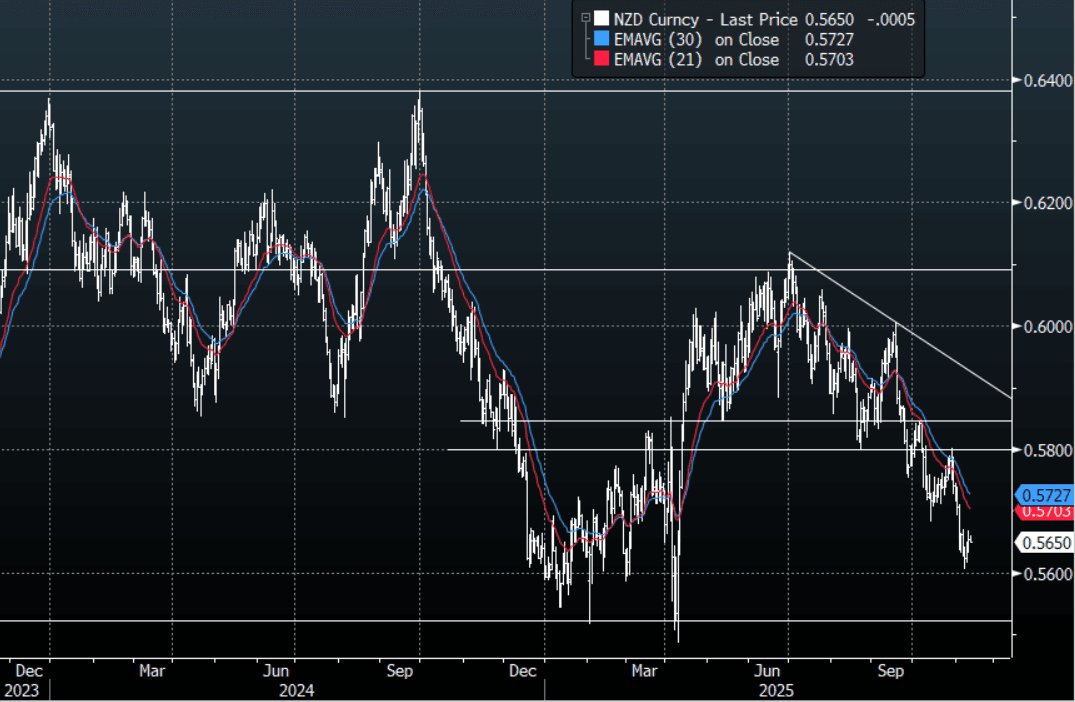
NZD: Asia-Pac: NZD/USD Drifts Back Toward 0.5650
The NZD/USD had a range today of 0.5648 - 0.5660 in the Asia-Pac session, going into the London open trading around 0.5650, -0.10%. The NZD has given back most of its overnight gains. The NZD does stand out as a vehicle to express a short in but should this bout of improved risk sentiment grow it will be tough for the NZD to ignore it and it could play catch up to the move at some point, if you feel this bounce in risk will fail and move back lower then the NZD remains a great way to express that. I still suspect any decent bounce will again attract sellers though. The first sell area on a pullback would be around 0.5750 and then the more pivotal 0.5850 area. Dips on the day toward 0.5630-40 needs to hold for the short-term retracement to potentially extend, through here and the focus returns back to making new lows.
- "GOLDMAN PUSHES BACK ITS CHINA RATE CUT FORECASTS BY ONE QUARTER, GOLDMAN NOW SEES CHINA DELIVER CUTS TO POLICY RATE, RRR IN 1Q" - BBG
- Options : Closest significant option expiries for NY cut, based on DTCC data: 0.5600(NZD538m), 0.5800(NZD461m). Upcoming Close Strikes : 0.5380(NZD460m Nov 13) - BBG
Fig 1: NZD/USD Spot Daily Chart
Source: MNI - Market News/Bloomberg Finance L.P
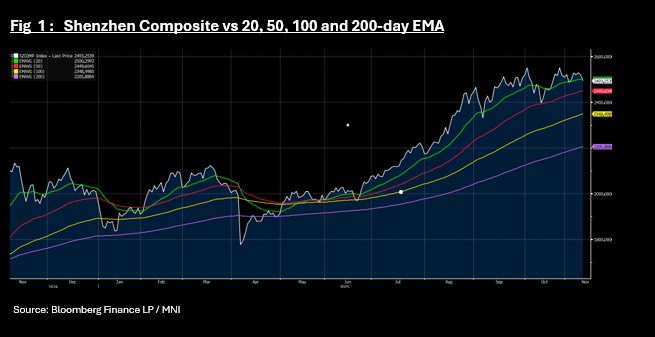
ASIA STOCKS: KOSPI Up on Government Comments; Shenzhen Through Key Tech Level
In signs that consumer sentiment could be trending in the right direction, JD.Com said it's sales hit records during this year's singles days, with a 40% increase in shoppers during China's massive annual online shopping day. In Japan, SONY rallied for a second day after yesterday's results as several key brokers increased their price target, despite the NIKKEI falling as profit taking on tech stocks dominated. The KOSPI rose again as the President called for further incentives for long term investment in stocks by retail investors.
- The NIKKEI fell -0.30% and with successive falls following recent highs, is now over 3% below.
- The KOSPI is approaching the recent new high today up +0.65% to 4,133.
- China's bourses were mixed with the Hang Seng leading gains of +0.63% whilst onshore bourses all fell with the biggest losses coming from Shenzhen as it neared 1% down. The losses sees the Shenzhen Composite at 2,493 and trade below the 20-day EMA of 2,500 with the 50-day EMA below at 2,449.
- Last week's falls for the NIFTY 50 seem a memory as it opens strongly for a third day. Up +0.40% in morning trade pushes India's key bourse up over 1% for the week so far as President Trump said he is getting close to a trade deal with India.
- South East Asia's major bourses are going in different directions with the FTSE Malay KLCI down -0.22%, the Jakarta Composite up +0.45% whilst the SE Thai dipped back below 1,300 to 1,294
ASIA STOCKS: Taiwan Outflows Persist, Can Malaysian Inflows Pick Up Further?
Yesterday saw more outflow pressures than inflows for the EM Asia Pac region. Taiwan net outflows continued, with the past 5 days now seeing outflows of more than $4bn. Trends in local stocks reflect a buy on dips mentality, although the TWSE hasn't been able to sustain moves back above 28000 at this stage (which marked recent cycle highs at the start of the month). Taiwan will soon be back at YTD outflows if current trends persist. For South Korea we did see modest inflows yesterday, but it is too early to say if this is the start of a turnaround. Indeed early trends today, per the BBG NBUY function, are for offshore net selling (over $200mn). We did see US tech related equity trends falter in Tuesday trade, although the Kospi is still up close to 1% so far in Wednesday trade. US equity futures are also higher.
- Elsewhere, the recent see-saw pattern in Indian flows continued, with the 5-day sum back close to flat. Onshore equity sentiment looks more positive, although we are still a little distance from late Oct highs above 26k for the Nifty. Focus remains on any US-India trade deal announcement.
- In South East Asia, positive Indonesia inflow momentum slowed somewhat. Malaysia saw positive trends yesterday and with the Malaysian Prime Minister upbeat on local growth prospects, we could see firmer trends for local stocks. Note in the past trading month we have seen over $350mn in net outflows, so there is ample scope for a pick up in the period ahead.
Table 1: Asian Markets Net Equity Flows
| Yesterday | Past 5 Trading Days | 2025 To Date | |
| South Korea (USDmn) | 64 | -3424 | -1697 |
| Taiwan (USDmn) | -516 | -4199 | 497 |
| India (USDmn)* | -568 | -76 | -16456 |
| Indonesia (USDmn) | -39 | 113 | -2332 |
| Thailand (USDmn) | -75 | -140 | -3164 |
| Malaysia (USDmn) | 48 | 54 | -4179 |
| Philippines (USDmn) | 12 | 108 | -661 |
| Total (USDmn) | -1074 | -7566 | -27991 |
| * Data Up To Nov 10 |
Source: Bloomberg Finance L.P./MNI
OIL: Crude Holds Most Of Tuesday’s Gains Ahead Of Key Reports
After rising around 1.5% on Tuesday, crude is slightly lower on Wednesday as the market waits for key information released later. WTI is down 0.3% to $60.84, holding above $60 through the session, while Brent is 0.3% lower at $64.99 after falling to $64.90. The USD index is up 0.1%.
- The excess oil supply driven by increased OPEC and non-OPEC output remains in focus with the spread between the WTI December-January contracts only 4c, suggesting an expected easier market. The EIA short-term outlook, IEA annual report and OPEC monthly report are published Wednesday. As well as US industry-reported inventory data.
- While expected excess supply has pressured oil prices, the market remains unsure over the impact of the latest sanctions on Russia. There has already been an increase in diesel prices and signs that India is looking for sources that are not Lukoil or Rosneft. Also, Russia’s Lukoil’s West Qurna 2 field in Iraq has been transferred to state firms to ensure production continues, according to Bloomberg.
- Our US analysts believe that the post-shutdown data schedule should be published next week with a risk that October CPI won’t be released. See their FAQ here.
- Later the Fed’s Barr, Williams, Paulson, Waller, Bostic, Miran and Collins speak as well as the ECB’s Schnabel and de Guindos. The Eurogroup meeting is taking place. There are no data of note.
GOLD: Pause In Latest Rally, Range Of Fed Speakers Later Today
Gold reached a high of $4145.50/oz early in today’s APAC session but was then pressured by the strengthening of the US dollar (BBDXY +0.1%) and higher US equity futures (S&P e-mini +0.1%) after several days of gains. Bullion is now down 0.4% to $4108.7, after an intraday low at $4103.75. The market is watching US developments closely with a vote in the House of Reps to end the government shutdown due on Wednesday. How the delayed data print will impact the outlook for the Fed.
- The market is waiting for more information with around 17bp of easing priced in for the 10 December FOMC meeting and a full cut by January. Fed comments since the last decision have added uncertainty. There is a range of members speaking today. ADP data on Tuesday signalled labour market weakness.
- Our US analysts believe that the post-shutdown data schedule should be published next week with a risk that October CPI won’t be released. See their FAQ here.
- Silver is down 0.3% to $51.07 after falling to $50.873.
- Equities are mixed with the CSI 300 down 0.4% but the KOSPI up 0.7%. Oil prices are lower with WTI -0.3% to $60.85/bbl. Copper is down 0.3%.
- Later the Fed’s Barr, Williams, Paulson, Waller, Bostic, Miran and Collins speak as well as the ECB’s Schnabel and de Guindos. The Eurogroup meeting is taking place. There are no data of note.
ASIA: Inflation Green Shoots Could See Rates on Hold for Near Term
- Over the weekend, China's YoY CPI rose to +0.2%, after months of flipping between very modest to no inflation and deflation. Core inflation however jumped to +1.2%, it's highest reading in over a year.
- The Q3 Monetary Policy Report described inflation as 'weak' whilst the broader economy as stable and fundamentals solid. Following this report Goldman Sachs pushed their rate cut call out to Q1 2026, from Q4 2025.
- Over the last decade in various cycles China's deflation challenges have impacted the region. In 2014-16 a commodity slump pushed on a slowing economy after years of heavy investment particularly in manufacturing resulting in Asia facing cheap Chinese imports, which pushed PPIs in the region negative. From 2018-19 the early stages of the trade war under the Trump administration resulted in manufacturing excesses being dumped in the region, pushing down producer prices. Again in 2023-25 manufacturing overcapacity, particularly from EV related industries has seen extreme price competition, pushing down producer prices in the region.
- PPI's correlation to CPI is strong. Likewise CPI's correlation to Core. As core rises, it is likely to result in CPI rises, which in turn can feed into PPI. Whilst PPI and CPI remain negative and barely positive, it is their delta that raises the most interest. From their lows they have retraced 40% for PPI and 120% for CPI and with Core CPI now pushing to it's highest since 2022, are we about to see a bottoming and or a resurgence of inflation and what does that mean for the region and the rate cycle?
Fig 1: China PPI YoY, CPI YoY and Core CPI YoY & China CPI Correlations with Korea, Malaysia + Indonesia - Rolling 3yrs
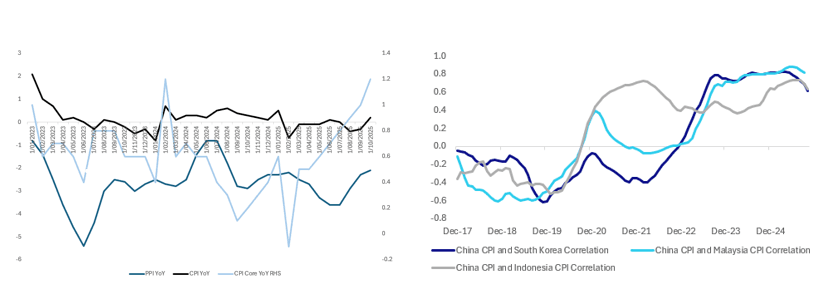
source: Bloomberg Finance LP / MNI
- Regionally, whilst on an historical comparison CPI remains low, the delta of CP from lows is worth noting.
Fig 2: Malaysia, Indonesia & Korea CPI YoY
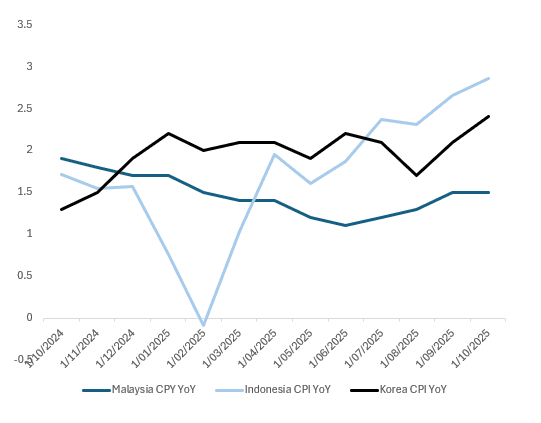
source: Bloomberg Finance LP / MNI
- When looking back, Malaysia' meeting last week could mark the turning point in the rates cycle for region. Bank Negara (BNM) held rates steady with a balanced assessment of inflation and growth, a view likely re-enforced by the US trade deal. The BNM sees inflation as contained through 2026 noting global costs moderating. The BNM cuts rates only once whereas the Bank Indonesia five times and Bank of Korea four times.
- The BOK faces a housing crisis with house price escalation at the forefront of policymakers minds. When added to the trend in CPI, it suggests the BOK could be on hold for some time.
- In Indonesia, the Rupiah has lost -2.5% over the last three months and is down -3.4% year to date. This at a time when 3Q GDP topped 5% and the JCI is up 40% from the trade war induced April lows.
- As US rate cuts now appear less certain, the outlook in Asia appears similar. What could follow for Asia's Central Bank's could be an extended hold, with those markets with rate cuts priced in still, progressively taking them out.
- The Goldman Sachs change may just be the start of more to come across the region, as rate cut expectations get pushed out. Central Bank's need to maintain flexibility to cut rates further and worry about taking rates too low especially if their currencies are pressurized.
- The BOK is on hold for now with the BNM joining them. Markets will watch with interest as the BI deals with the competing interests of a pro-growth government and a currency that won't rally.
ASIA: Inflation Green Shoots Could See Rates on Hold for Near Term (Part 2)
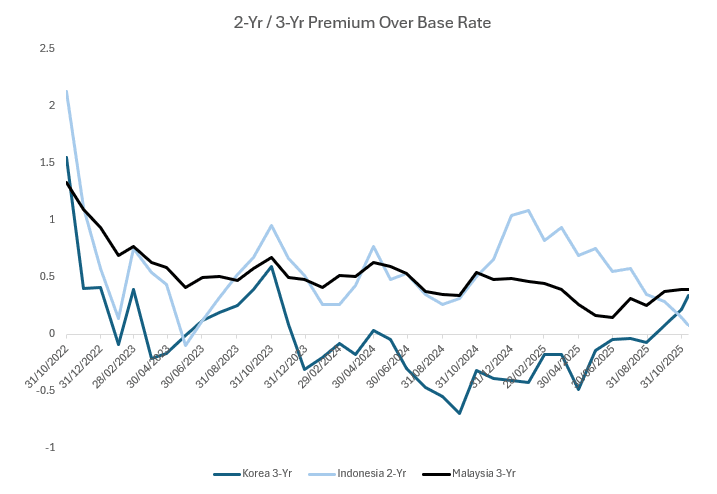
- Bond markets in the region have moved to price out cuts, yet the potential for further moves remains. In Korea and Malaysia we assess the 3-Yr (due to the presence of a bond future) versus the bas rate and the premium over the base rate. For Indonesia we use the 2-Yr.
- What we found is that since the mid part of 2025, the premium over has been increasing. A sign that can be interpreted as the bond market starting to question further rate cuts.
- During the mid part of this year this relationship was negative in Korea, but has moved to +33bps, pricing out cuts and suggesting the BOK is on hold for some time. When considering the last time the BOK was on hold for an extended period in mid 2023, this spread traded around +60bps for some time.
- In Indonesia, the premium over currently is +9bps yet in the period in late 2023, this relationship above +70bps.
- In Malaysia, the period in early 2024 when the BNM was on hold for an extended period saw this relationship get to +65bps whereas today it stands at +40bps
The analysis when added to Part 1 of "Inflation Green Shoots Could See Rates on Hold for Near Term" suggests that if inflation continues to increase at the pace it has been increasing, and BOK, BI and BNM are on hold for an extended period, short end rates have room to move higher from today's levels.
Fig 1: 2-Yr and 3-Yr Government Bond Yield Premium Over the Base Rate
source: Bloomberg Finance LP / MNI
KRW: Rhee- Will Intervene If See Excessive Moves, Policy Outlook Data Dependent
Spot USD/KRW sits off earlier highs around 1470. We were last 1467, with some help for the won coming from lower USD/JPY levels (amid fresh FX jawboning from the Japan FinMin). BoK Governor Rhee was also interviewed by BBG. ON FX Rhee noted that: "*RHEE: WHEN WE SEE EXCESSIVE MOVEMENT WE'RE WILLING TO INTERVENE, *RHEE: FX MARKETS EXCESSIVELY SENSITIVE TO RECENT UNCERTAINTIES as well as "*RHEE: HARD TO JUDGE IF WON REFLECTING FUNDAMENTALS" (via BBG). These don't point to a line in the sand that we have seen in the past (when the authorities have stated they are observing herding behavior in FX markets)> Still, as we have noted in recent sessions, moves towards recent highs near 1480 for USD/KRW create the risk of a policy response.
- On the monetary policy outlook. Rhee noted that while the official bias is to ease policy, given the negative output gap, he added: “But the magnitude and timing of the cut or even the change of direction will depend on the new data that we’ll see.”
- He added the central bank will update its thinking at the Nov policy meeting (due on the 27th).
UP TODAY (TIMES GMT/LOCAL)
| Date | GMT/Local | Impact | Country | Event |
| 12/11/2025 | 0700/0800 | *** | Germany CPI (f) | |
| 12/11/2025 | 0700/0800 | *** | Germany CPI (f) | |
| 12/11/2025 | 0900/1000 | * | Industrial Production | |
| 12/11/2025 | 1000/1000 | ** | Gilt Outright Auction Result | |
| 12/11/2025 | 1045/1145 | ECB Schnabel Speech at BNP Paribas | ||
| 12/11/2025 | 1140/1240 | ECB de Guindos at FIBI International Banking Conference | ||
| 12/11/2025 | 1200/0700 | ** | MBA Weekly Applications Index | |
| 12/11/2025 | 1205/1205 | BOE Pill in Panel at International Monetary Research Conference | ||
| 12/11/2025 | - | *** | Money Supply | |
| 12/11/2025 | - | *** | New Loans | |
| 12/11/2025 | - | *** | Social Financing | |
| 12/11/2025 | - | ECB Lagarde, Cipollone at Eurogroup Meeting in Brussels | ||
| 12/11/2025 | - | BOE MPG Meeting | ||
| 12/11/2025 | 1330/0830 | * | Building Permits | |
| 12/11/2025 | 1420/0920 | New York Fed's John Williams | ||
| 12/11/2025 | 1500/1000 | Philly Fed's Anna Paulson | ||
| 12/11/2025 | 1505/1005 | Kansas City Fed's Jeff Schmid | ||
| 12/11/2025 | 1520/1020 | Fed Governor Chris Waller | ||
| 12/11/2025 | 1730/1230 | Fed Governor Stephen Miran | ||
| 12/11/2025 | 1800/1300 | ** | US Note 10 Year Treasury Auction Result | |
| 12/11/2025 | 1830/1330 | Bank of Canada meeting minutes | ||
| 12/11/2025 | 2050/1550 | New York Fed's Roberto Perli | ||
| 12/11/2025 | 2100/1600 | Boston Fed's Susan Collins | ||
| 13/11/2025 | 0030/1130 | *** | Labor Force Survey | |
| 13/11/2025 | 0700/0700 | *** | UK Monthly GDP | |
| 13/11/2025 | 0700/0800 | *** | Final Inflation Report | |
| 13/11/2025 | 0700/0700 | ** | Trade Balance | |
| 13/11/2025 | 0700/0700 | ** | Index of Services | |
| 13/11/2025 | 0700/0700 | ** | Index of Production | |
| 13/11/2025 | 0700/0700 | ** | Output in the Construction Industry | |
| 13/11/2025 | 0700/0700 | *** | GDP First Estimate | |
| 13/11/2025 | 0700/0800 | *** | Final Inflation Report | |
| 13/11/2025 | 0730/0730 | BOE MPG Minutes Released | ||
| 13/11/2025 | 0930/0930 | Productivity Flash Estimates | ||
| 13/11/2025 | 1000/1100 | ** | EZ Industrial Production | |
| 13/11/2025 | 1200/1200 | BOE Greene in Panel on Central Bank Independence | ||
| 13/11/2025 | - | ECB de Guindos at ECOFIN Meeting in Brussels | ||
| 13/11/2025 | 1300/1400 | ECB Elderson Moderates Climate and Banks Panel | ||
| 13/11/2025 | 1300/0800 | San Francisco Fed's Mary Daly | ||
| 13/11/2025 | 1330/0830 | *** | Jobless Claims | |
| 13/11/2025 | 1330/0830 | ** | WASDE Weekly Import/Export | |
| 13/11/2025 | 1330/0830 | *** | CPI | |
| 13/11/2025 | 1330/0830 | *** | CPI | |
| 13/11/2025 | 1330/0830 | *** | CPI |