MNI EUROPEAN MARKETS ANALYSIS: China Lowers Growth Target
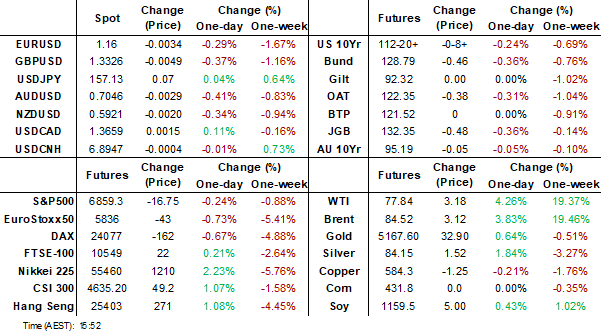
- Oil prices have steadily push higher and now sit close to Tuesday highs. The USD has been supported on dips, the BBDXY index back above 1200. The US 10yr Tsy yield continues to push higher (last 4.12%).
- China set its growth target at 4.5-5.0% for 2026, the lowest expansion goal since 1991. Regional equities have rebounded strongly though, led by South Korea. Australia household spending lost a little momentum in January.
- Looking ahead, second tier European data will precede the ECB minutes on Thursday, before US jobless claims. All focus will then turn to Friday's US employment report.
MARKETS
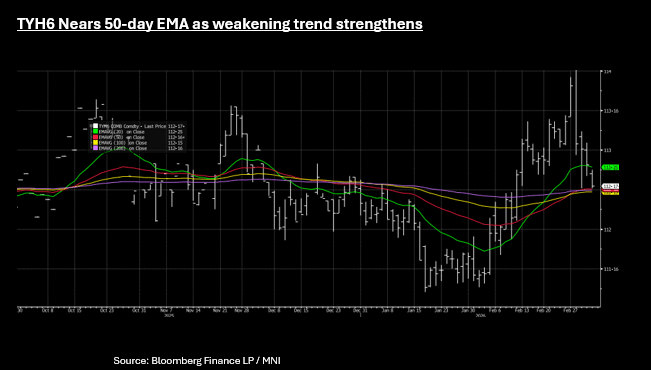
US TSYS: 10-Yr Through 4.10%, Upper Momentum in Yields Strengthens
The weakness continued for US bonds in Asia Thursday with yields higher again as the long end stumbled. US bond futures were all lower with the 10-Yr down -08+ to 112-17+, nearing the downside resistance from the 50-day EMA of 112-16+. The dramatic convergence of the 50,100 and 200-day EMA suggest a potential major trend reversal or a significant, high-volume breakout in the short term given no longer term trend to anchor price action.
Yields were higher across the curve by +0.8bp to 3.0bps in Asia Thursday, ignoring regional equity strength .
- The 2-Yr was up +0.6bps at 3.56%
- The 5-Yr was up +1.7bps at 3.701%
- The 10-Yr was up +2.3bps at 4.123%
- The 30-Yr was up +2.7bps at 4.764%
MNI UST Issuance Deep Dive: March 2026: We've just published our latest US Treasury Issuance Deep Dive - Download Full Report Here:
https://media.marketnews.com/MNI_US_Deep_Dive_Issuance_2026_02_c9b4586b77.pdf
US Data/Speaker Calendar (prior, estimate).
- Challenger Job Cuts
- Initial Jobless Claims (212k, 215k), Continuing Claims (1.833M, 1.848M)
- Import Price Index MoM (0.1%, 0.3%), YoY (0.0%, 0.2%)
- Export Price Index MoM (0.3%, 0.2%), YoY (3.1%, --)
- Nonfarm Productivity (4.9%, 1.8%)
- Unit Labor Costs (-1.9%, 2.0%)
- US TSY US$105B 4 week & US$95B 8 week bill auctions
- Chicago Fed Goolsbee may address policy related topics at Foreign Policy Association Financial Services Dinner (no text)
Source: Bloomberg Finance L.P. / MNI
JGBS: Cheaper Despite Solid Demand At Today's 30Y Auction
At the Tokyo lunch break, JGB futures are weaker, -26 compared to settlement levels.
- Today’s weekly international investment flow data again through support the idea that offshore investors continue to shift funds into Japanese bonds. Year to date net inflows into Japan bonds are now over 7.6trln.
- Cash US tsys are flat to 2bps cheaper in today's Asia-Pac session.
- Cash JGBs are 1-5bps cheaper across benchmarks, with a steepening bias after today's 30-year supply.
- The benchmark 30-year yield is 3.5bps higher at 3.405% versus the cycle high of 3.876%.
- Swap rates are 1-4bps higher.
- Currently, BOJ-dated OIS is slightly 1-4bps softer than pre-January MPM levels. This is a marked turnaround from mid-February, when the market was 1-5bps firmer than pre-January MPM levels.
- Notably, this move seems at odds with the current inflationary threat from the price of oil. BOJ Governor Ueda on Wednesday warned that a sustained rise in crude oil prices could push up underlying inflation, which the Bank monitors closely as a key factor in guiding monetary policy. The governor reiterated the bank's stance of gradually raising the policy rate if economic and price conditions evolve as expected.
- Tomorrow, the local calendar will see
Source: Bloomberg Finance LP / MNI
JAPAN DATA: Offshore Inflows Continue Into Local Bonds & Stocks
Offshore investors continue to shift funds into both Japan bonds and equities, continuing recent trends. Year to date net inflows into Japan bonds are now over ¥7.6trln, while for equities we near ¥6.4trln, but we haven't had a negative week of net selling (in equities) since mid Dec 2025. Elevated yields may continue to be appealing to offshore investors in the JGB space, while local equities have dipped sharply since the end of last week (post the Iran conflict and oil price spike). This week's flow update should provide guidance on whether offshore investor sentiment has been shaken.
- The other noteworthy update from last week's flow update, was local Japan investors continuing to sell offshore bonds. Since the final week of 2025, cumulative net selling in this segment now stands at over ¥4trln.
- This is diverging somewhat from improved global bond returns, but such trends may indicate a preferred home bias from local investors.
- Local investors again purchased overseas stocks, albeit at a fairly modest pace.
Table 1: Japan Offshore Weekly Investment Flows
| Billion Yen | Week ending Feb 27 | Prior Week |
| Foreign Buying Japan Stocks | 973.9 | 399.7 |
| Foreign Buying Japan Bonds | 1365.1 | 1882.9 |
| Japan Buying Foreign Bonds | -673.1 | -1900.8 |
| Japan Buying Foreign Stocks | 100.7 | 405.2 |
Source: Bloomberg Finance L.P/MNI
AUSSIE BONDS: Cheaper After Subdued Session Despite HH Spend Undershoot
ACGBs (YM -5.0 & XM -5.0) are weaker after trading in relatively narrow ranges in today’s session.
- This came despite Australia household spend for Jan printing a little weaker than forecast. The m/m print rose 0.3%m/m versus 0.4% forecast. This saw the y/y outcome print at 4.6%, versus 5.1% forecast and 5.0% prior. Yesterday's national accounts also showed some slowing in household consumption growth.
- Cash US tsys are flat to 2bps cheaper in today's Asia-Pac session.
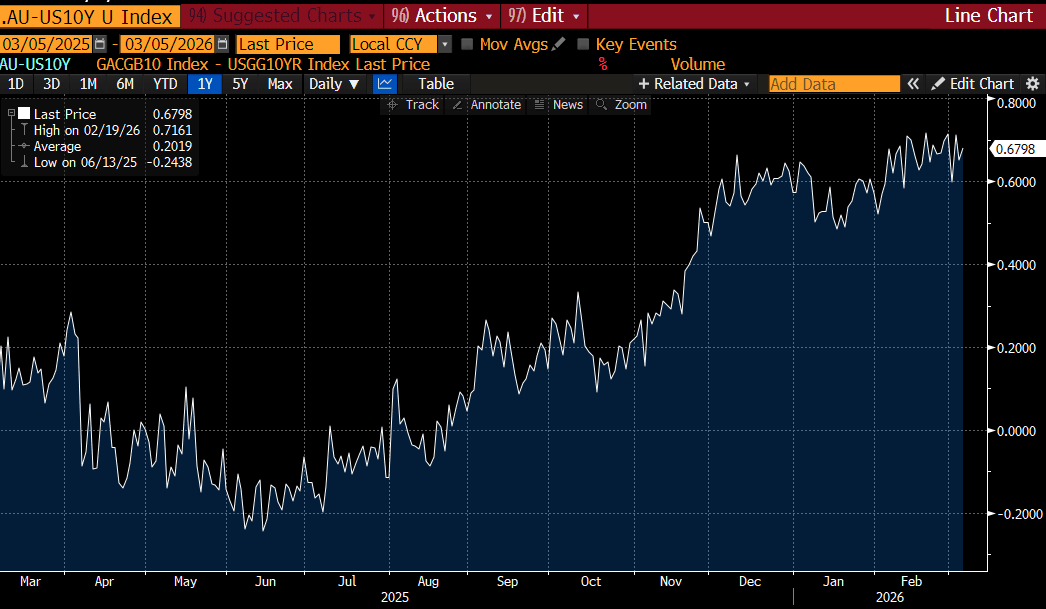
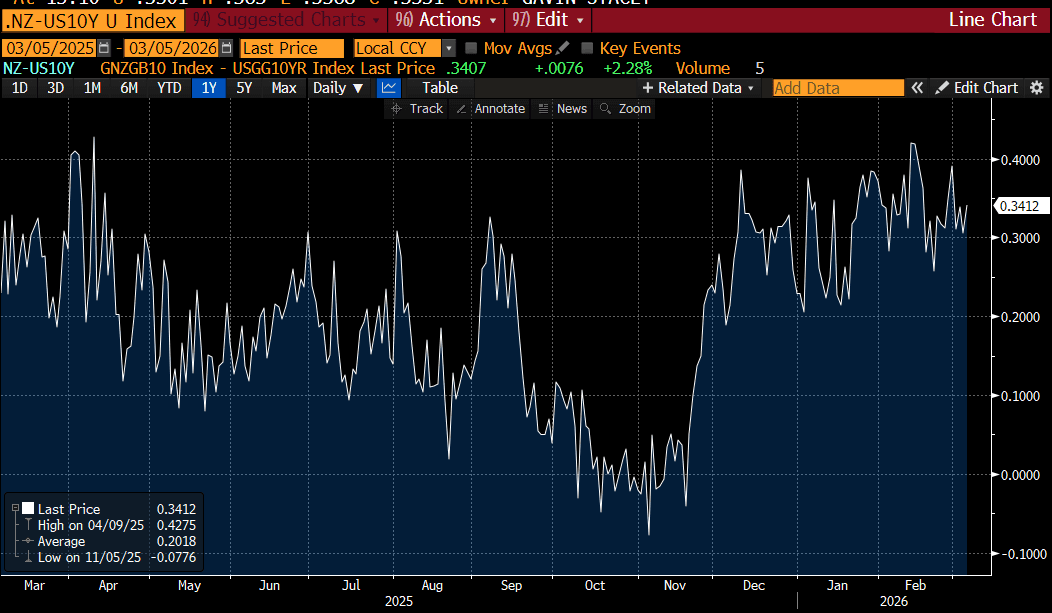
- Cash ACGBs are 5bps cheaper with the AU-US 10-year yield differential at +68bps.
- (MT Newswires) "Commonwealth Bank of Australia (ASX:CBA) said that it still expects the Reserve Bank of Australia (RBA) to hold rates in March and raise in May as the latest household spending data completed the major data set ahead of a rate decision, according to a Thursday report by the bank." - via BBG
- The bills strip has bear-steepened, with pricing -1 to -6.
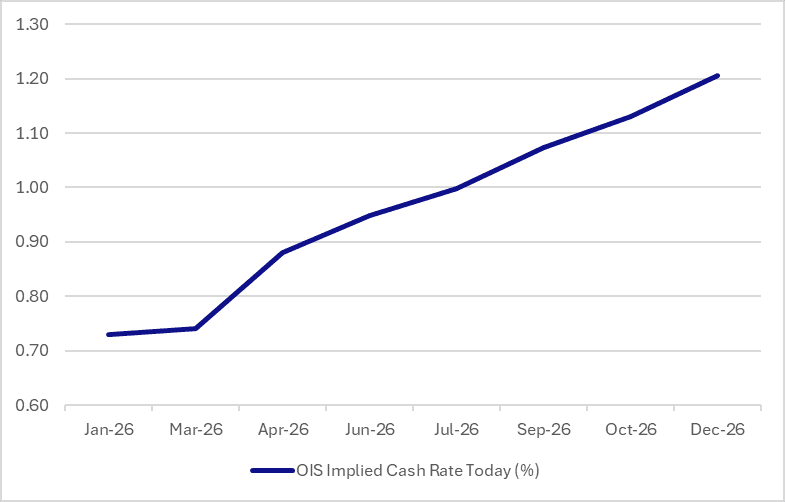
- RBA-dated OIS pricing shows tightening across all meetings, with the probability of a 25bp hike rising from 26% for March to 121% by June and 198% by December 2026.
- Tomorrow, the local calendar will see Foreign Reserves.
- The AOFM also plans to sell A$800mn of the 1.50% 21 June 2031 bond on Friday.
Bloomberg Finance LP
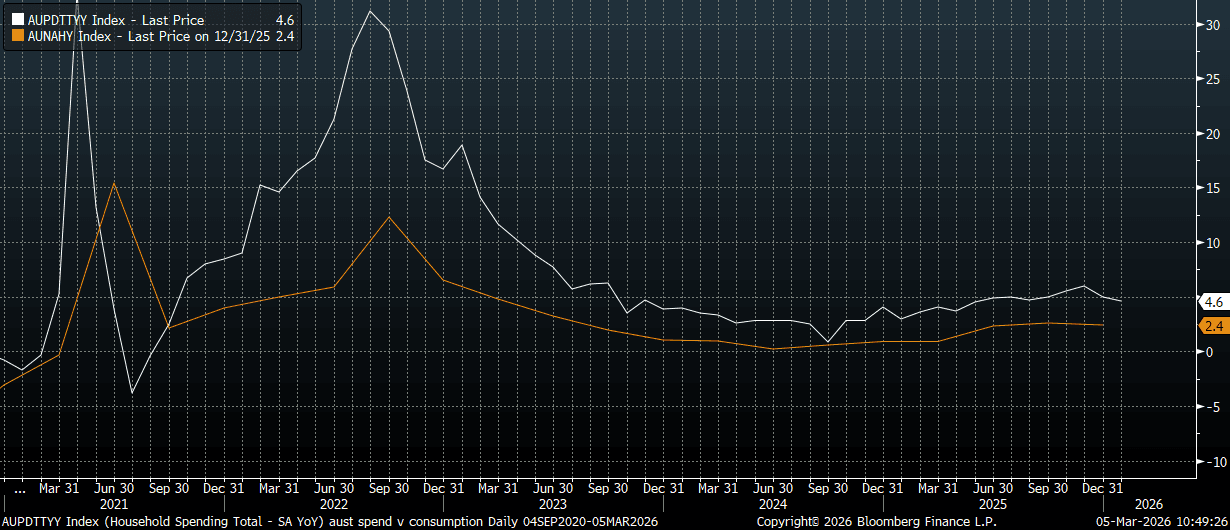
AUSTRALIA DATA: Jan Household Spending Lower Forecast, Y/Y Back Under 5%
Australia household spend for Jan was a little weaker than forecast. The m/m print rose 0.3%m/m versus 0.4% forecast, while the Dec outcome was to a -0.5% fall (after originally reported as a -0.4% decline). This saw the y/y outcome print at 4.6%, versus 5.1% forecast and 5.0% prior. This comes after yesterday's national accounts, which showed some slowing in household consumption growth. The chart below plots this measure in y/y terms (orange line), versus today's update household spending print for Jan (in y/y terms, the white line). Spending appears to be moderating but from reasonable levels. The RBA is unlikely to be concerned and it may not prevent another rate hike, given still elevated inflation pressures and a tight labour market.
- The ABS noted in terms of the detail: "Spending on services drove the rise, up 1.0 per cent driven by Other services including Digital streaming services and Travel agency and tour services. Health services also contributed with higher spending on dental services.
- This was partly offset by a fall in spending on goods, down 0.3 per cent, driven by drops in Purchase of motor vehicles and Recreation and Culture goods." Discretionary spending was up 0.1% in the month.
- Other data out today showed the Jan trade balance at A$2631mn, versus a A$3800 forecast. Exports fell 0.9%m/m, after a 0.9% gain in Dec. Imports were up 0.8%m/m.
Fig 1: Australia Household Spend Y/Y (White Line) & Consumption Growth Y/Y
Source: Bloomberg Finance L.P./MNI
NEW ZEALAND: Q4 Building Volume Work Falls, Below Forecasts, Q3 Rise Revised
New Zealand Q4 volume of buildings work fell -3.1%q/q, against a 1.9% forecast rise. The prior Q3 outcome was revised down to a 0.2% rise, originally reported as a 1.5% gain. The level of building work volume is now back to mid 2020 levels, although the rate of decline in y/y terms is moderating. We printed at -4.8%, from -6.7% prior for this series. At the margin, lack of upside momentum in the construction side of the economy should give the RBNZ confidence around core inflation pressures remaining contained. We will get more partials for NZ Q4 GDP next Thursday, when manufacturing activity is due. Note that Q4 GDP prints on March 19.
- Weakness was in both residential construction, down 1.1%, and non-residential construction, which fell by 6.5%/q/q.
BONDS: NZGBS: Solidly Cheaper Despite Solid Demand At Weekly Supply Auctions
NZGBs closed 4-5bps cheaper, tracking global bonds. The NZ-US 10-year yield differential was unchanged on the day. Cash US tsys are flat to 2bps cheaper in today’s Asia-Pac session.
- Today’s weekly supply auctions drew strong demand, with cover ratios ranging from 3.58x (May-35) to 4.98x (may-31).
- (Bloomberg) “The number of New Zealanders moving to Australia is at its highest level in 12 years, with about 41,000 people making the move last year. Australia is the top destination for New Zealand migrants, with higher pay and stronger career prospects being a major draw, and the wage gap between the two countries is significant. The exodus of New Zealanders to Australia has become a major political issue ahead of New Zealand's general election, with opposition leader Chris Hipkins tying the departures to high living costs and limited opportunity at home."
- Swap rates closed 4-5bps higher.
- RBNZ-dated OIS pricing closed firmer across meetings. No tightening is priced for April, while December 2026 assigns 38bps.
- Tomorrow, the local calendar will be empty and will remain so until next Thursday release of Q4 Mfg Activity data.
Bloomberg Finance LP
FOREX: USD - BBDXY Finds Bids Below 1200 On First Attempt
The BBDXY has had a range today of 1198.47 - 1202.28 in the Asia-Pac session; it is currently trading around 1202, +0.20%. The BBDXY has seen quite a reversal from above 1210 and presents as an ugly bearish shadow on the daily chart. The market is looking at everything through rose tinted glasses and the way risk trades expects the conflict to be short and the Straits back open similarly and up and running. I am not so optimistic and feel the USD is central to how risk unfolds from here. On the day, I suspect dips could now be supported with the first buy-zone back toward 1197-1198 and then 1191-1194. Bulls will be looking for demand to return down here to form a base of sorts from which to retest the 1210-1215 area.
- EUR/USD - Asian range 1.1609-1.1647, Asia is currently trading 1.1610. The pair drifted higher after finding some demand below 1.1600 but its bounce has been pretty underwhelming considering the moves seen elsewhere. The price action does not look great for the bulls and I suspect rallies will now be faded as the market eyes a move back toward the 1.1400-1.1500 area. On the day, the first sell-zone is back toward 1.1650-1.1680 and then the 1.1750 area, looking for the move lower to now build for a potential test of the pivotal 1.1400-1.1500 support. CFTC Data shows asset managers are very long the EUR and this move could potentially get them to start paring back some of that exposure.
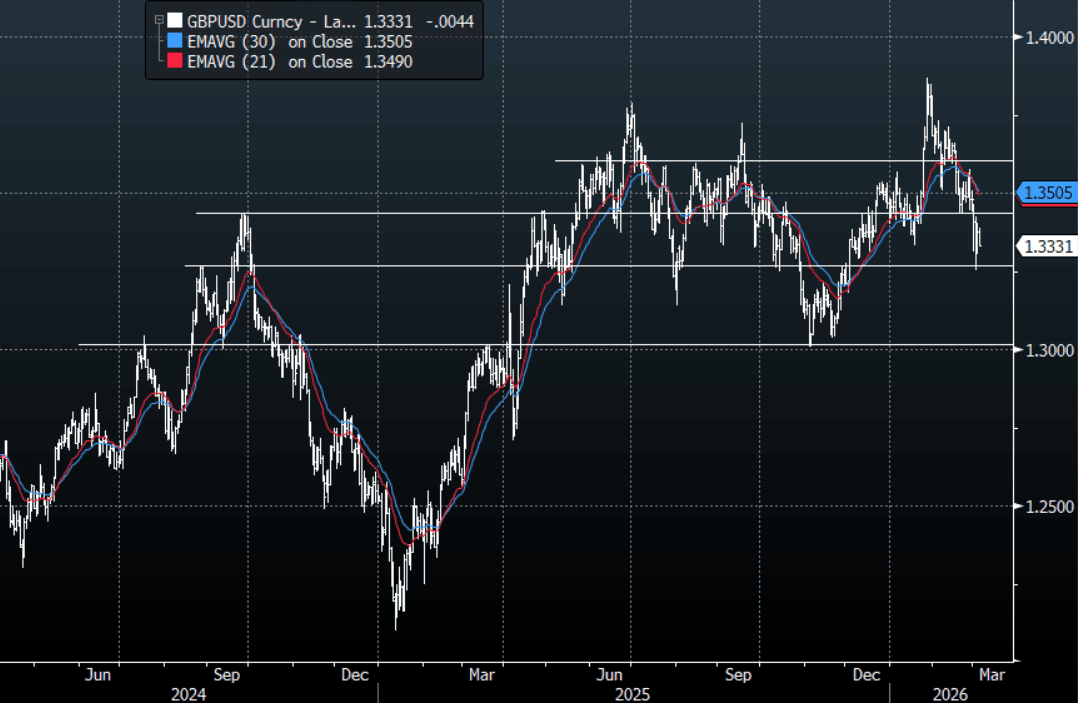
- GBP/USD - Asian range 1.3330-1.3387, Asia is currently dealing around 1.3335. GBP looks like it is now trying to put a top in place. It really needs to close below the pivotal 1.3300 area to confirm but I suspect rallies could now be faded. On the day, I suspect rallies toward 1.3400-1.3450 will continue to be faded as the USD looks to build on its gains. Sellers will be looking for the 1.3300 area to give way, signaling a potential move back to 1.3000.
- Cross asset : SPX -0.20%, Gold $5180, US 10-Year 4.11%, BBDXY 1202, Crude Oil $77.40
- Data/Events : France Jan. Industrial Production, Germany Feb. Construction PMI, ECB’s Guindos speaks, Italy Jan. Retail Sales, ECB’s Rehn speaks, Bundesbank’s Nagel presents 2025 annual report, US Feb. Challenger Job Cuts, US Weekly Initial Jobless Claims, ECB’s Lagarde speaks, The ECB publishes accounts of its last meeting.
Fig 1: GBP/USD Spot Daily Chart
Source: MNI - Market News/Bloomberg Finance L.P
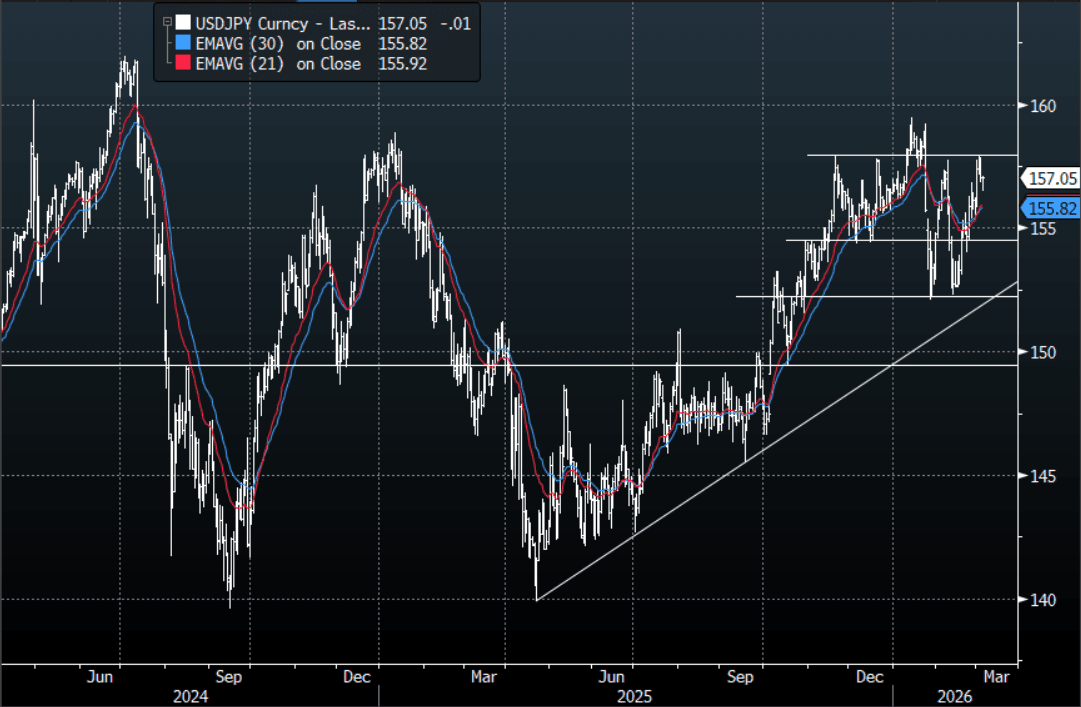
JPY: USD/JPY - Finds Demand Around 156.50 And Reverses Early Losses
The USD/JPY range today has been 156.46-157.12 in the Asia-Pac session, it is currently trading around 157.05 back where it opened. The pair found solid demand in the 156.50 area and has reversed all its early Asian losses. The pair is still looking to re-challenge the 158.00 area. A break above 158.00 and the market will again be looking toward the 160.00 area and then beyond, the jaw-boning by officials has started to increase and for the moment the market is wary but you can only cry wolf so many times and eventually they will need to act for the market to stop doubting them. Personally I don’t see them coming in when the USD has been so bid and I suspect it would need levels above 160-162 to force them to come in. On the day, the first support is back toward 156.50 and then the 155.00-155.50 area.
- MNI AU - Japan Offshore Inflows Continue Into Local Bonds & Stocks: Offshore investors continue to shift funds into both Japan bonds and equities, continuing recent trends.
- “China set its annual economic growth goal at a range of 4.5% to 5%, the least ambitious expansion target since 1991. Separately, Beijing told the country’s largest oil refiners to suspend exports of diesel and gasoline.” - BBG
- Options : Close significant option expiries for NY cut, based on DTCC data: 157.00($1.04b). Upcoming Close Strikes : 153.25($1.27b March 6), 155.00($1.49b March 9), 156.40($869m March 6) - BBG.
- The USD/JPY Average True Range(ATR) for the last 10 Trading days: 116 Points
Fig 1 : USD/JPY Spot Daily Chart
Source: MNI - Market News/Bloomberg Finance L.P
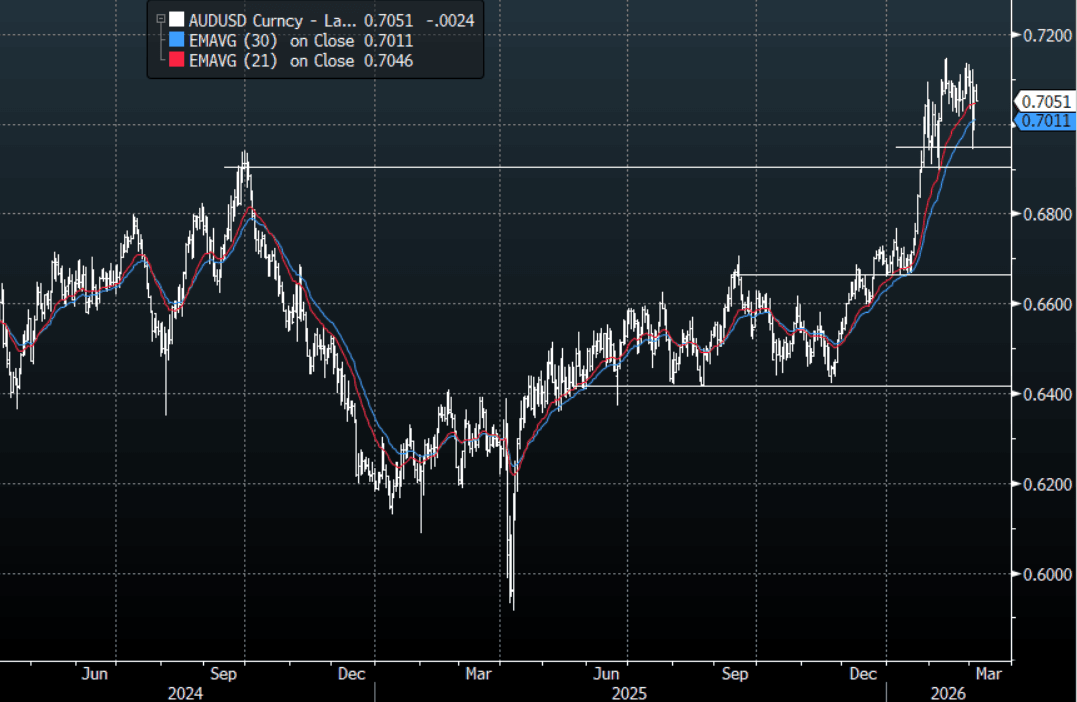
AUD/USD - Stalls Toward 0.7100 & Drifts Lower As Oil Moves Higher
The AUD/USD has had a range today of 0.7049-0.7089 in the Asia- Pac session, it is currently trading around 0.7050,-0.35%. The AUD has stalled toward 0.7100 and drifted lower as Oil moved up on reports of a tanker being hit off Kuwait and risk topping out. Still an Amazing comeback by risk in the current environment, I still remain wary though and would probably be skewed to fading rallies until we see an end to the conflict or the Strait of Hormuz being fully opened. On the day, I would be looking for sellers to return in the 0.7100-0.7120 area looking for risk to come back under pressure at some point. A sustained close back above 0.7120-0.7140 would see the downward pressure negated and the upward trend would likely be resumed.
- MNI AU - AU Jan Household Spending Lower Forecast, Y/Y Back Under 5%: Australia household spend for Jan was a little weaker than forecast. Spending appears to be moderating but from reasonable levels. The RBA is unlikely to be concerned and it may not prevent another rate hike, given still elevated inflation pressures and a tight labour market.
- MNI: Behind-Curve RBA To Wait Till May Before Hike-Ex Staffers. The Reserve Bank of Australia is likely to wait until May before lifting its cash rate from 3.85%, but could consider a larger 50-basis-point increase if the Iran conflict pushes oil prices higher and feeds into first-quarter CPI, especially with inflation already above the target band, former officials told MNI, warning that repeated forecast misses combined with an energy shock risk de-anchoring inflation expectations.
- Options : Closest significant option expiries for NY cut, based on DTCC data: 0.6950(AUD943m), 0.7000(AUD1.5b), 0.7150(AUD1.38b). Upcoming Close Strikes : 0.7000(AUD957m Mar 9), 0.7050(AUD687m Mar 6) - BBG
- The AUD/USD Average True Range for the last 10 Trading days: 88 Points
Fig 1: AUD/USD spot Daily Chart
Source: MNI - Market News/Bloomberg Finance L.P
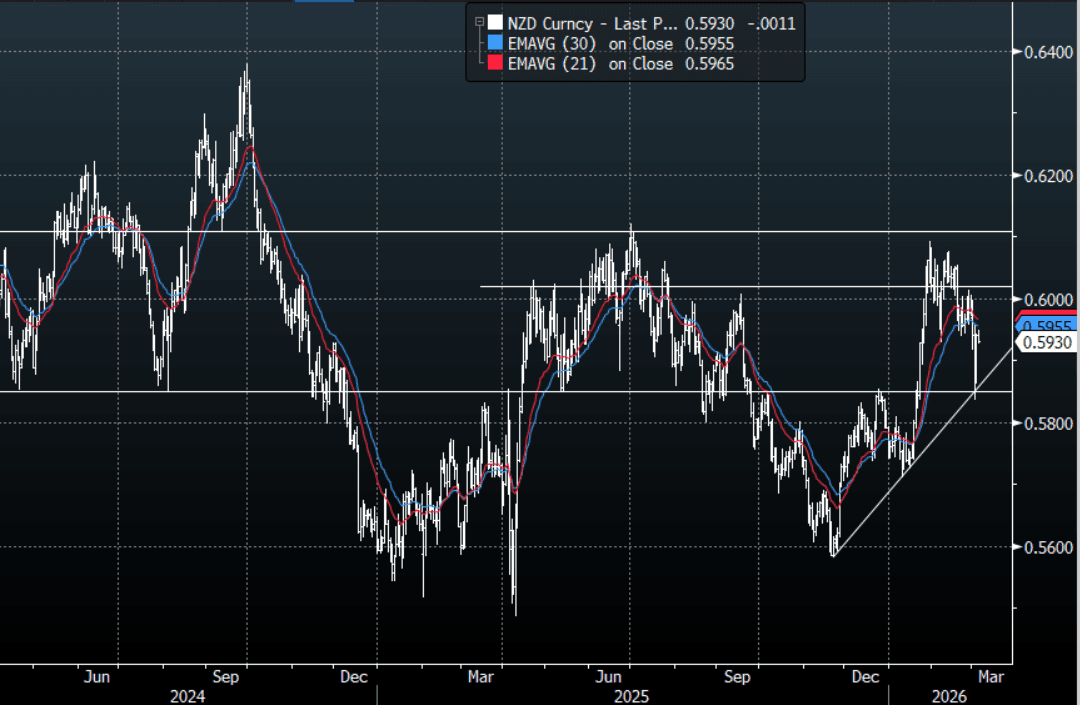
NZD/USD - Drifts Lower From 0.5950, Albeit Back Within Its Range
The NZD/USD had a range today of 0.5926-0.5940 in the Asia-Pac session, it is currently trading around 0.5930, -0.17%. The NZD has drifted lower in Asia as the USD finds a bid on the bump up in oil. The NZD is again back into its 0.5885-0.6015 range after a false break lower, I would still be skewed to fading rallies while below 0.6005-0.6025. On the day, I suspect sellers could return back toward the 0.5965-0.5995 area, looking for the pair to move lower at some point. As mentioned though a break back above 0.6025 would be problematic for the bears.
- MNI AU - NZ Q4 Building Volume Work Falls, Below Forecasts, Q3 Rise Revised: At the margin, lack of upside momentum in the construction side of the economy should give the RBNZ confidence around core inflation pressures remaining contained. We will get more partials for NZ Q4 GDP next Thursday, when manufacturing activity is due. Note that Q4 GDP prints on March 19.
- MNI AU - NZ House Prices Edge Up In Feb But Still Negative Y/Y: The RBNZ noted at its last policy meeting the lack of house price recovery in this cycle, and that the consumption recovery would have to be aided more so by labour income (as opposed to improving housing wealth, like we have seen in previous cycles).
- Options : Closest significant option expiries for NY cut, based on DTCC data: 0.5950(NZD924m). Upcoming Close Strikes : 0.6000(NZD322m March 6) - BBG
- The NZD/USD Average True Range for the last 10 Trading days: 68 Points
Fig 1: NZD/USD Spot Daily Chart
Source: MNI - Market News/Bloomberg Finance L.P
ASIA STOCKS: Offshore Dip Buyers For South Korea, Mostly Outflows Elsewhere
For South Korea, Taiwan, and India, net equity outflows are comfortably negative for the past 5-trading days. Interestingly though, offshore investors were net buyers yesterday in South Korea, with markets plunging sharply. We have seen modest further inflows today, per the NBUY function on BBG, with just under $320mn in further inflows. This comes as onshore markets rebound sharply today (+9% for the Kospi), although we are still well off end Feb highs. Recall that offshore outflows were very strong from South Korea through to end Feb, over $8bn, post the LNY break. Hence there was scope yesterday to come back into South Korea's market (to take advantage of the dip).
- Taiwan's net inflows for 2026 to date have been pared back considerably, with just over $6.6bn in net outflows for the past 5 trading days. The Taiex is rebounding today, although has considerably lower volatility compared to South Korean markets.
- The recovery in Indian inflow momentum also looks in jeopardy from the oil price shock, which has pushed local equities to fresh multi month lows.
- In South East Asian markets, flow trends have been more muted in the past few sessions. There have been signs of outflows, but only Malaysia has a negative sum for the past 5 trading days.
Table 1: Asian Markets Net Equity Flows
| Yesterday | Past 5 Trading Days | 2026 To Date | |
| South Korea (USDmn) | 957 | -8142 | -15356 |
| Taiwan (USDmn) | -2727 | -6602 | 3515 |
| India (USDmn)* | -327 | -758 | -1899 |
| Indonesia (USDmn) | -7 | 138 | -409 |
| Thailand (USDmn) | 32 | 86 | 1895 |
| Malaysia (USDmn) | -57 | -34 | 374 |
| Philippines (USDmn) | -22 | 25 | 361 |
| Total (USDmn) | -2150 | -15286 | -11519 |
| * Data Up To Mar 2 |
Source: Bloomberg Finance L.P./MNI
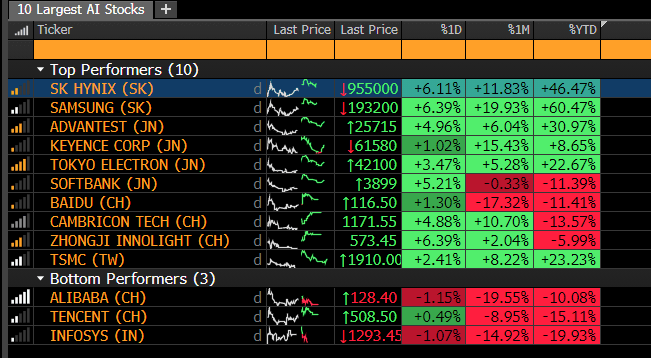
ASIA STOCKS: Wall Steet Lead and AI Bounce Boosts Stocks
Asian equity markets staged a broad-based recovery, rebounding from a multi-day sell-off triggered by Middle East hostilities. Sentiment was bolstered by overnight gains on Wall Street and a temporary stabilization in oil prices following U.S. efforts to secure Persian Gulf flows. Comments from regulators/central banks and key ministers helped to bolster risk appetite, supporting gains.
AI stocks bounced back heavily towo with the 9 out the 10 largest AI stocks in Asia posting gains - supporting their domestic returns.
The KOSPI led the region with a massive 12% surge in the morning, largely recouping a record loss from the previous session before profit takers emerged. Program trading was briefly suspended due to high volatility with the index looking to finish over 10% higher. Key AI stocks SK Hynix and Samsung delivered strong gains but remain down following falls earlier.
The NIKKEI is up +2.5% Thursday in a broad-based day of gains, thanks to the lead in from Wall Street overnight. Banks led the way on better US sentiment following stronger than expected economic data.
In mainland China, technology and power companies led gains (e.g., Biwin Storage +12%; ZhongJI Innolight +6.3%) following government pledges in the 15th Five-Year Plan to boost local innovation and high-tech sectors. Headlines from the NPC see a modest revision downward in GDP forecast to 4.5 - 5.0% as expected, whilst bond issuance targets were confirmed. Local press reports suggest a RRR cut is the most likely policy change in the short term.
Oil Supply Lines Severly Tested, Brent Eyes $85 bbl
- After a slow start to the trading day, oil prices rallied significantly; leaving investors scratching their heads as to the latest catalyst.
- With constant news flow from the ongoing conflict hitting screens pointing to one particular news item is difficult. The reality is at present almost all news items are pointing to supply challenges, or the re-shaping of global supply chains.
- China’s government has told the country’s largest oil refiners to suspend exports of diesel and gasoline as an escalating conflict in the Persian Gulf disrupts the arrival of crude from one of the world’s largest producing regions.
- UK Maritime Operations reports an oil tanker near Kuwait reported a large port side explosion, with a small craft leaving shortly after.
- Hostilities have widened beyond the Persian Gulf after a U.S. submarine reportedly sank an Iranian warship near Sri Lanka, an event described by U.S. officials as the first such attack on an enemy since World War II.
- A bulk carrier signaled it was Chinese-owned as it transited the Strait of Hormuz this week, highlighting how vessels are trying to ensure safe passage through the waterway during the war in the Middle East.
- Iraq has begun shutting down production at giant southern oil fields like Rumaila (approx. 460,000 bpd) due to overflowing storage, while QatarEnergy declared force majeure on LNG exports after suspending production at key facilities.
- WTI is nearing intra-day highs at US$77.29 bbl for gains of +3.5%
- Brent has gained +2.9% today to reach US$83.82 bbl
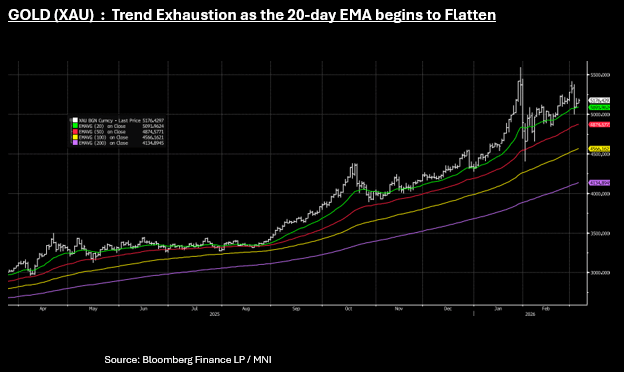
Gold Up; Though Momentum Weak as $5,200 Test Holds
- Gold prices regained upward momentum in Asia today, rising 0.75% to trade near US$5,178.
- Spot was higher from the open reaching US$5,194 per ounce but gave back some of those gains in the afternoon session as it failed its latest attempt at $5,200.
- $5,200 remains a key technical resistance in the short term for gold, having broken above it briefly at the beginning of the month, but ultimately couldn't sustain above.
- Prices continue to trend near to the 20-day EMA - which whilst upward sloping still, shows signs of trend exhaustion. When a 20-day EMA flattens, price tends to "yo-yo" or whip back and forth across the line, making it less reliable indicator and risks a volatility squeeze.
- Intensifying geopolitical conflict between the United States and Iran drove a flight to safety, marking gold's further gains though the technical backdrop makes the outlook less certain with pull backs more prevalent than for most of 2025.
CHINA: Headlines from NPC : Issuance May Point to RRR Cut
- As headlines start to trickle out of the NPC, a reduction in growth target is one of the key changes.
- 2025 growth target was 'around 5%' with 2026 now 4.5% - 5.0%; whilst keeping 2026-2030 in 'reasonable range.'
- CPI growth target is 'around 2%' (currently 0.2%)
- Aims are to create 12m urban jobs in 2026.
- Budget deficit of 4% of GDP - no change from last year.
- Bonds issuance: CNY4.4tn of new special local government bonds and CNY1.3tn of ultra long special sovereign bonds.
- China plans the slowest rise in defence spending since 2022 at 7%.
- Investment from investment from Central Government budget CNY755bn
The news particularly around the new bond issuance likely predicates the RRR cut of 50bps to absorp the issuance
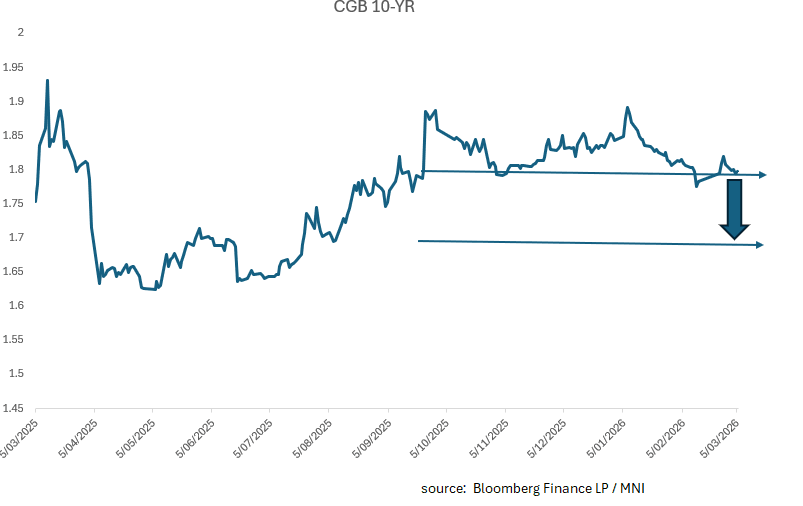
CHINA: NPC Announcements in Line, Yields to Reset Recent Ranges
- A reduction in the GDP target to 4.5 -5.0% and confirmation of the CNY4.4tn of new special local government bonds and CNY1.3tn of ultra long special sovereign bonds did little to impact the China bond markets Thursday.
- China bond futures are modestly lower today whilst the 10-Yr CGB consolidates below 1.80% at 1.79%
- The reduction in growth from 'around 5%' in 2025 to 4.5-5.0% in 2026 is consistent with the messages from authorities over recent months, and represents a consistent outlook for policy.
- Expectations are growing for a RRR cut of 50bps which would release up to CNY1tn of liquidity into the system, helping absorb the new issuance.
- In 2026 it is estimated that approximately CNY50tn of higher yielding CDs are maturing for banks, which will ultimately lower their cost of funding and make government bond investments more attractive. Coupled with this is the planned 'seed money' from the Ministry of Finance to help banks boost Tier 1 capital and support balance sheets.
- This suggests a stronger demand profile from banks in the year ahead for bonds and could see the 10-Yr reset it's range to 1.70-1.80%. The 10-Yr has traded in a 1.80 - 1.90% range since September 2025.
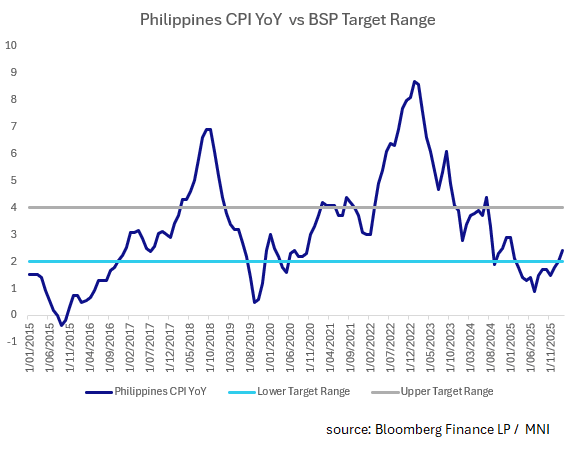
PHILIPPINES: February CPI Up as Base Effects Fade
- For the first time in a year, Philippines CPI moved above the bottom end of BSP range of 2.00%.
- February saw a rise in consumer prices of +2.4% YoY, from +2.0% in January.
- Core CPI rose to +2.9% YoY
- Prices in the capital rosee +1.9% YoY
- MoM inflation was softer than expected at +0.2% (est. +0.3%, prior +0.8%)
- At the last monetary policy meeting on 19 February 2026, Bangko Sentral ng Pilipinas (BSP) Governor Remolona described inflation as "manageable" despite a projected "slight uptick" later in the year. Remolona noted that any immediate rise in inflation is driven primarily by supply-side factors, which are viewed as temporary. The BSP's risk-adjusted inflation forecast for 2026 was revised upward to 3.6% (from 3.1%), partly due to higher global oil and rice prices. Inflation is expected to move closer to the central bank's 3.0% midpoint target by 2027. The Governor emphasised that inflation expectations remain "well anchored", providing the bank with flexibility to ease rates.
- Following the 19 February 2026 meeting, Governor Eli M. Remolona, Jr. indicated the bank's intent to reach a neutral rate—the theoretical level that neither stimulates nor restricts the economy—but emphasized doing so "smoothly" to avoid reigniting inflation. Future moves toward a fully neutral stance depend on inflation remaining within the 2.0%–4.0% target range.
- The BSP does not meet again until 23 April.
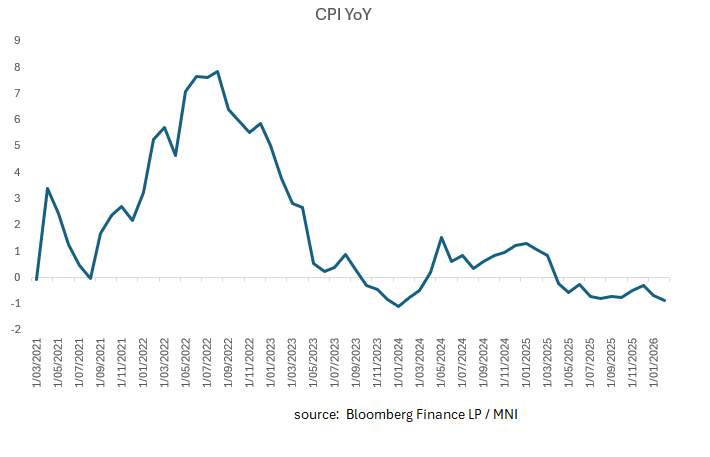
THAILAND: CPI Miss Has BoT With Limited Policy Options
- Thailand's February CPI YoY turned more negative than forecast as the pace of deflation increases.
- CPI in February declined -0.88% from -0.66% prior with officials making statements upon release suggesting the Middle East conflict will see upward pressure in March.
- The continued deflation is attributed to government-subsidized utility prices (electricity and water) and lower energy costs. This marks the 10th consecutive month of negative inflation.
- This leaves the BoT with limited options now with rates at 1.00% as it awaits government policy to drive growth.
- BBG has reported that authorities were reviewing the CPI structure in early 2026 due to concerns that it was not accurately reflecting actual household costs
ASIA FX: USD/Asia Dips Supported In North East Asia, As Oil Rises
In North East Asia FX markets, USD/KRW dips under 1460 have been supported, while USD/CNH was tracking lower, aided by the CNY fixing, but sits back unchanged now (last near 6.8950). USD/TWD is under 31.70, after making fresh highs of 31.78 yesterday (back to May of last year). USD/HKD spot is edging a little higher, but remains under 7.8200, as it continues to recover from Tuesday's sharp pullback to 7.8000. Equity markets are higher throughout the region, rebounding from yesterday, but the continued rise in oil prices, is an offset to this better risk mood.
- There have been a host of headlines emanating out of China as the National People's Congress gets underway. Growth is seen 4.5-5.0% range for 2026, (from around 5% last year). Via our China policy team, it reflects changing dynamics in China's economy and the external environment, as well as a balance between necessity and feasibility. Policy accommodation is expected to continue, while fiscal policy looks similar to last year.
- USD/CNH didn't react much as the headlines crosses, while the USD/CNY fixing fell to 6.9007, fresh lows back to 2023. USD/CNH saw a brief dip under 6.8800, but we are now back around 6.8950, little changed for the session. Moves above 6.9300 are drawing selling interest, while the CNY basket tracker is just off recent highs.
- Spot USD/KRW got to 1455.70 in the first part of trade, but we have steadily recovered since, last 1466/67. We may chop around this 1460/80 region, until the risk picture becomes clearer (and/or oil prices lose some risk premium). Onshore equities have surged, largely recouping yesterday's plunge (the Kospi is up 11%, but still sub end Feb levels).
- USD/TWD is holding at 31.68, so under Wednesday highs of 31.78, but still within striking distance of a move back towards 32.00.
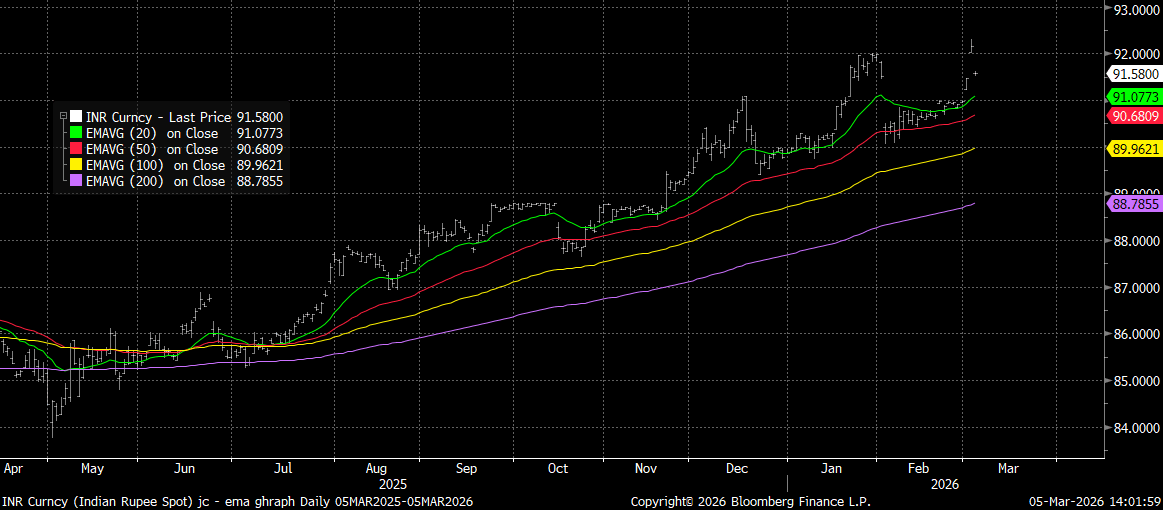
INR: USD/INR Pulls Back Sharply On Suspected Intervention, Still Above Key EMAs
Spot USD/INR is sharply lower in the first part of Thursday trade, with the pair back to 91.55/60, with suspected RBI intervention driving the move. Highs from Wednesday trade were at 92.3050 (before closing at 92.15). The pair remains comfortably above its key EMA support points, with the 20-day back around 91.08, while the 50-day is further south at 90.68, see the chart below. Since the middle of last year, dips under these support points have ultimately proven to be buying opportunities in the pair.
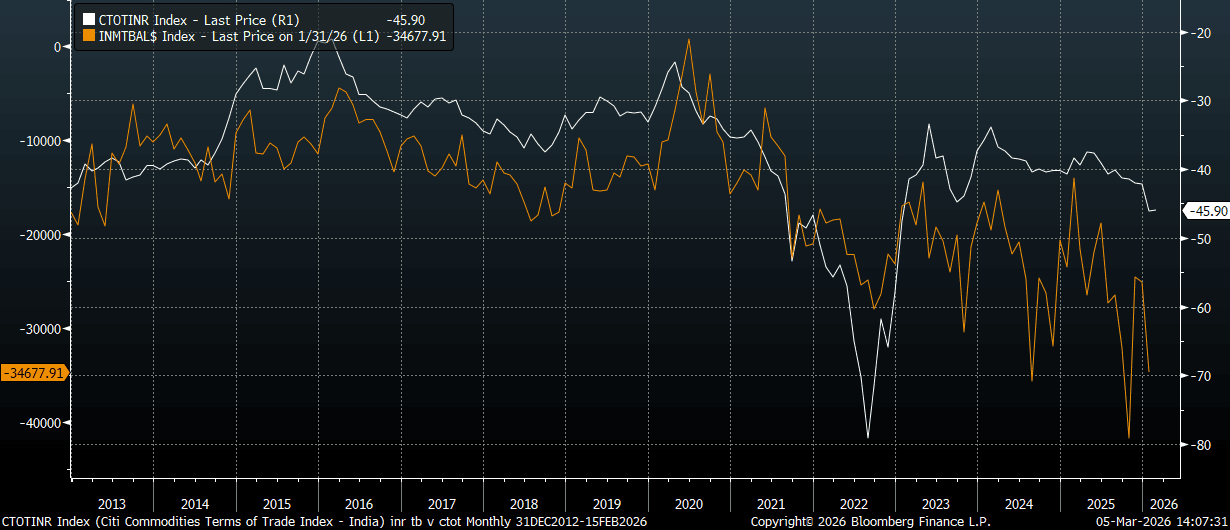
- The Citi INR terms of trade proxy is just up from fresh lows back to early 2023, see the second chart below (the ToT proxy is the white, the trade balance is the orange line). The trade balance is noticeably worse since early 2023, although the first parts of the year tend to be better from a seasonality standpoint on the trade balance front.
- Equity sentiment is more stable today, but we are just up from multi month lows. Offshore investors have been net sellers of local stocks since the start of the month.
Fig 1: USD/INR Spot Versus Key EMAs
Source: Bloomberg Finance L.P./MNI
Fig 2: India Trade Balance & Citi INR Terms Of Trade Proxy
Source: Bloomberg Finance L.P./MNI
UP TODAY (TIMES GMT/LOCAL)
| Date | GMT/Local | Impact | Country | Event |
| 05/03/2026 | 0700/0800 | *** | Flash Inflation Report | |
| 05/03/2026 | 0700/0800 | *** | Flash Inflation Report | |
| 05/03/2026 | 0745/0845 | * | Industrial Production | |
| 05/03/2026 | 0800/0900 | ** | Industrial Production | |
| 05/03/2026 | 0800/0900 | ** | Unemployment | |
| 05/03/2026 | 0830/0930 | ** | S&P Global Final Italy Construction PMI | |
| 05/03/2026 | 0830/0930 | ** | S&P Global Final Germany Construction PMI | |
| 05/03/2026 | 0830/0930 | ** | S&P Global Final Eurozone Construction PMI | |
| 05/03/2026 | 0850/0950 | ECB de Guindos in Conversation at IIF European Investment Summit | ||
| 05/03/2026 | 0900/1000 | * | Retail Sales | |
| 05/03/2026 | 0930/0930 | ** | S&P Global/CIPS Construction PMI | |
| 05/03/2026 | 0930/0930 | *** | BOE Decision Making Panel | |
| 05/03/2026 | 1000/1100 | ** | EZ Retail Sales | |
| 05/03/2026 | 1000/1000 | ** | Gilt Outright Auction Result | |
| 05/03/2026 | - | National People's Congress | ||
| 05/03/2026 | 1330/0830 | ** | WASDE Weekly Import/Export | |
| 05/03/2026 | 1330/0830 | *** | Jobless Claims | |
| 05/03/2026 | 1330/0830 | ** | Import/Export Price Index | |
| 05/03/2026 | 1330/0830 | ** | Preliminary Non-Farm Productivity | |
| 05/03/2026 | 1530/1030 | ** | Natural Gas Stocks | |
| 05/03/2026 | 1630/1130 | * | US Bill 08 Week Treasury Auction Result | |
| 05/03/2026 | 1630/1130 | ** | US Bill 04 Week Treasury Auction Result | |
| 05/03/2026 | 1700/1800 | ECB Lagarde Lecture on Global Risk | ||
| 05/03/2026 | 1815/1315 | Fed's Michelle Bowman | ||
| 06/03/2026 | 0700/0800 | ** | Manufacturing Orders | |
| 06/03/2026 | 1000/1100 | *** | EZ GDP 3rd (Regular) | |
| 06/03/2026 | 1000/1100 | ECB Lagarde Lecture at Politecnico di Milano | ||
| 06/03/2026 | 1330/0830 | *** | Employment Report | |
| 06/03/2026 | 1330/0830 | *** | Employment Report | |
| 06/03/2026 | 1330/0830 | *** | Employment Report | |
| 06/03/2026 | 1330/0830 | *** | Employment Report | |
| 06/03/2026 | 1330/0830 | *** | Employment Report | |
| 06/03/2026 | 1330/0830 | *** | Employment Report | |
| 06/03/2026 | 1330/0830 | *** | Employment Report | |
| 06/03/2026 | 1330/0830 | *** | Employment Report | |
| 06/03/2026 | 1330/1430 | ECB Cipollone Presentation at European Banking Federation Meeting | ||
| 06/03/2026 | 1330/0830 | *** | Retail Sales | |
| 06/03/2026 | 1330/0830 | *** | Retail Sales |