AUSTRALIA DATA: Jan Household Spending Lower Forecast, Y/Y Back Under 5%
Australia household spend for Jan was a little weaker than forecast. The m/m print rose 0.3%m/m versus 0.4% forecast, while the Dec outcome was to a -0.5% fall (after originally reported as a -0.4% decline). This saw the y/y outcome print at 4.6%, versus 5.1% forecast and 5.0% prior. This comes after yesterday's national accounts, which showed some slowing in household consumption growth. The chart below plots this measure in y/y terms (orange line), versus today's update household spending print for Jan (in y/y terms, the white line). Spending appears to be moderating but from reasonable levels. The RBA is unlikely to be concerned and it may not prevent another rate hike, given still elevated inflation pressures and a tight labour market.
- The ABS noted in terms of the detail: "Spending on services drove the rise, up 1.0 per cent driven by Other services including Digital streaming services and Travel agency and tour services. Health services also contributed with higher spending on dental services.
- This was partly offset by a fall in spending on goods, down 0.3 per cent, driven by drops in Purchase of motor vehicles and Recreation and Culture goods." Discretionary spending was up 0.1% in the month.
- Other data out today showed the Jan trade balance at A$2631mn, versus a A$3800 forecast. Exports fell 0.9%m/m, after a 0.9% gain in Dec. Imports were up 0.8%m/m.
Fig 1: Australia Household Spend Y/Y (White Line) & Consumption Growth Y/Y
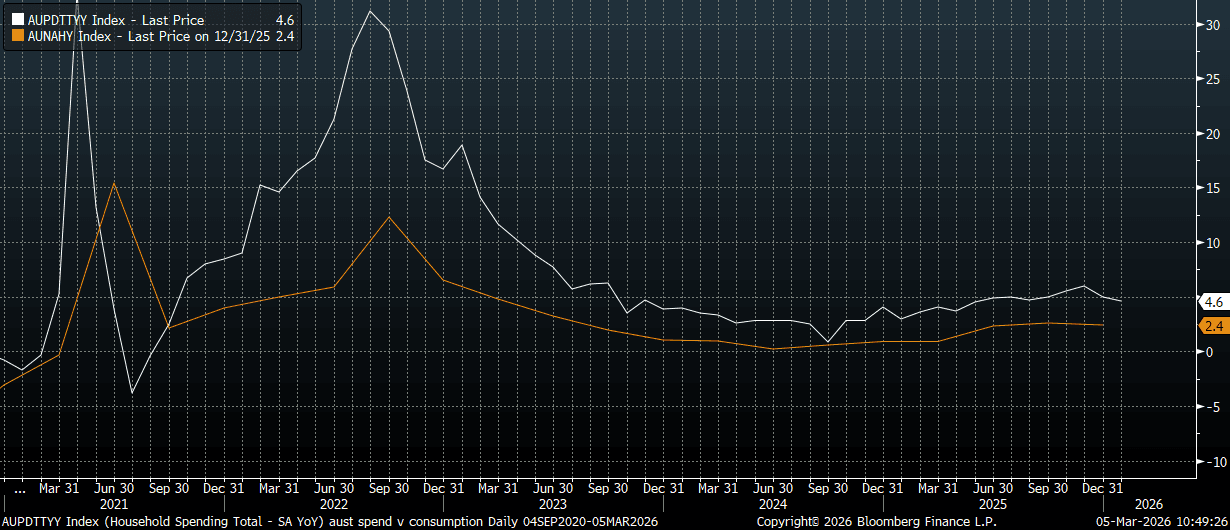
Source: Bloomberg Finance L.P./MNI
Want to read more?
Find more articles and bullets on these widgets:
Historical bullets
STIR: RBA-Dated OIS Pricing Has Firmed Sharply Since Dec’s Jobs Data (22 Jan)
RBA-dated OIS pricing has firmed by around 11–21bps across meetings since the release of December’s stronger-than-expected labour market data on 22 January.
- Employment rose by 65.2k m/m in December (vs +27k expected), following a revised -28.7k in November. The unemployment rate fell to 4.1% (vs 4.3% expected) from 4.3%.
- Last week’s firmer-than-expected Q4 trimmed mean CPI print (3.4% y/y vs 3.3% expected) reinforced the repricing ahead of tomorrow’s RBA policy decision.
- OIS now reflects materially tighter policy expectations across the curve. A 25bp hike today is priced at a 75% probability (up from 32% pre-jobs), with cumulative tightening probability of 163% by June (vs 88% pre-jobs) and 232% by December 2026 (vs 152% pre-jobs).
Figure 1: RBA-Dated OIS – Current Vs. Pre-Jobs
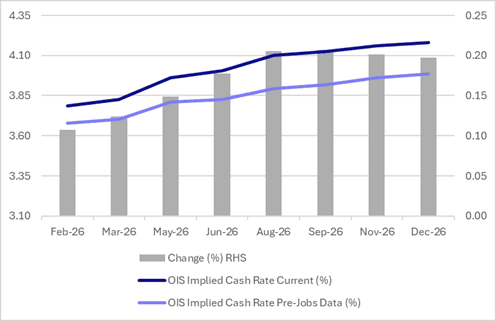
Source: Bloomberg Finance LP / MNI
USD: BBDXY - Holds Above 1190 As US Data Surprises
The BBDXY range overnight was 1187.02 - 1193.19, Asia is currently trading around 1190. Risk has had an impressive turnaround thanks to a very strong US ISM Man PMI. What's interesting about the USD price action is that recently this type of price action would have seen the USD give back most of its recent gains, but it continues to hold above 1190, near its highs for now, is this telling us something or is it just lagging? I suspect that bounces will continue to find sellers in the short-term as the USD still has few friends. On the day, the first resistance remains in the 1190-1195 area and then more importantly back towards 1200 where I suspect sellers would return in earnest.
- MNI INTERVIEW: Fed To Keep Cutting On Jobs Weakness - Tilley. A weak labor market and improving inflation will prompt the Federal Reserve to keep cutting interest rates at its next few meetings, former Philadephia Fed officer and economic adviser Luke Tilley told MNI.
- Daniel Lacalle commented on X regarding Xi Jinping’s call for the renminbi to become a global reserve currency: “You cannot have a world reserve currency and a currency fixing with capital controls.”
- The Market Ear on X: “Surging U.S. economic surprises just exposed late dollar shorts.” See Graph Below.
- The BBDXY Average True Range for the last 10 Trading days: 690 Points
Fig 1: US Economic Surprise Vs USD
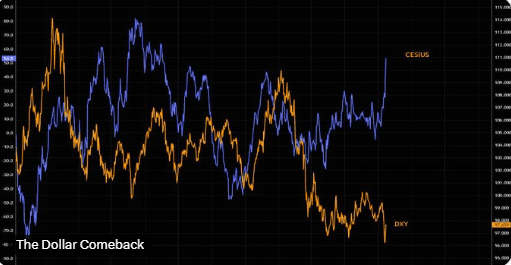
Source: MNI - Market News/Bloomberg Finance L.P/@themarketear
ASIA STOCKS: Risk Off Drive Near $6bn In Outflows From SK/Taiwan Since Friday
There has been a cumulative near $6bn in offshore outflows from South Korean and Taiwan equities over the past two trading sessions (last Friday and yesterday). This has pushed South Korea back into year to date outflows for 2026, while Taiwan is only modestly positive over the same time frame. The risk off kicked off with the Warsh announcement as nominated Fed Chair, while the collapse in metal prices sparked broader risk aversion. This may have contributed to selling pressure in markets like South Korea and Taiwan which have benefited from the tech/AI led global equity rally. Sentiment stabilized overnight in US and EU markets (aided by better US ISM data), while metals are rebounding in the first part of Tuesday trade. The Kospi has re-opened strongly, last around 4.4% higher, to near 5170, but this under recent cycle highs from end Jan.
- Elsewhere, India flows will be in focus after the US and India reached a trade agreement to lower reciprocal tariff rates to 18% from 25%. Indian equities sit comfortably off earlier 2026 highs, while year to date has seen just over $3.2bn in net outflows.
- In South East Asia, flows have been relatively muted in the past 5 trading days. The bias has been for Indonesian outflows, as MSCI index concerns has seen a number of sell-side analysts cut Indonesia's rating to either neutral or underweight from an equity market standpoint.
Table 1: Asian Markets Net Equity Flows
| Yesterday | Past 5 Trading Days | 2026 To Date | |
| South Korea (USDmn) | -1451 | -2689 | -1008 |
| Taiwan (USDmn) | -1398 | -832 | 411 |
| India (USDmn)* | 207 | 301 | -3260 |
| Indonesia (USDmn) | 39 | -831 | -550 |
| Thailand (USDmn) | -9 | 40 | 131 |
| Malaysia (USDmn) | -32 | -64 | 259 |
| Philippines (USDmn) | 5 | 132 | 231 |
| Total (USDmn) | -2639 | -3941 | -3786 |
| * Data Up To Jan 30 |
Source: Bloomberg Finance L.P./MNI