MNI EUROPEAN MARKETS ANALYSIS: Yen Rebound Continues
EXECUTIVE SUMMARY
- JGBs have performed better than feared by some investors after the elections, while USD/JPY continues to retrace lower. Re-assuring words from the Japan FinMin today helped sentiment.
- ACGBs are stronger after decline in latest consumer and business confidence measures.
- AUD and NZD are both down 0.25%, as precious metals give back some of the recent gains seen. Stocks in Japan continue to lead today following the election result and optimism over the economy.
- Looking ahead, US retail sales data headlines Tuesday’s calendar, while markets will then swiftly turn their focus to US employment (Wed) and US CPI (Fri).
MARKETS
US TSYS: USTs Take Lead from JGBs, Yields Below Mid Point of 1M Range
USTs have followed the lead of JGBs in thin markets with gains Tuesday ahead of the NFP. Yields are down 1-2bps across the curve with curve movement limited. Bond futures' moves are muted with the 10-Yr up +02 at 112-08.
- The 2-Yr is down -1.2bps at 3.477%
- The 5-Yr is down -1.4bps at 3.732%
- The 10-Yr is down -1.6bps at 4.188%
- The 30-Yr is down -1.9bps at 4.841%
Ahead of the NFP markets get the ADP employment change (prior 7.750k), import / export price index (useful guide for future inflation expectations) and retail sales.
There is a US$90bn 6-week bill auction and a US$58bn 3-Yr bond auction tonight as key focus. Bid to cover on last 3-Yr auction was 2.65x
US yields have shown sensitivity to jobs data of late, making this week's NFP an increasingly important release for the next catalyst for yields.
JGBS: Unwinding Of Post-Election Sell-Off Continues
JGB futures are stronger, +43 compared to settlement levels, and at session bests on a data-light day.
- Cash US tsys are 1-2bps richer, with a flattening bias, in today's Asia-Pac session.
- Wednesday sees an unusual BLS nonfarm payrolls report after a brief delay following last week's government shutdown, with January details released at 0830ET. The report will need to be assessed holistically rather than focusing on any single number, although the unemployment rate should offer the cleanest single take. Consensus looks for a circa 70k increase in nonfarm payrolls coming almost entirely from private payrolls. (See MNI US Payroll Preview here)
- The local calendar will also see Machine Tool Orders data later.
- "Japanese bonds are performing better than feared by some investors after the elections, partly because there is a delay to the sales tax cut, which had been flagged ahead of the vote." - BBG
- Cash JGBs are 2-4bps richer across benchmarks, with the futures-linked 7-year once again leading. The benchmark 10-year yield is 2.8bps lower at 2.261% versus the cycle high of 2.359%.
- Swap rates are flat to 2bp richer, with a flattening bias.
- Tomorrow, the local calendar will see PPI and Tokyo Avg Office Vacancies data.
AUSSIE BONDS: Richer After Declines In Confidence, Strong May-41 Auction
ACGBs (YM +3.5 & XM +5.0) are stronger and at session highs after today’s confidence data drop.
- Australia’s Westpac consumer sentiment slipped in February after the RBA hiked its key interest rate to tame inflation. The sentiment fell to 90.5 points, with pessimists outweighing optimists. A separate survey from NAB showed business conditions declined while confidence remained below its long-run average.
- Cash US tsys are 1-2bps richer, with a flattening bias, in today's Asia-Pac session.
- Cash ACGBs are 4-5bps richer with the AU-US 10-year yield differential at +63bps.
- The latest ACGB May-41 supply auction continued the recent trend of firm pricing, with the weighted average yield printing 0.81bps through prevailing mids. Moreover, the cover ratio increased to 4.9500x from 3.2500x at the prior outing.
- The AOFM also plans to sell A$700mn of the 3.75% 21 April 2037 bond on Wednesday and A$1000mn of the 2.50% 21 May 2030 bond on Friday.
- The bills strip has bull-flattened, with pricing flat to +5.
- RBA-dated OIS pricing shows tightening across all meetings, with the probability of a 25bp hike rising from 14% for March to 91% by June and 151% by December 2026.
- Tomorrow, the local calendar will see Home Loan data alongside RBA's Hauser-Fireside Chat.
Bloomberg Finance LP
AUSTRALIA DATA: Consumer Sentiment Falls, Household Spending May Soften Further
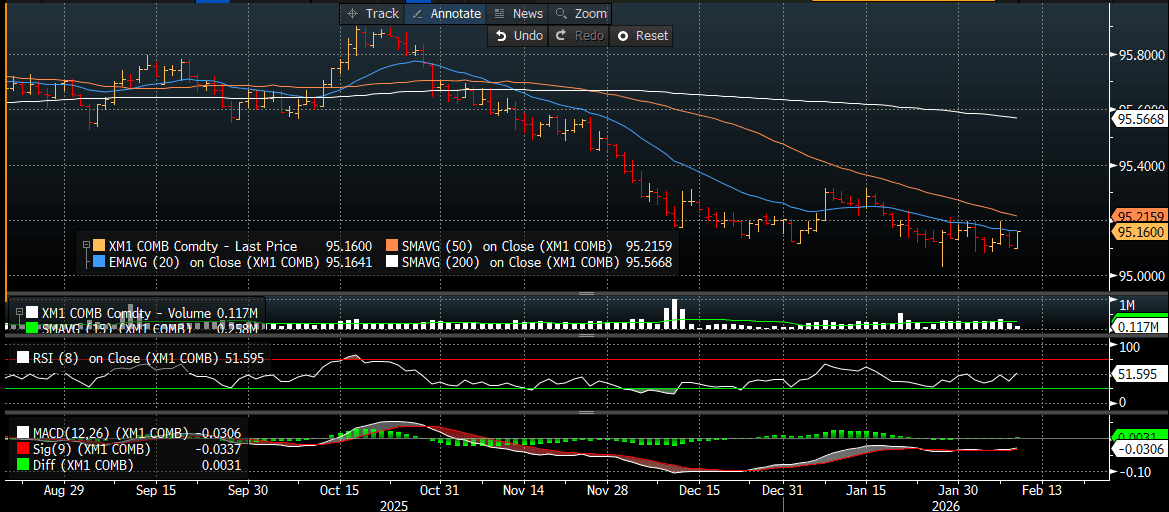
The Feb Westpac Consumer Sentiment Index print fell 2.6% to 90.5 (from 92.9). This puts the index back close to lows from 2025, and comfortably off Nov highs of 103.8. The index spent a lot of late 2022 to late 2024 in a rough 80-85 region, so we remain above these levels. The chart below plots the consumer sentiment reading against the Australian household spending measure, y/y (which came yesterday and moderated to 5%y/y). The m/m correlation between the two series' is soft but the general trends can follow each other. Spending started to improve as sentiment lifted late in 2024 from very depressed levels. The move off recent highs for sentiment points to some downside risks in household spending, but arguably the RBA needs this to aid the return of inflation to target.
- Westpac notes in terms of today's result: "Muted response compared to previous rate hikes. Current conditions and medium term outlook weaken; year-ahead views stable. Over 80% expect interest rates to rise further in the next 12 months."
- It adds: "The RBA has already signalled that the volatility of the new monthly CPI means it will continue to focus more closely on the quarterly price data, particularly for trimmed mean inflation. With the next quarterly update due in late April likely to show inflation still uncomfortably high, this points to the next 25bp rate hike coming in May."
Fig 1: Westpac Consumer Sentiment Index & Household Spending Y/Y
Source: Westpac/Bloomberg Finance L.P./MNI
AUSTRALIA DATA: Business Conditions Ease, Trend Steady, Labour Costs Lower
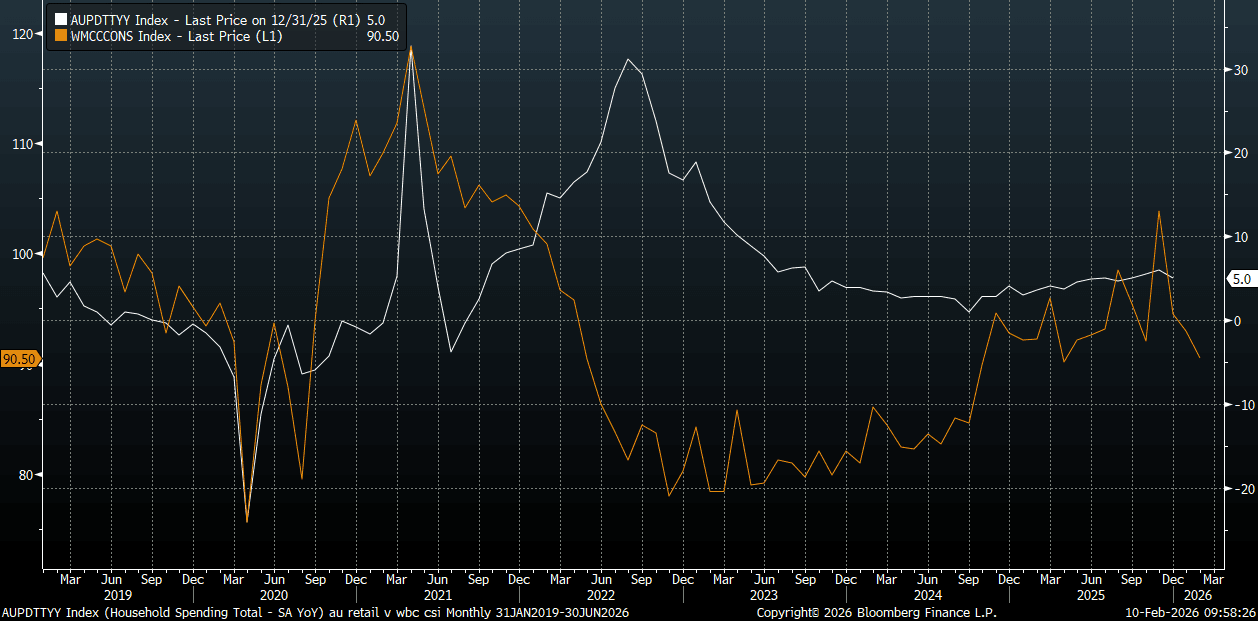
The Australia Jan NAB business survey saw conditions moderate to +7 from +9 in Dec last year. Business Confidence was at +3 for Jan, slightly up from a revised +2 reading for Dec last year. The conditions index, which has a reasonably relationship with GDP y/y (see the chart below, the NAB conditions index is the the white line), has largely gone sideways since the middle of last year. It is still suggesting better y/y growth momentum, but to be confident in expecting growth beyond +3%y/y.
- We might need to see the conditions index trending above +10 for a number of months. This is not what the latest RBA projections show. The central bank has GDP y/y edging up to 1.8% in Q4 last year before slowing to 1.6y/y and then staying there for the rest of the forecast horizon.
- The longer average for y/y growth is around 2.3%, but the RBA projections imply a need for softer growth momentum to aid the inflation return to target.
- In terms of the detail of the NAB survey, the trading and profitability sub-indices eased. Employment was steady at +5, while labour costs moderated to 1.3% from 1.7% prior. This is a soft result and looks to be the weakest since 2021.
Fig 1: Australian NAB Business Conditions Index & Australian GDP y/y
Source: NAB/Bloomberg Finance L.P./MNI
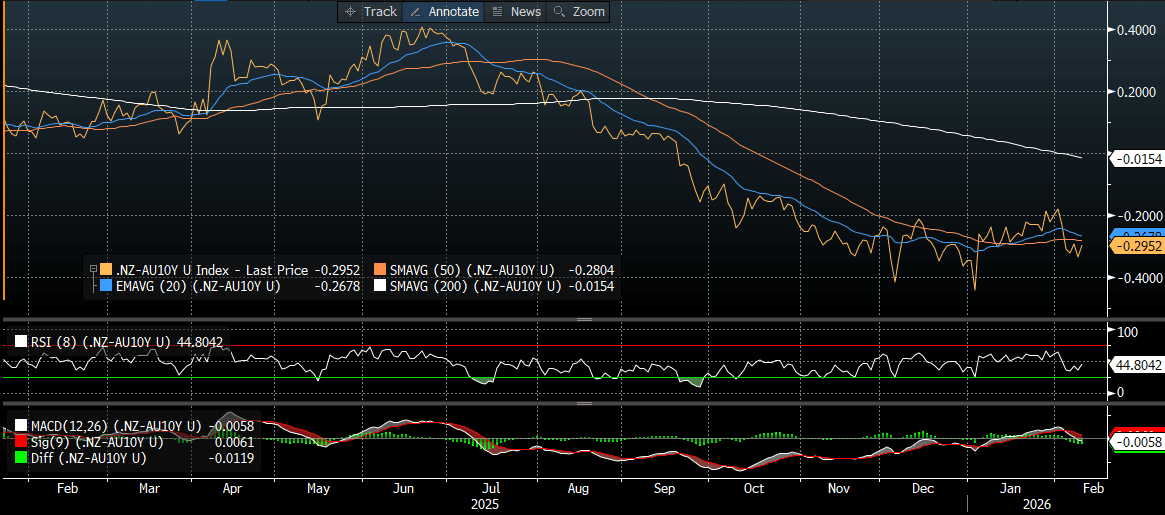
BONDS: NZGBS: Subdued Trading, Underperforms $-Bloc Markets
NZGBs closed slightly richer across benchmarks after a subdued data-light session.
- NZGBs did, however, underperform their $-bloc counterparts, with the NZ-US and NZ-AU 10-year yield differentials 3-4bps wider.
- Cash US tsys are 1-2bps richer, with a flattening bias, in today's Asia-Pac session.
- (MT Newswires) NZ’s total new lending increased to NZ$20.1 billion in December 2025 from NZ$12.79 billion in November 2025, according to RBNZ data.
- Swap rates closed little changed.
- RBNZ-dated OIS pricing closed little changed across meetings. No tightening is priced for February, while December 2026 assigns 44bps.
- Tomorrow, the local calendar will be empty. The local calendar will be light until Friday's release of BusinessNZ Manufacturing PMI, Net Migration and RBNZ Inflation Expectation data.
- On Thursday, the NZ Treasury plans to sell NZ$250mn of the 1.50% May-31 bond and NZ$200mn of the 4.5% May-35 bond.
Bloomberg Finance LP
FOREX: A$ Backs Away From 0.7100 Test, BBDXY Struggles Amidst Yen Gains
The main focus in the G10 space has been a further retracement in USD/JPY, although higher beta FX has given some of the recent gains seen. AUD and NZD are both down 0.25-0.30%. Some retracement in the precious metals rally has likely been a headwind for both currencies. Gold is down around 0.65%, while silver is off a little over 2.5%. AUD/USD has stopped short of a test above 0.7100, with an option expiry at this figure level for NY cut later as well. AUD/USD was last 0.7070/75, NZD/USD in the 0.6035/40 region. The BBDXY index did try to rally in first part of trade but once USD/JPY rolled over it struggled. We were last 1182.6 for the index, little changed for the session (earlier highs were at 1184.46).
- On the data front, the main focus has been on Australian survey measures with both the Westpac consumer sentiment and NAB business surveys released. Consumer sentiment fell, although Westpac noted the response was more muted compared to earlier rate hikes. NAB business conditions eased, but have largely trended sideways since the middle of last year.
- Both measures point to some downside risks to growth momentum, but the RBA arguably needs this help bring inflation back into the target band.
- US equity futures are a touch softer, while US yields are drifting lower (which has likely help cap USD upside). AUD/JPY is back under 110.00, but still above all key EMAs.
- There have been little shifts elsewhere, outside of some weakness in NOK and SEK. EUR/USD has hovered just above 1.1900, while GBP/USD remains sub 1.3700, which capped upside late in Monday trade.
- Looking ahead, US retail sales data headlines Tuesday’s calendar, while markets will then swiftly turn their focus to US employment (Wed) and US CPI (Fri).
JPY: USD/JPY Continues To Unwind Pre-Election Rally, Yield Differentials Lower
USD/JPY sit near 155.25/30 in latest dealings, around 0.40% stronger in yen terms for the session so far. Earlier lows were at 155.15. The market continues to fade upticks post the weekend election, with earlier highs today at 156.29. A case of the LDP victory priced into some degree, along with positive soundbites so far from Japan officials, has likely aided the move. The FinMin stating today there is no plans to extend the tax cut beyond two years and that a variety of options are being looked at to fund it (with focus on avoiding fresh JGB issuance).
- USD/JPY is back under the 20 and 50-day EMAs, but still above recent lows. 154.55/152.10 the low from Feb 2 and low from Jan 27 (and the bear trigger) are likely to be key downside focus points.
- If we can see concerns around the domestic policy outlook in Japan subside further, USD/JPY may realign itself more with yield differentials, which remain in a steep downtrend. The chart below plots USD/JPY versus the US-JP 2yr and 10-yr swap rate differentials.
- Helping sentiment for yen at the margins today has also been a softer precious metals backdrop, with gold and silver giving back some of the respective recent gains. AUD and NZD are both off around 0.20-0.25% at this stage. AUD/JPY is back under 110.00, but still above all key EMAs (the 20-day is near 108.11).
- Looking ahead, the local data calendar is empty tomorrow. We do have payrolls in the US tomorrow evening, a likely key driver of the near term rates outlook in the US.
Fig 1: USD/JPY Spot Versus US-JP Swap Rate Differentials
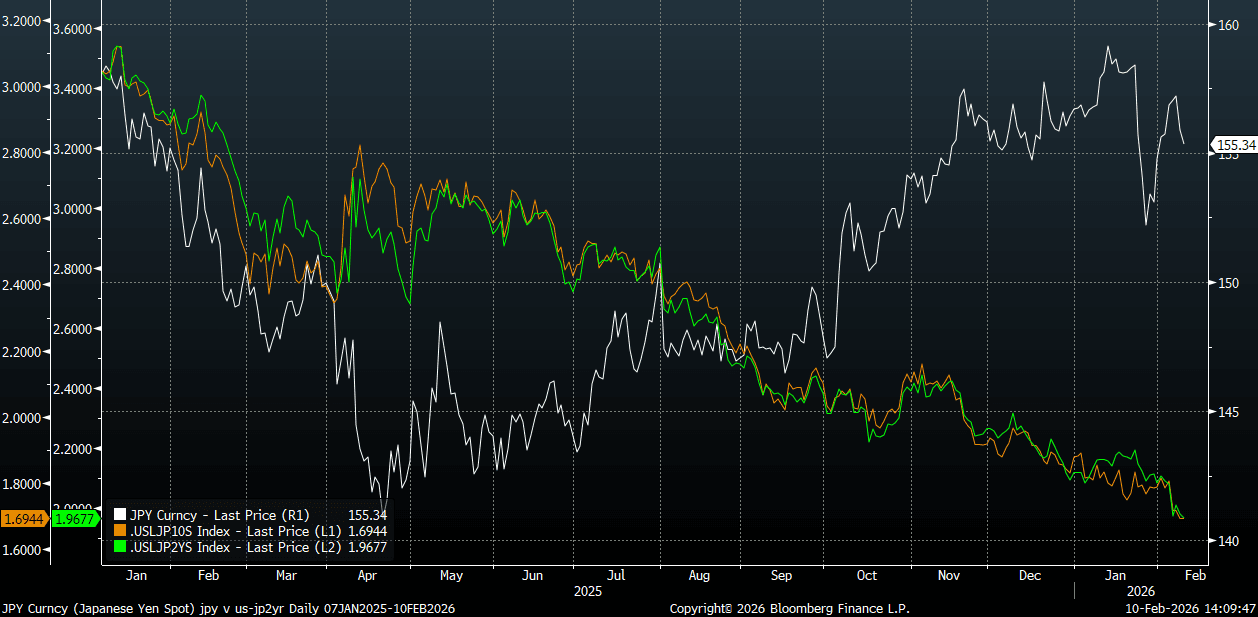
Source: Bloomberg Finance L.P./MNI
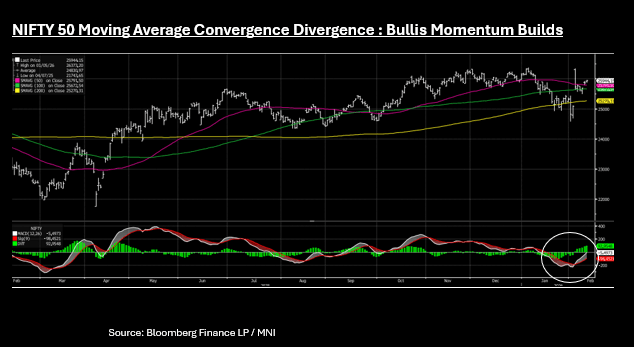
ASIA STOCKS: Japan Effect Sees Regional Gains, NIFTY 50 Strong Uptrend Building
- Stocks in Japan continue to lead today following the election result and optimism over the economy. Investors are pricing in the PMs "Sanaenomics" agenda, which includes a ¥21 trillion stimulus package, potential tax relief (suspending the 8% sales tax on food), and increased defense and AI spending. The ongoing earnings season has exceeded expectations. Heavyweights like SoftBank Group saw shares spike over 10% today after upgrading full-year forecasts. Other major gainers include Furukawa Electric (+22%) and NEC, which announced a significant share buyback. This momentum is supported by structural reforms that have raised Japan's average Return on Equity expectations significantly. This sees the NKY up +2.3% today and nearly 7% in the last three trading days.
- The Japan effect lifted regional bourses with all major indexes up . China was more subdued to modest gains as markets start to wind down ahead of the upcoming holidays and the KOSPI rose by just +0.10%.
- Despite news that FTSE Russell are following the lead by MSCI, the Jakarta Composite brushed off these further concerns with a second day of gains, up +1.1% today.
- India's NIFTY 50 is +0.30% and continues to deliver solid daily gains. Since the announcement of the US trade deal, the NIFTY 50 has gained almost 5% to be near 26,000 again. The bullish momentum is strong for the NIFTY 50 according to the MACD analysis. The short term exponential average is significantly longer than the long term suggesting a strong uptrend is building for the index.
OIL: A Neutral Bias Leaves Oil Exposed to US Iran Headlines
- As the planned meeting between President Trump and Israeli PM Netanyahu draws near analysts globally are looking for clues for possible outcomes. The United States and Israel most recently conducted a large-scale bombing campaign against Iran in June 2025, an event often referred to as the Twelve-Day War. Israel stated the strikes were a "last-resort effort" to prevent Iran from acquiring nuclear weapons and to neutralize the threat of annihilation. President Trump stated the intervention was for "collective self-defense" of Israel and to "eliminate Iran's nuclear program" after a 60-day negotiation deadline expired without an agreement.
- As of February 2026, Israeli Prime Minister Benjamin Netanyahu's stance is that Israel is prepared to go to war with Iran if it crosses specific "red lines" regarding its nuclear and ballistic missile programs. While he has publicly stated a desire to avoid a "war of attrition," his administration is actively preparing for potential unilateral military action (source Times of Israel)
- It is difficult to see compromise coming from the meeting as momentum indicators turn neutral for WTI and Brent at present, making them more vulnerable to geopolitical headlines. US Warships have arrived in the Middle East as a counter to the talks with Tehran, reminding them that military strikes are possible.
- WTI has traded in tight range of $63.87 - $64.50 and is down -0.25% today to US$64.20 after strong gains overnight.
- Brent has traded in a tight range of $68.44 - $69.07 and is currently at US$68.94bbl, down -0.14%
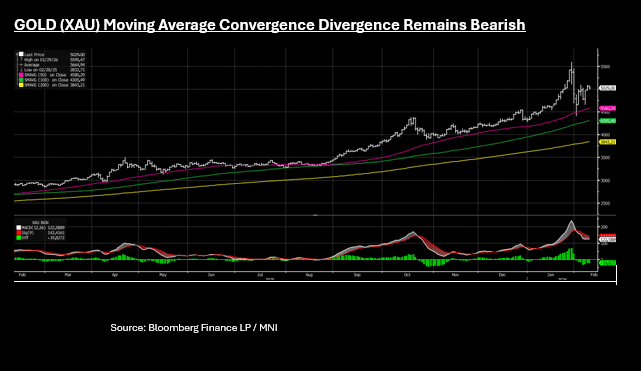
Gold Lacks Momentum; Gives Back O/N Gains
- Despite strong overnight moves, gold gave back some of those in the Asian trading day suggesting that the one way positive bias for the precious metal may not have returned yet.
- Different momentum indicators are providing alternate backdrops for gold with the 14-day relative strength relatively neutral whilst the MACD (white line) remains below the Signal (red line) suggesting that downward trend still remains for gold. What this does suggest is that the volatility may still elevated for now, as the market continues to adjust following the volatility.
- Gold opened the Asia trading day at US$5,067 and has traded in a range of $4,987 - $5,076. Currently it is at US$5,025 a fall of -0.63%
- China's biggest metal miner Zijin Mining, raised its targeted gold output nearly a third by 2028, as prices of the precious metal remain elevated. Mined gold output will rise to between 130 to 140 tons over the next three years, the Fujian-based miner said in exchange filings on Monday. (per BBG)
- ETFs have seen a fifth consecutive day of declines in gold and silver holdings as the fall out from recent volatility continues.
SOUTH KOREA: JGB Correlations Rise, Momentum Indicators Remain Bearish
- Correlations with JGBs are strong at the moment with yesterday's falls being taken back Tuesday, following the lead from Tokyo.
- Having finished Monday down -0.26 at 109.88 ( new contract low), the Korean 10-Yr is up +0.64 today; its biggest one day gain for the year.
- The losses yesterday saw the 10-yr near oversold on the 14-day Relative strength only to retreat back towards neutral. However the MACD (white) line remains below the Signal (red) line, suggesting that the bearish downtrend still remains
- Korea's 3-Yr bond future is up up +.14 today to 104.81 after limited moves yesterday.
- Cash is strong also with 3-Yr yields at 3.237 (down -4bps) and 10-Yr at 3.70% (down 4.5bps).
- The reaction to the moves in JGBs in part reflects the limited expectations for monetary policy in the first half of the year, and data releases in line with expectations. This leaves bond investors turning their attention elsewhere for leads as to the direction of KTBs. This could be a problem for the BOK who only in December conducted its first purchase of 5-10-20year government bonds in over three years to halt rising yields whilst the FSC extended a market stabilization programmes through 2026 to include KRW37.6 tn of purchases.
- Bond traders in Korea will now turn their attention to NFP in the US where sensitivities to downside surprises in data are growing.
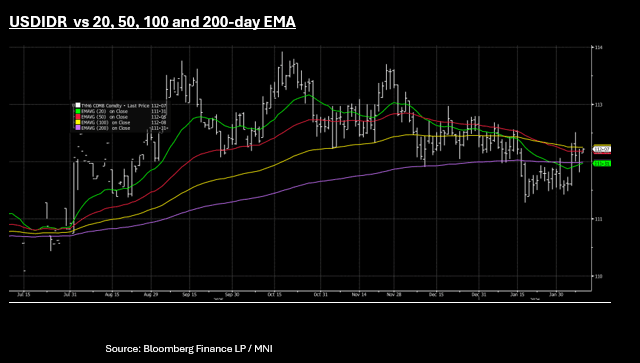
IDR: FTSE Russell HLines Ignored by Broader Strength, USDIDR Down Again
- Late yesterday FTSE Russell stated that it will postpone a review planned for March following feedback from an investment advisory committee considering "adverse turnover and the uncertainty in determining the accurate free float percentages of Indonesian securities." The postponement will result in a freeze of any new inclusions of stocks into its indexes, or any alteration to existing holdings. This comes following the announcement from MSCI of similar actions.
- MSCI and FTSE indexes are widely used as benchmarks for investors and are tracked by billions of dollars in passive funds, meaning their decisions can drive capital flows.
- Markets haven't reacted to this headline, given broader equity strength in the region. The JCI is up +0.70%, as the NKY climbs +2.5% and the HSI up +1.2%
- USDIDR is lower for a second consecutive day and back below the key resistance level of 16,800. USDIDR is down -18 Tuesday at 16,787 for Rupiah gains of +0.9%.
- This takes USDIDR back below the 20-day EMA of 16,808. Downside resistance comes from the 50-day EMA at 16,774 with momentum indicators are broadly neutral.
- The volatility in February has seen INDO 5-Yr CDS higher, though the moves have been modest relative to the falls in equity. From the January lows of +67bps, INDON 5-Yr CDS reached a February high of +80bps, but has moderated back to +76bps since and in line with the 1-Yr average.
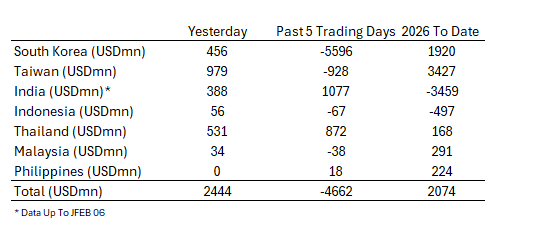
ASIA STOCKS: Strong Inflows Monday on AI lead, Politics in Thailand Stabilize
Foreign equity flows in Asia for February 9 were characterized by a strong "risk-on" sentiment in North Asia, driven by political clarity in Japan and a broader "AI super-cycle". Investors rotated heavily into North Asian tech, particularly Taiwan and South Korea, where names like TSMC, Samsung and SK Hynix have a strong foreign share registry. Global investors increasingly prefer North Asian chipmakers (TW and SK) over broader regional bets, driving record inflows into Asian tech ETFs though this does increase volatility in flows also. After the huge outflows to end last week, this week has started strongly with good inflows.
Foreign portfolio flows in India continue to improve following the US trade deal with the last 5 trading days seeing strong inflows.
Thailand saw its largest one day inflows YTD to kick off the week but the broader 5-day picture points to a more stable outcome with the completion of the election over the weekend, likely to add to that sentiment.
Indonesia's flows are stabilizing as equity volatility subsides following political and transparency concerns.
SINGAPORE: 2026 GDP Forecast Upgrade Adds To MAS Tightening Risks
The final Q4 GDP print for Singapore saw y/y upward revisions to 6.9% (initial estimate was 5.7%, while the market forecast was 6.5%). In q/q terms we printed 2.1%, against an initial 1.9% outcome, but this was below the 2.6% market consensus. Full year growth was 5.0%, after a 4.4% outcome for 2024. The authorities have raised the 2026 growth forecast to 2-4% from 1-3%. Today's outcomes will likely add, at the margin, to market tightening expectations for the MAS in H1 2026.
- The consensus expectation is for growth to be 2.7% in 2026. The past decade has seen annual growth average just over 3.3%.
- The detail for the Q4 print showed very strong conditions in manufacturing, 18.8%y/y, while all sub-industry categories saw positive y/y growth. In q/q terms, retail and transport saw modest falls (after gains in Q3). Manufacturing rose 8.4% in q/q terms, while finance gained 5.4%.
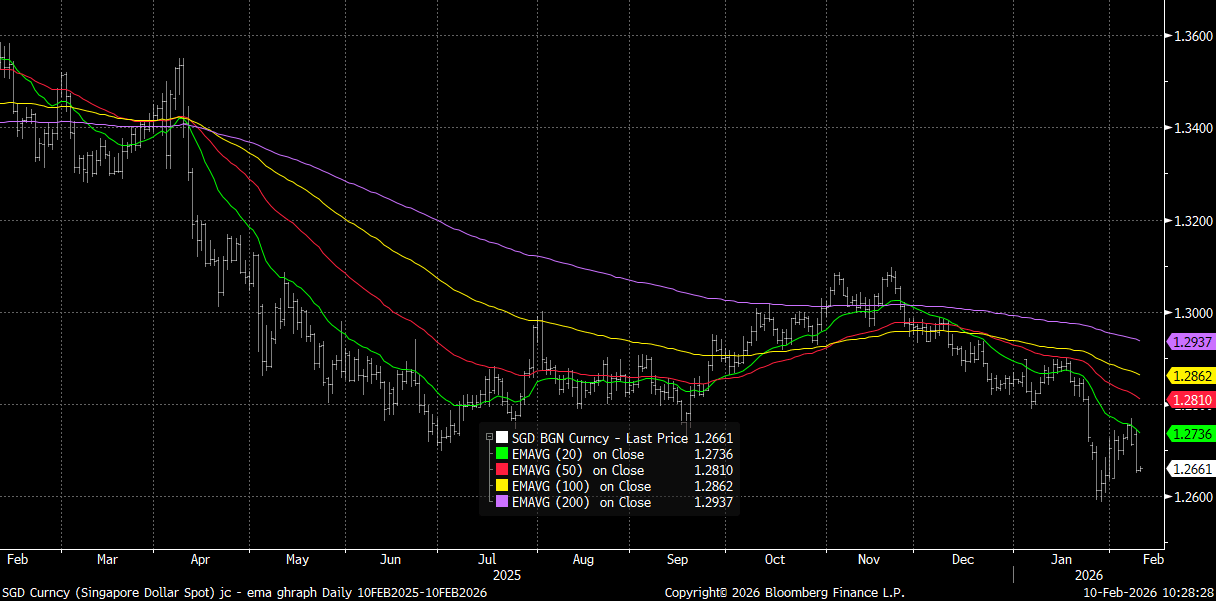
- For USD/SGD (currently near 1.2660), broader downside risks prevail, with moves towards the 20-day EMA capping the upside for now (around 1.2735/40), see the chart below. Downside focus will be on retest under 1.2600, which marked late Jan lows. Broader risk trends look more stable, albeit with a slightly softer start in Tuesday trade.
- The SGD NEER is around -0.38% from the top end of the band, per Goldman Sachs estimates. Given MAS tightening risks, dips are likely to remain supported for this index.
Fig 1: USD/SGD Versus Key EMAs
Source: Bloomberg Finance L.P./MNI
THB: Downside 31.00 Test Still In Focus As Post Election Optimism Continues
USD/THB sits up modestly from earlier lows, last at 31.14. Earlier we got to just under 31.08, so not far off a re-test under the 31.00 level, which marked late Jan lows for the pair. This is a further 0.30% gain in THB today, after yesterday's 1.3% surge. Pre-election highs around 31.80/90, which also coincides with the 100-day EMA resistance point, is a likely topside focus point on any renewed upside in the pair. The near term bias still looks for a lower test, as market sentiment was boosted by the weekend election result. Still, there is caution from some sell-side names on the pair, particularly as we progress further into 2026, given policy efforts to curb THB outperformance (see below).
- The SET index is up a further 0.65% so far today, through 1400, amidst strong offshore inflows (+$500mn yesterday). Indeed Thailand has seen the strongest 2026 YTD inflows within EM Asia markets (ex China). Gold's modest dip so far today isn't impacting THB greatly.
- Goldman Sachs still believes the authorities will look to curb gold outperformance and curb THB outperformance: "we think THB will gradually shift to underperform low-yield Asian FX markets this year, after outperforming peers and market expectations last year. Both the BoT and MoF appear unified in trying to curb THB strength (including trying to de-linking the gold/THB correlation) with some measures already announced (such as limits on online gold trading) and more likely in the pipeline, post the formation of the new government. "
UP TODAY (TIMES GMT/LOCAL)
| Date | GMT/Local | Impact | Country | Event |
| 10/02/2026 | 0700/0800 | ** | Private Sector Production m/m | |
| 10/02/2026 | 0700/0800 | *** | CPI Norway | |
| 10/02/2026 | 1000/1000 | ** | Gilt Outright Auction Result | |
| 10/02/2026 | 1100/0600 | ** | NFIB Small Business Optimism Index | |
| 10/02/2026 | 1200/0700 | ** | Brazil Final CPI | |
| 10/02/2026 | - | *** | New Loans | |
| 10/02/2026 | - | *** | Money Supply | |
| 10/02/2026 | - | *** | Social Financing | |
| 10/02/2026 | 1330/0830 | *** | Employment Cost Index | |
| 10/02/2026 | 1330/0830 | ** | Import/Export Price Index | |
| 10/02/2026 | 1330/0830 | *** | Retail Sales | |
| 10/02/2026 | 1330/0830 | *** | Retail Sales | |
| 10/02/2026 | 1355/0855 | ** | Redbook Retail Sales Index | |
| 10/02/2026 | 1500/1000 | * | Business Inventories | |
| 10/02/2026 | 1500/1000 | * | Business Inventories | |
| 10/02/2026 | 1700/1200 | *** | USDA Crop Estimates - WASDE | |
| 10/02/2026 | 1700/1200 | Cleveland Fed's Beth Hammack | ||
| 10/02/2026 | 1800/1300 | Dallas Fed's Lorie Logan | ||
| 10/02/2026 | 1800/1300 | *** | US Note 03 Year Treasury Auction Result | |
| 11/02/2026 | 0130/0930 | *** | CPI | |
| 11/02/2026 | 0130/0930 | *** | Producer Price Index | |
| 11/02/2026 | 0900/1000 | * | Industrial Production | |
| 11/02/2026 | 1020/1120 | ECB's Cipollone In Digital Finance Conference Fireside Chat | ||
| 11/02/2026 | 1200/0700 | ** | MBA Weekly Applications Index |