MNI EUROPEAN MARKETS ANALYSIS: Most Asia Pac Yields Lower
- BOJ board member Junko Nakagawa on Thursday backed a gradual rate hike but gave no guidance on the timing, citing high uncertainty. JGB futures were weighed by a poor 2yr JGB auction, but recent ranges continue to prevail.
- US 2/10s curve is slightly flatter in Asia, while ACGBs and NZGBs yields tracked lower. FX trends are little changed. Australian Q2 capex was weaker than forecast. NZ data was mixed.
- The BOK held rates as expected. Governor Rhee stated they were continuing to talk with the US Tsy around FX, which provided the won with some support.
- Later the Fed’s Waller speaks on monetary policy. The July ECB meeting accounts are published. The next estimate of US Q2 GDP is released as well as jobless claims, July pending home sales, August Kansas manufacturing and euro area August European Commission survey.
MARKETS
US TSYS: Asia Wrap - Yield Curve Steepener's See Some Profit Taking
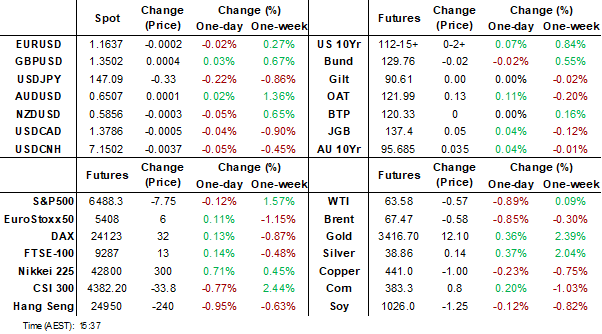
The TYU5 range has been 112-12 to 112-15+ during the Asia-Pacific session. It last changed hands at 112-13+, up 0-00+ from the previous close.
- The US 2-year yield has edged higher trading around 3.62%, up 0.01 from its close.
- The US 10-year yield has edged lower trading around 4.228%, down 0.01 from its close.
- This has seen the yield curve flatten in Asia - 2s10s -1.81 at 60.360, 5s30s -2.23 at 120.024.
- Bloomberg - CBOT Block Trade: 4,000 FV2 Contracts at 109-14 1/4
- 10-Year Yields continue to find buyers towards 4.30%. While the 4.35% area holds, bounces should be met with demand. First target is the recent lows around 4.18% then the bottom of the range towards 4.10% comes back into focus.
- First Squawk on X: “U.S. TREASURY BUYS BACK $1.4B IN DEBT, TAKING TOTAL TO $7.4B OVER PAST TWO WEEKS.”
- Robin Brooks on X: “Between what's happening with the Fed and the crisis over fiscal consolidation in France, we're seeing the perfect storm that may drive longer-term yields a lot higher. The rise in long-term yields is all the more notable because central banks have been cutting rates everywhere.”
- Data/Events: GDP, Initial Jobless Claims, Pending Home Sales, Kansas City Fed Manf. Activity
Fig 1: 10-Year US Yield 2H Chart
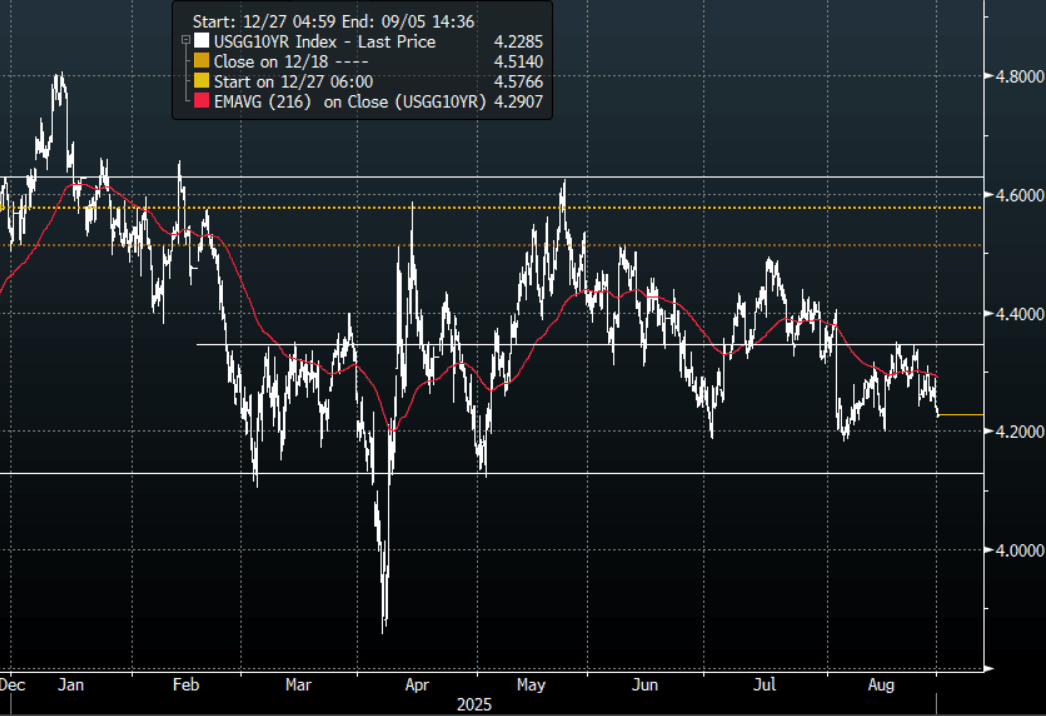
Source: MNI - Market News/Bloomberg Finance L.P
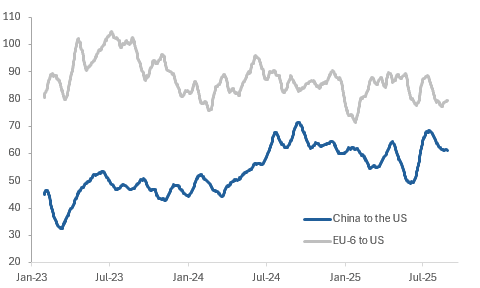
GLOBAL MACRO: Ship Departures To US Stabilise Around Averages
Bloomberg container ship tracking data is showing some stabilisation in the number of vessels leaving for the US suggesting tariffs are yet to weigh on demand. There was an increase in shipments ahead of the April and July US tariff deadlines. There is currently a US-China trade truce, an apparent US-EU deal and an agreed 15% US duty on imports from Japan and South Korea. While many details still need working out in these agreements, the signs of stabilisation in shipping suggest that exporters are less concerned.
Bloomberg container ship count 30-day average
Source: MNI - Market News/Bloomberg Finance L.P.
- Ships leaving for the US from China rose through March and then again through June. The numbers have moderated over July and August but it is more a normalisation with the 30-day average around the historical average to end-January 2025. They have tentatively stabilised.
- Vessels from the six largest EU countries picked up through Q1 and then again in June. They moderated in July and have stabilised in August but the 30-day average is below the historical average by almost 10 vessels.
- Container ships leaving South Korea and Taiwan also stabilised over July with some moderation in August. Both are slightly above average.
- Japan’s departures for the US have been trending lower since end June and that continued in August.
- Official trade data are going to be difficult to interpret in H2 2025 given the frontloading of shipments to the US to beat tariff deadlines in H1.
Bloomberg container ship count 30-day average
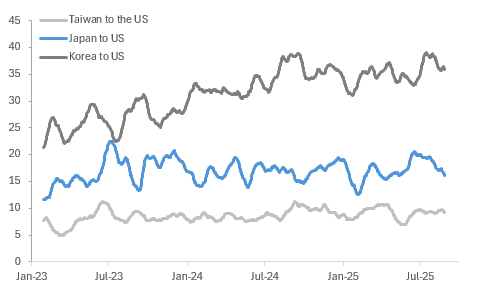
Source: MNI - Market News/Bloomberg Finance L.P.
JGBS: Futures Lower Post Poor 2yr Auction, Ranges Holding, Tokyo CPI Tomorrow
JGB futures sit off session highs, last around 137.40, +.05 versus settlement levels. The poor 2yr auction has weighed post the lunch time break, but support still appears evident under 137.40. Recent August lows at 137.22 also remain intact.
- The 2yr debt auction saw a bid to cover ratio of 2.84, the lowest since 2009. The tail from the auction, the gap between the average and lowest accepted prices, was higher at 0.022, versus 0.005 at the prior auction in late July. Note we have the 10yr debt auction on Sep 2, which is next Tuesday.
- This comes as the BoJ maintains a tightening bias, but uncertainty remains around the next move. Earlier remarks from BoJ board member were fairly balanced. "*BOJ'S NAKAGAWA: TO KEEP RAISING RATES IF OUTLOOK IS MET", via BBG.
- "NAKAGAWA: RESULTS OF THE UPCOMING SEPTEMBER TANKAN WILL ALSO BE VERY IMPORTANT IN EXAMINING THE CHANGES ARISING FROM FACTORS SUCH AS PROGRESS IN TRADE POLICY NEGOTIATIONS" (via RTRS).
- In the cash GB space, yields are up from earlier lows, although the back end is still softer. The 30yr was last around 3.20%, still off 3.5bps for the session. The 10yr was near 1.63%. The front end is little changed, the 2yr near 0.86%.
- Note tomorrow we get a number of monthly data prints. Most focus will be on the August CPI print for Tokyo.
AUSSIE BONDS: Futures Higher, AU-US 10yr Spread Close To Multi Month Highs
Aussie bond futures continue to hold gain, but tight ranges have prevailed. Positive carry over from futures gains in the US and the EU look to be major driver today, while Q2 capex data locally was weaker than expected. 10yr futures (XM) were just off session highs, last 95.68, +3bps, while 3yr futures (YM) were at 96.585, +2bps.
- Cash ACGB yields are close to 3bps lower across the curve, with no standout outperformance. The 3yr yield was last around 3.39%, while the 10yr was near 4.29%. Both these benchmarks sit within recent ranges.
- The AU-US 10yr spread sits slightly lower around +7bps but is within the upper range seen in recent months. We have spent little time above +10bps going back to mid April of this year.
- On the data front, private sector capex remained soft in Q2 with volumes rising 0.2% q/q, driven by the non-mining sector, after falling 0.2% q/q to be up only 1.7% y/y although this was an improvement from Q1’s -0.6% y/y. There has been talk that investment needs to rise in order to see progress on productivity, which has been weak. Q2 GDP is released September 3 with inventories September 1, and net exports and public demand contributions September 2.
- Tomorrow we get July private credit figures.
AUSTRALIA DATA: Private Capex Soft In Q2
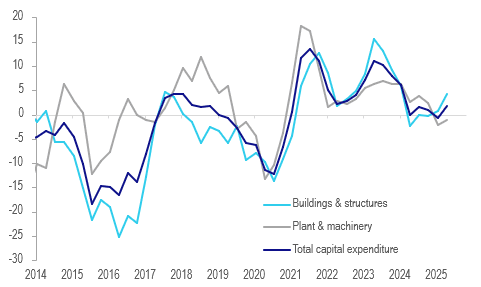
Private sector capex remained soft in Q2 with volumes rising 0.2% q/q, driven by the non-mining sector, after falling 0.2% q/q to be up only 1.7% y/y although this was an improvement from Q1’s -0.6% y/y. There has been talk that investment needs to rise in order to see progress on productivity, which has been weak. Q2 GDP is released September 3 with inventories September 1, and net exports and public demand contributions September 2.
- Private investment in buildings and structures rose 0.2% q/q, the fourth consecutive quarterly rise, to be up 4.3% y/y after 0.6% y/y in Q1. There was growth across transport, warehousing, telecoms and manufacturing.
- Machinery & equipment volumes remained weak rising only 0.3% q/q after two quarterly contractions. It is now down 1.1% y/y after -2.1%. There was strong investment in data centres and retail supply automation.
- Non-mining capex rose 0.9% q/q while mining fell 1.4% q/q with equipment up 0.5% q/q and down 0.8% respectively. Building rose 1.4% q/q and fell 1.6% respectively.
- Capex values are planned to rise over the current financial year with the third estimate revised up 12% with equipment +17.8% and building +8.4%. FY25 saw growth of 3.8%.
Australia real private capital expenditure y/y%
Source: MNI - Market News/ABS
AUSTRALIA: July Inflation Rise Drives “Misery Index” To Highest Since Aug 2024
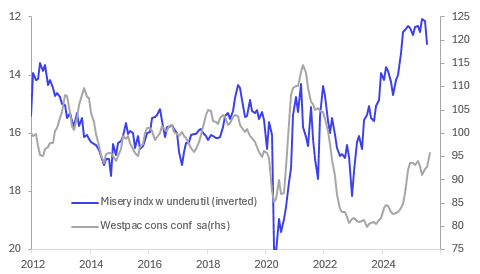
The substantial pickup in inflation in July drove a deterioration in the “misery index” to its highest in almost a year. If this is sustained then it could impact consumer confidence, but as the latter tends to be less volatile it is still too soon to tell. The 0.2pp improvement in underutilisation in July was offset by a 0.9pp increase in headline inflation to 2.8%. September Westpac consumer confidence prints on September 9.
Australia "misery index" vs Westpac consumer sentiment
Source: MNI - Market News/LSEG
- In July, RBA Deputy Governor Hauser observed that the “misery index” suggested that consumer sentiment should be stronger than it is and wondered if there had been a “scarring effect” from previous contractions in real disposable incomes.
- August consumer confidence rose to 95.8 from 92.9 though boosted by the RBA’s August 12 rate cut and signal that further easing is likely. Governor Bullock speaks on September 3 but there isn’t a meeting before the next sentiment data and rates are generally expected to be left unchanged at the September 30 decision.
- In July headline CPI was boosted by a 13.1% y/y rise in electricity prices in July after falling 6.3% in June. They rose 13% m/m due to Commonwealth rebates not paid to households in NSW and ACT which will occur in August. It is worth noting that outside of government payments, electricity still rose 4.8% m/m due to the yearly review.
- While headline inflation has been materially impacted in both directions due to state and federal government electricity rebates, it is likely the measure consumers “feel” and thus the best in the “misery index”.
BONDS: NZGBS: Yields 3-5bps Lower, Back End Leads
New Zealand government bond yields have lost traction as the Thursday session unfolded. Benchmark yields sit close to 3-5bps lower across the curve, with back end yields seeing slightly largely losses. The 2yr NZGB yield was last at 2.95%, consolidating the recent break sub 3.00%, while the 10yr is back to 4.32%. We are tracking towards fresh lows since April of this year for this benchmark.
- NZGB yields have likely seen some negative spill over from the lower Aussie yield backdrop, although ACGBs are only down a little over 2bps so far today.
- NZ 2yr swap rates continue to make fresh lows, last at 2.72%, off 3bps today.
- Earlier we had a few data points. NZ filled jobs rose for the second straight month in July, which is a tentative sign of some stabilisation in the labour market but the increases remain slight. The ANZ business confidence for August rose to 49.7 from 47.8, the highest since March. However, the activity outlook deteriorated to 38.7 from 40.6, the weakest since May. ANZ noted that the August 20 rate cut drove some “isolated lifts in the data” but there was “no generalised confidence improvement”. The survey remains consistent with a gradual but lacklustre recovery.
- Tomorrow the ANZ consumer confidence index for August is out.
NEW ZEALAND: Inflation Stabilising, Weaker Employment But Exports Improve
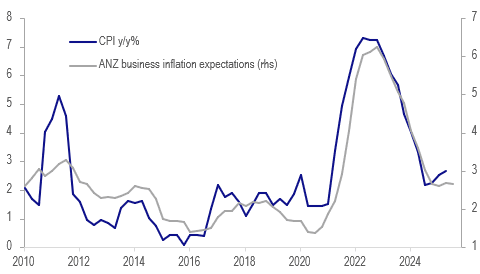
ANZ business confidence for August rose to 49.7 from 47.8, the highest since March. However, the activity outlook deteriorated to 38.7 from 40.6, the weakest since May. ANZ noted that the August 20 rate cut drove some “isolated lifts in the data” but there was “no generalised confidence improvement”. The survey remains consistent with a gradual but lacklustre recovery.
- Price/cost components improved, which is welcome given the risks that inflation will exceed the 3% top of the RBNZ’s band in the short term.
- Inflation expectations were 0.1pp lower at 2.6% in August and pricing intentions were down 1 point to 42.5, lowest since November, with 3-month ahead up 0.1pp to 1.5% driven by retail at 2.4%. Costs remained elevated but moderated 2 points to 74. Cost expectations 3-months ahead fell 0.1pp to 2.3%, while wages a year ahead moderated 0.1pp to 2.4%.
NZ CPI y/y % vs business inflation expectations
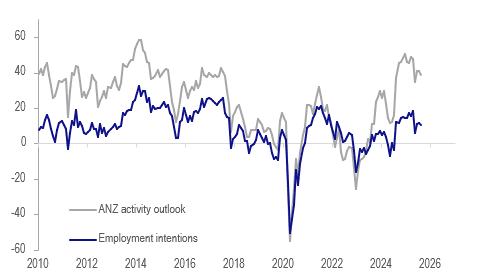
- Activity compared to a year ago deteriorated to +1.3 from +5.9 driven by continued weakness in construction but retail improved sharply in late August. The series is an indicator of GDP growth and is signalling a soft Q3.
- Employment eased 1 point to 10.5 but ANZ noted that services rose for the third straight month. July filled jobs in services rose 0.3% m/m. The Q3 average of business hiring intentions is currently slightly below Q2’s signalling that labour market conditions have remained soft.
- Investment and export intentions were bright spots. The former rose 0.5 point to 20.2, highest since December, driven by agriculture and services. Exports picked up 2 points, the highest since March before US reciprocal tariffs announced, with manufacturers strongest since February.
NZ ANZ business employment intentions vs activity outlook
Source: MNI - Market News/LSEG
NEW ZEALAND: Labour Market May Be Stabilising
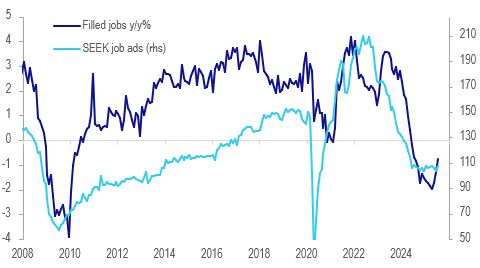
NZ filled jobs rose for the second straight month in July, which is a tentative sign of some stabilisation in the labour market but the increases remain slight. July was up 0.2% m/m after 0.1% but was still down 0.7% y/y but an improvement from June’s -1.3% y/y and April’s -2.0% y/y. Q3 labour market data is not out until 5 November and so August/September filled jobs will be monitored closely (29 Sep/28 Oct).
- SEEK reported a 3.9% m/m rise in July job ads to be down 0.5% y/y after -2.4% y/y in June and -30.7% in August 2024. It noted that vacancy levels have been going sideways for 10 months suggesting no further labour market deterioration - another sign of stabilisation but at weak levels.
- The services sector drove the increase in filled jobs rising 0.3% m/m. Primary industries also hired (+0.5%), while goods-producers cut by 0.1% m/m. Over the last year, construction, admin services and manufacturing drove job shedding, while the health and education sectors saw an increase in employment.
- Only the 35-39 year old age group has seen an increase in employment over the last year (+2.2% y/y), while 15-19 years fell 8.5% y/y and 20-24 years 3.2% y/y.
NZ labour market
Source: MNI - Market News/SEEK/Statistics NZ
FOREX: Asia FX Wrap - USD Weakness Extends In Asia
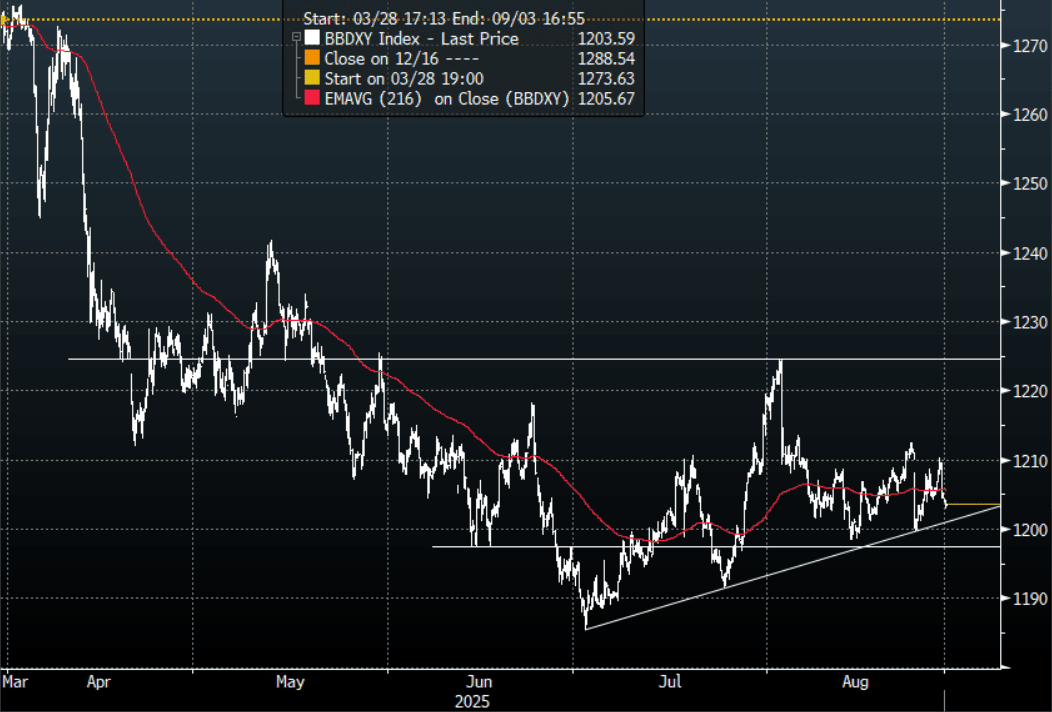
The BBDXY has had a range of 1202.84 - 1204.36 in the Asia-Pac session, it is currently trading around 1203, -0.15%. The initial USD demand seemed to be easily soaked up and when completed the USD proceeded to fall away effortlessly in the N/Y session. A sustained break below 1197/1195 is needed to regain the momentum lower and retest the year's lows. Risk has traded on the backfoot in Asia as the drag from the poor Nvidia earnings report followed through, E-minis -0.15%, NQU5 -0.30%. The USD’s use as a safe haven continues to be challenged though and has come back under pressure in early Asia even with risk trading heavy.
- EUR/USD - Asian range 1.1633 - 1.1655, Asia is currently trading 1.1640. The pair is consolidating just above its support. First support is back towards 1.1550, a move back below here could signal a deeper pullback as the market tries to find a base from which to build for another extension higher.
- GBP/USD - Asian range 1.3493 - 1.3518, Asia is currently dealing around 1.3505. The pair is consolidating around the 1.3500 area. Back in the middle of its recent 1.3350-1.3650 range, the USD’s fate will have a direct impact on which side is tested.
- USD/CNH - Asian range 7.1442-7.1542, the USD/CNY fix printed 7.1063, Asia is currently dealing around 7.1480. Sellers should be around on bounces while price holds below the 7.2200/2500 area and the PBOC manages the fix lower. Above 7.2500 and we could see a test of the USD Shorts.
- Cross asset : SPX -0.10%, Gold $3391, US 10-Year 4.225%, BBDXY 1203, Crude Oil $63.65
- Data/Events : Italy Consumer & Manf. Confidence/Industrial Sales, EZ Money Supply/Consumer Confidence
Fig 1: BBDXY Spot Daily Chart
Source: MNI - Market News/Bloomberg Finance L.P
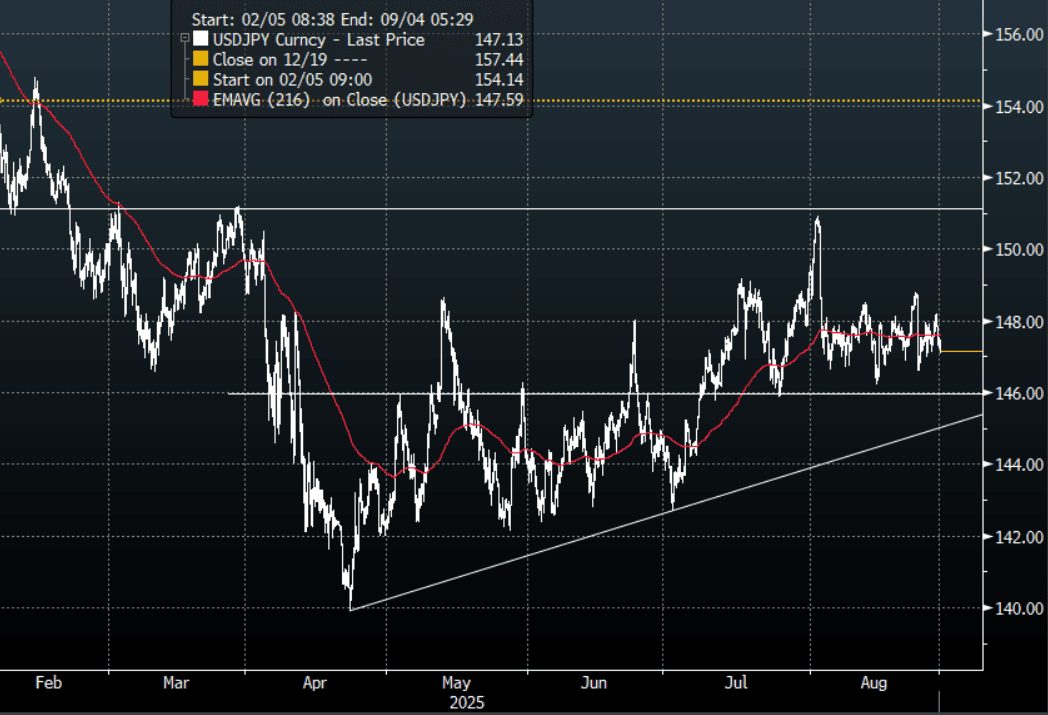
JPY: Asia Wrap - USD/JPY Drifts Back Towards 147.00
The Asia-Pac USD/JPY range has been 147.08-147.49, Asia is currently trading around 147.15, -0.20%. USD/JPY was capped by solid supply above 148.00 and when the USD demand was completed the pair proceeded to fall very easily again in the N/Y session. The demand towards 146.00 has been pretty solid all of July and August, keeping us for the most part in a 146.00-149.00 range. CFTC data for last week shows leveraged accounts again added to JPY shorts so they will be betting on the support continuing to hold. Should risk top out and have a deeper pullback this could create headwinds for cross-JPY.
- MNI BRIEF: BOJ's Nakagawa Sees Gradual Hikes; No Timing Hint. Bank of Japan board member Junko Nakagawa on Thursday backed a gradual rate hike but gave no guidance on the timing, citing high uncertainty. The remarks confirmed the BOJ’s economic and price outlook has remained unchanged since the July meeting.
- Offshore Investors Sell Japan Stocks For First Time Since June: Japan offshore investment flows were all negative last week, albeit with aggregate moves not large. Most notably were offshore investors selling nearly 500bn of local stocks. This was the first such outflow since mid June and indeed since early April we have only had two outflow weeks (including the latest observation)
- Futures Lower Post Poor 2yr Auction: The 2yr debt auction saw a bid to cover ratio of 2.84, the lowest since 2009. The tail from the auction, the gap between the average and lowest accepted prices, was higher at 0.022, versus 0.005 at the prior auction in late July. Note we have the 10yr debt auction on Sep 2, which is next Tuesday.
- Options : Close significant option expiries for NY cut, based on DTCC data: none.Upcoming Close Strikes : 145.00($1.17b Aug 29), 146.50($1.14b Aug 29), 147.50($806m Aug 29) - BBG.
- CFTC data shows last week asset managers have begun to add to their JPY longs after a consistent period of reduction +71379( Last +60866), leveraged funds though again used the dip to add to their newly built short JPY position -50848(Last -41257).
Fig 1 : USD/JPY Spot 2H Chart
Source: MNI - Market News/Bloomberg Finance L.P
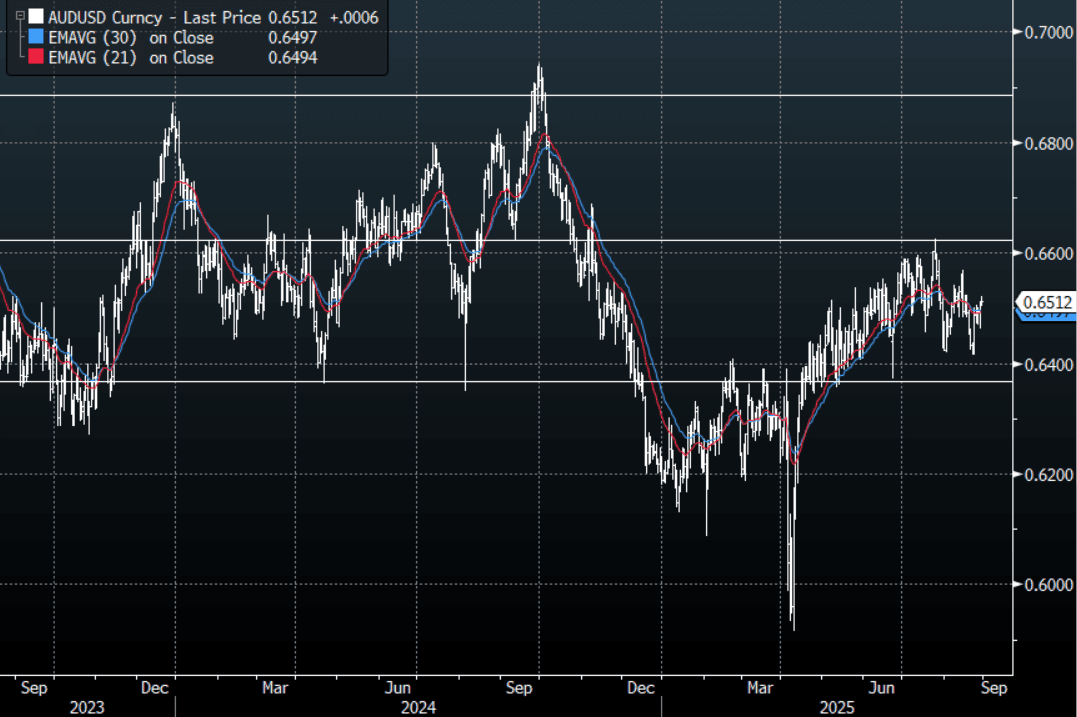
AUD: Asia Wrap - AUD/USD Probes Above 0.6500
The AUD/USD has had a range of 0.6503 - 0.6522 in the Asia- Pac session, it is currently trading around 0.6510, +0.10%. The Nvidia quarterly earning report disappointed and risk traded under pressure early on, it stabilised mid day and has since pared back a good portion of the losses, E-minis -0.10%, NQU5 -0.25%. The AUD finds itself firmly back in the middle of its recent multi-month range of 0.6350-0.6650 and will need a clearer direction from both the USD and risk to embark on a decent move in either direction.
- Private Capex Soft In Q2. Private sector capex remained soft in Q2 with volumes rising 0.2% q/q, driven by the non-mining sector, after falling 0.2% q/q to be up only 1.7% y/y although this was an improvement from Q1’s -0.6% y/y. There has been talk that investment needs to rise in order to see progress on productivity, which has been weak. Q2 GDP is released September 3 with inventories September 1, and net exports and public demand contributions September 2.
- July Inflation Rise Drives “Misery Index” To Highest Since Aug 2024: The substantial pickup in inflation in July drove a deterioration in the “misery index” to its highest in almost a year. If this is sustained then it could impact consumer confidence, but as the latter tends to be less volatile it is still too soon to tell. The 0.2pp improvement in underutilisation in July was offset by a 0.9pp increase in headline inflation to 2.8%. September Westpac consumer confidence prints on September 9.
- Options : Closest significant option expiries for NY cut, based on DTCC data: 0.6473(AUD401m), 0.6400(AUD571m). Upcoming Close Strikes : 0.6500(AUD900m Aug 29), 0.6455(AUD555m Sept 1), 0.6400(AUD768m Sept 2) - BBG
- AUD/JPY - Asia-Pac range 95.78 - 96.06, Asia is trading around 95.80. The pair continues to grind higher back towards the 96.00 area. This pair’s direction will be determined by the market's ability to follow on with this risk-on move or not. A sustained move back above 96.50 would turn the trend higher again but until then sellers should be around looking for this move to top out.
Fig 1: AUD/USD spot Daily Chart
Source: MNI - Market News/Bloomberg Finance L.P
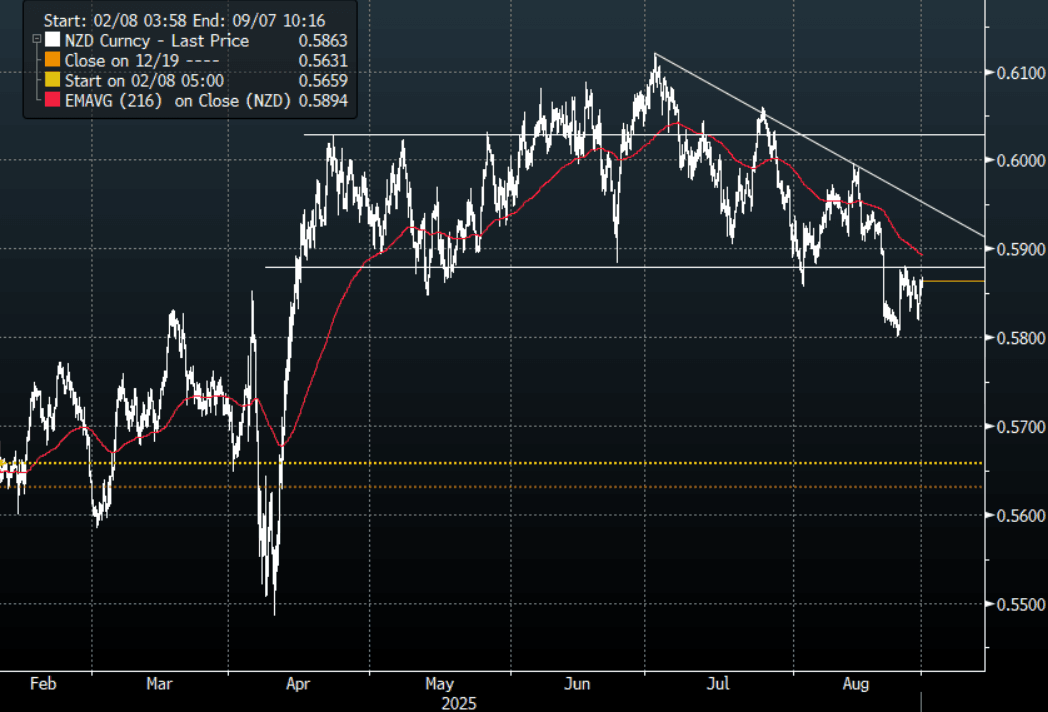
NZD: Asia Wrap - NZD/USD Probes Above 0.5850
The NZD/USD had a range of 0.5855 - 0.5868 in the Asia-Pac session, going into the London open trading around 0.5860, +0.05%. The Nvidia quarterly earning report disappointed being the poster child for AI and Tech it will be worth watching to see how the market digests this. The NZD again found some demand back towards 0.5800 overnight, sellers should continue to be around looking to fade any move back towards the 0.5950 area initially. US Futures traded heavily on the open on the back of Nvidia but have pared back a good portion of those losses, E-minis -0.05%, NQU5 -0.25%.
- Inflation Stabilising, Weaker Employment But Exports Improve: ANZ business confidence for August rose to 49.7 from 47.8, the highest since March. However, the activity outlook deteriorated to 38.7 from 40.6, the weakest since May. ANZ noted that the August 20 rate cut drove some “isolated lifts in the data” but there was “no generalised confidence improvement”. The survey remains consistent with a gradual but lacklustre recovery.
- Labour Market May Be Stabilising: NZ filled jobs rose for the second straight month in July, which is a tentative sign of some stabilisation in the labour market but the increases remain slight. July was up 0.2% m/m after 0.1% but was still down 0.7% y/y but an improvement from June’s -1.3% y/y and April’s -2.0% y/y. Q3 labour market data is not out until 5 November and so August/September filled jobs will be monitored closely (29 Sep/28 Oct).
- Options : Closest significant option expiries for NY cut, based on DTCC data: none. Upcoming Close Strikes : 0.5700(NZD500m Sept 2) - BBG
- AUD/NZD range for the session has been 1.1103 - 1.1124, currently trading 1.1110. The dovish RBNZ has seen the Cross surge higher breaking back above 1.100 convincingly. This move should now continue to see dips supported as it looks to build momentum to push higher.
Fig 1: NZD/USD Spot 2H Chart
Source: MNI - Market News/Bloomberg Finance L.P
ASIA STOCKS: US Tariffs Hit India as Major Markets Mixed Today
Analysts and fund managers in China are warning investors about potential short-term volatility in high-flying AI shares as some investors move away from broad index funds and into sector-specific ETFs, according to a report by China Securities Journal. The FT reported that one fabrication plant dedicated to producing Huawei’s AI processors in China is due to start production as soon as the end of the year, while another two are to launch next year and likely to double production output. Japanese stocks rose as sentiment improved after Warren Buffett’s Berkshire Hathaway raised its stake in Mitsubishi Corp. and as investors looked past Nvidia’s tepid earnings to focus on value shares.
It was generally a mixed day in Asia with the JCI and KOSPI leading, whilst the HSI and the NIFTY fell. The NIFTY is dragged down further by the doubling of US tariffs on Indian goods coming into effect overnight.
- China's major bourses were mixed with the Hang Seng down -0.66% along with Shenzhen down -0.14% whilst the CSI 300 the outperformer up +0.69% and Shanghai a mere +0.07%.
- Taiwan's TAIEX is lower by -0.61% as foreign flows turn negative.
- The NIKKEI is up for a second day straight by +0.52% as the returns for the week turn positive.
- The KOSPI is one of the best performers of the major bourses up +0.70% after yesterday's modest gains and the BOK on hold.
- In Malaysia, the FTSE Malay KLCI is up +0.26%, after finishing with gains of +0.40% yesterday.
- The Jakarta Composite is hitting new highs of 7,995 as it posts gains of +0.75% today.
- The NIFTY 50 fininshed lower by -1.02% yesterday on tariff news and is down in the morning trade by -0.43%
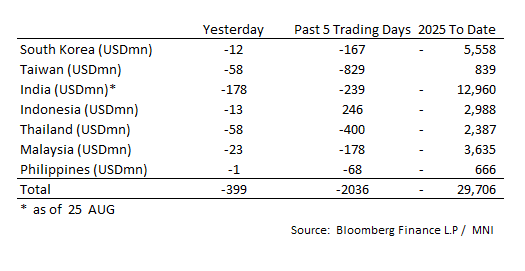
ASIA STOCKS: Five Day Outflows Top $2bn
The volatility in daily flows continues with major markets experiencing outflows as total outflows rise to over $2bn over the last five trading days.
- South Korea: Recorded outflows of -$12m yesterday, bringing the 5-day total to -$167m. 2025 to date flows are -$5,558. The 5-day average is -$33m, the 20-day average is -$22m and the 100-day average of +$7m.
- Taiwan: Had outflows of -$58m yesterday, with total outflows of -$829 m over the past 5 days. YTD flows are positive at +$839. The 5-day average is -$166m, the 20-day average of -$51m and the 100-day average of +$178m.
- India: Had outflows of -$178m as of the 25th, with total outflows of -$239m over the past 5 days. YTD flows are negative -$12,960m. The 5-day average is -$48m, the 20-day average of -$189m and the 100-day average of +$8m.
- Indonesia: Had outflows of -$13m yesterday, with total inflows of +$246m over the prior five days. YTD flows are negative -$2,988m. The 5-day average is +$49m, the 20-day average +$32m and the 100-day average -$13m.
- Thailand: Recorded outflows of -$58m yesterday, with outflows totaling -$400m over the past 5 days. YTD flows are negative at -$2,387m. The 5-day average is -$80m, the 20-day average of -$22m and the 100-day average of -$14m.
- Malaysia: Recorded outflows as of -$23m yesterday, totaling -$178m over the past 5 days. YTD flows are negative at -$3,635m. The 5-day average is -$36m, the 20-day average of -$35m and the 100-day average of -$14m.
- Philippines: Recorded outflows of -$1m yesterday, with net outflows of -$68m over the past 5 days. YTD flows are negative at -$666m. The 5-day average is -$14m, the 20-day average of -$2m the 100-day average of -$5m.
OIL: Crude Unwinds Wednesday’s Gains As Supply Worries At The Fore
Oil has given up a large share of Wednesday’s gains during today’s APAC trading as the excess supply outlook continues to worry the market and pressure prices. WTI is down 0.9% to $63.56/bbl just off the intraday low of $63.48, while Brent is 0.8% lower at $67.52/bbl after falling to $67.50. Both are set for a monthly decline in August. The USD index is down 0.1%.
- OPEC has normalised production targets through this year unwinding previous cuts but this has come at a time when risks to demand are heightened from increased US protectionism. There is also pressure for the US to increase its output but low prices may hinder that plan. Punitive tariffs could increase demand for non-Russian crude but only if flows can be monitored.
- Citigroup expects the global surplus to be more evident towards year end and is forecasting Brent at $66/bbl in Q3 then moderating to $63 in Q4, according to Bloomberg.
- Later the Fed’s Waller speaks on monetary policy. The July ECB meeting accounts are published. The next estimate of US Q2 GDP is released as well as jobless claims, July pending home sales, August Kansas manufacturing and euro area August European Commission survey.
Gold Lower, Friday’s US PCE Prices Next Watch Point
Gold prices fell to $3384.67/oz earlier and while off the low are still down 0.2% to $3391.3/oz. The weaker US dollar (BBDXY -0.1%) has not provided support as 2-year yields are slightly higher. Bullion will be watching Fed developments closely with PCE prices on Friday which could impact September rate cut pricing, as well as continued attacks on Fed independence from the administration.
- If President Trump is successful in removing Governor Cook, then he could gain four of the seven members. However, his previous appointees have remained independent in their decision making. His push for lower rates could backfire as threats to central bank independence are likely to drive bond risk premia higher.
- Silver is 0.4% higher at $38.73, close to the intraday high.
- Equities are mixed with the Nikkei up 0.5% and CSI 300 +0.7% but S&P e-mini down 0.1% and Hang Seng -0.7%. Oil prices are lower with WTI -0.8% to $63.64/bbl. Copper is down 0.1%.
- Later the Fed’s Waller speaks on monetary policy. The July ECB meeting accounts are published. The next estimate of US Q2 GDP is released as well as jobless claims, July pending home sales, August Kansas manufacturing and euro area August European Commission survey.
SOUTH KOREA: BOK Decision: Key Highlights from the Statement (amended)
Key Highlights from the BOK Statement
- The Bank of Korea’s Monetary Policy Board opted to keep the benchmark interest rate steady at 2.50% for the second consecutive meeting. .
- The Governor noted that the decision reflected concerns about rapidly rising mortgage debt, especially in Seoul, and ongoing financial instability from slowing growth, albeit with some early signs of improvement. Export growth remained solid for a second consecutive month, driven by strong demand in semiconductors and automobiles, aided in part by front-loading amid tariff concerns . .
- Whilst growth projections were slightly upgraded—from 0.8% to 0.9% for the year—this still marks the slowest growth since 2020 . Inflation risks appear manageable, supporting the likelihood of a more gradual easing cycle.
- The press conference emphasized a balanced approach to monetary easing with market commentators now expecting a possible 25 basis point rate cut in October, contingent on economic developments .
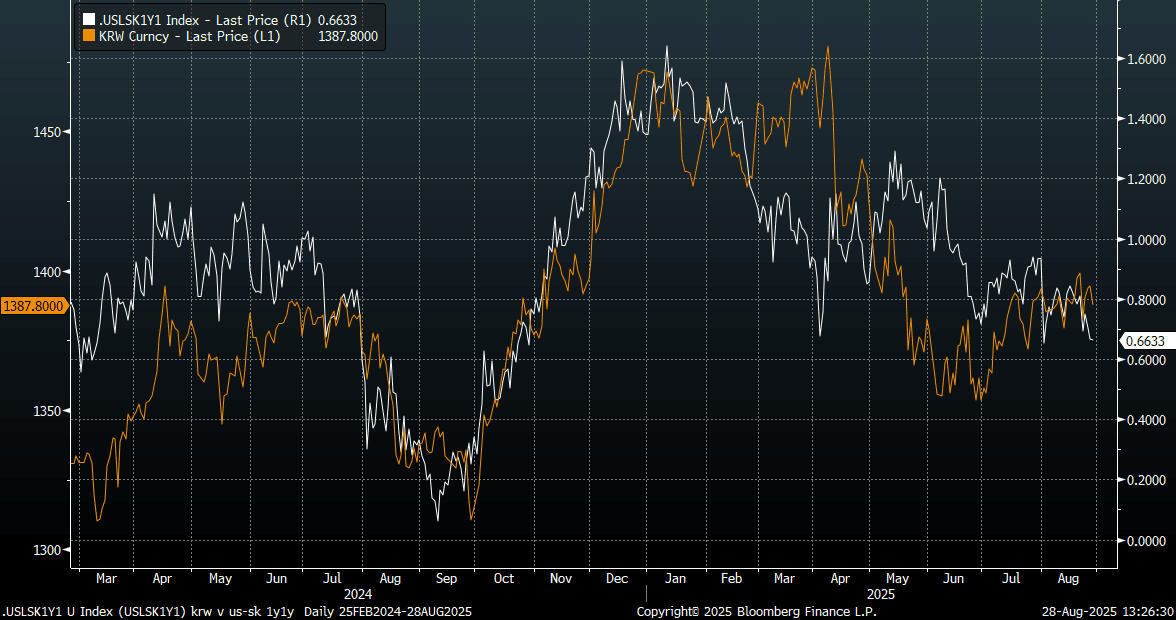
KRW: Spot USD/KRW Lower Post BoK, Rhee Says FX Discussions With US Tsy Continue
- Spot USD/KRW was last near 1387/88, up around 0.50% in won terms, and the best performer in the EM Asia FX space. The pair is back close to the 50-day EMA support point, just under 1387.
- As expected the BoK kept rates on hold but maintained an easing bias in terms of the outlook. One board member wanted to cut rates, but Governor Rhee stated that the central bank needs to work in tandem with government policy to curb housing market momentum (he said expects additional govt policies on this front).
- Still, 5 out of 6 board members see scope for lower rates in the 3 months, with Rhee stating that the easing bias could remain intact through the first half of next year. The BoK forecasts weren't shifted greatly, with Rhee noting positives and negatives around the growth backdrop.
- Rhee also indicated that FX discussions with the US Treasury are on-going. As these headlines crossed got to session lows of 1386.4. Rhee added that most intervention in the past 1-2 yrs has been aimed at limiting won weakness, and: *RHEE: US MAY SEE KOREA'S FX INTERVENTION EFFORTS AS DESIRABLE" (via BBG).
- Such a backdrop may place an upside cap on USD/KRW spot, where recent highs above 1400 have drawn selling interest. Still, over the medium term broader macro trends will dictate and Rhee also noted the difficulty of managing the won given strong offshore investment flow trends.
- Today's move lower in USD/KRW is also bring the pair more into line with US-SK 1y1y rate differentials, see the chart below.
- Fig 1: USD/KRW Spot Versus US-SK 1y1y Rate Differential
Source: Bloomberg Finance L.P./MNI
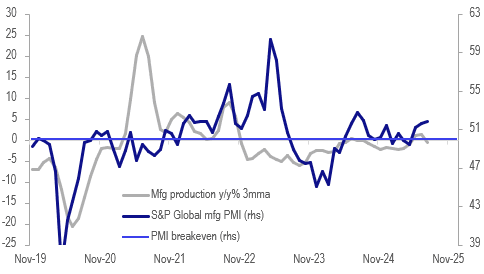
THAILAND: Manufacturing Contracts Sharply In July
July manufacturing production was very weak falling 4% y/y, the weakest since December 2023, after +0.4% y/y. Seasonally adjusted it fell 2.2% m/m. Capacity utilisation fell to 57.4 from 59.5 in June, also the lowest since end 2023.
- Bank of Thailand’s business confidence fell in July but remained above May’s low. In contrast, the S&P Global manufacturing PMI has been above the breakeven-50 level for the last three months with July at 51.9 implying growth in activity. Both series receive August updates on September 1.
- The industry ministry said that July’s weakness was driven by softer auto production as well as debt levels.
- It has revised down its 2025 manufacturing forecast to 0-0.5% from 0-1% and expects it to continue to contract through H2.
- Bank of Thailand has been concerned about a slowdown in growth in H2 driven by increased US protectionism and payback for the frontloading of Thai exports to the US in H1. Weaker tourist arrivals are also likely to weigh on growth. It has cut rates 100bp this cycle.
Thailand manufacturing
UP TODAY (TIMES GMT/LOCAL)
| Date | GMT/Local | Impact | Country | Event |
| 28/08/2025 | 0700/0900 | ** | Economic Tendency Indicator | |
| 28/08/2025 | 0700/0900 | *** | GDP | |
| 28/08/2025 | 0700/0900 | ** | KOF Economic Barometer | |
| 28/08/2025 | 0800/1000 | ** | M3 | |
| 28/08/2025 | 0800/1000 | ** | ISTAT Consumer Confidence | |
| 28/08/2025 | 0800/1000 | ** | ISTAT Business Confidence | |
| 28/08/2025 | 0900/1100 | * | Consumer Confidence, Industrial Sentiment | |
| 28/08/2025 | 1230/0830 | *** | Jobless Claims | |
| 28/08/2025 | 1230/0830 | ** | WASDE Weekly Import/Export | |
| 28/08/2025 | 1230/0830 | * | Current account | |
| 28/08/2025 | 1230/0830 | * | Payroll employment | |
| 28/08/2025 | 1230/0830 | *** | GDP / PCE Quarterly | |
| 28/08/2025 | 1400/1000 | ** | NAR Pending Home Sales | |
| 28/08/2025 | 1430/1030 | ** | Natural Gas Stocks | |
| 28/08/2025 | 1500/1100 | ** | Kansas City Fed Manufacturing Index | |
| 28/08/2025 | 1530/1130 | ** | US Bill 04 Week Treasury Auction Result | |
| 28/08/2025 | 1530/1130 | * | US Bill 08 Week Treasury Auction Result | |
| 28/08/2025 | 1700/1300 | ** | US Treasury Auction Result for 7 Year Note | |
| 28/08/2025 | 2200/1800 | Fed Governor Christopher Waller | ||
| 29/08/2025 | 2330/0830 | * | Labor Force Survey | |
| 29/08/2025 | 2330/0830 | ** | Tokyo CPI | |
| 29/08/2025 | 2350/0850 | ** | Industrial Production | |
| 29/08/2025 | 2350/0850 | * | Retail Sales (p) | |
| 29/08/2025 | 0600/0800 | *** | GDP | |
| 29/08/2025 | 0600/0800 | ** | Retail Sales | |
| 29/08/2025 | 0600/0800 | ** | Import/Export Prices | |
| 29/08/2025 | 0600/0800 | ** | Retail Sales | |
| 29/08/2025 | 0630/0730 | DMO to release FQ3 (Oct-Dec) issuance ops calendar | ||
| 29/08/2025 | 0645/0845 | *** | HICP (p) | |
| 29/08/2025 | 0645/0845 | ** | PPI | |
| 29/08/2025 | 0645/0845 | *** | GDP (f) | |
| 29/08/2025 | 0645/0845 | ** | Consumer Spending | |
| 29/08/2025 | 0700/0900 | *** | HICP (p) | |
| 29/08/2025 | 0755/0955 | ** | Unemployment | |
| 29/08/2025 | 0800/1000 | *** | GDP (f) | |
| 29/08/2025 | 0800/1000 | *** | Bavaria CPI | |
| 29/08/2025 | 0800/1000 | *** | North Rhine Westphalia CPI | |
| 29/08/2025 | 0800/1000 | *** | Baden Wuerttemberg CPI | |
| 29/08/2025 | 0800/1000 | ** | ECB Consumer Expectations Survey | |
| 29/08/2025 | 0900/1100 | *** | HICP (p) | |
| 29/08/2025 | 0900/1100 | ECB de Guindos at Cursos Europeos de Verano | ||
| 29/08/2025 | 1200/1400 | *** | Germany CPI (p) | |
| 29/08/2025 | 1200/1400 | *** | Germany CPI (p) | |
| 29/08/2025 | 1230/0830 | *** | GDP - Canadian Economic Accounts | |
| 29/08/2025 | 1230/0830 | *** | Gross Domestic Product by Industry | |
| 29/08/2025 | 1230/0830 | *** | CA GDP by Industry and GDP Canadian Economic Accounts Combined | |
| 29/08/2025 | 1230/0830 | *** | Personal Income and Consumption | |
| 29/08/2025 | 1230/0830 | ** | Advance Trade, Advance Business Inventories | |
| 29/08/2025 | 1342/0942 | *** | MNI Chicago PMI |