MNI ASIA OPEN: Steeling For Further Tariff Volatility
MNI (NEW YORK) -
EXECUTIVE SUMMARY
- Trump: US to Double Steel Import Tariffs to 50% (BBC)
- MNI SOURCES: ECB Set To Lower 2026 Inflation Projection
- MNI: Italy Eyes Transition To New NATO Target-Treasury Sources
- MNI: Chicago Business Barometer™ - Slowed To 40.5 In May
- MNI BRIEF: China May Manufacturing PMI Remains In Contraction
- US DATA: GDPNow Jumps To 3.8% For Q2 After Import Slide
US TSYS: Twist Steepening Into Monthly Close
Treasuries twist steepened into the monthly close Friday.
- After a fairly flat overnight session, yields fell across the curve in early New York trade after President Trump posted on social media that China was in violation of its agreement set with the US, triggering a risk-off move.
- Yields would bounce back after PCE data came largely in line though April's trade deficit was much smaller than expected, later leading the Atlanta Fed to up its Q2 GDP growth nowcast to close to 4%.
- The Treasury bid was re-kindled in late morning, following weak MNI Chicago PMI data and a downward revision in UMichigan consumer inflation expectations, and as equities headed to session lows.
- But from there into the close, stocks and bonds decoupled (possibly the result of month-end dynamics), with the former rising to session highs while Treasuries merely consolidated earlier gains.
- Latest levels: the 2-Yr yield is down 3.5bps at 3.9037%, 5-Yr is down 2.8bps at 3.9686%, 10-Yr is down 1.2bps at 4.4063%, and 30-Yr is up 0.7bps at 4.9233%. The Sep 25 T-Note future is up 4/32 at 110-26, having traded in a range of 110-18 to 110-29.5.
- Monday's highlights include the ISM Manufacturing survey and an appearance by Fed Chair Powell, with the June employment report looming at the end of next week.
NEWS
US: Trump Says He’ll Double Steel Tariff to 50 Percent (Politico)
President Donald Trump said on Friday that he is doubling his tariff on steel to 50 percent, from 25 percent currently, to prevent billions of dollars worth of foreign steel from continuing to enter the United States. “At 50 percent, they can no longer get over the fence,” Trump said during a speech at a U.S. Steel facility in West Mifflin, Pennsylvania, where he announced some details of a new “partnership” that will allow Japanese-owned Nippon Steel to acquire the iconic American company.
U.S.-China Trade Truce Risks Falling Apart Over Rare-Earth Exports (WSJ)
A trade truce between the U.S. and China is at risk of falling apart, as China’s slow-walking on rare-earth exports fuels U.S. recriminations that China is reneging on the deal. Getting the pact together in Geneva earlier this month hinged on Beijing’s concession on the critical minerals, according to people familiar with the matter.
Ukraine claims massive drone strike on Russian bombers (NBC)
Ukraine’s Security Service claims to have struck more than 40 Russian bombers deep inside Russian territory, in what would be one of the largest and most audacious attacks on Russian territory in the yearslong conflict. A source within the Security Service of Ukraine (SBU) told NBC News that the country targeted “41 strategic Russian aircraft” in an offensive operation code-named “Spiderweb.”
MNI: Ex-Fed's Warsh Comes Out Strongly Against Digital Dollar
Former Federal Reserve Board Governor Kevin Warsh said Friday it would be a terrible idea for the United States to pursue a digital dollar or central bank digital currency because it would raise privacy concerns and raise the risk of political interference in the Fed's affairs. "In a word, no," he said in response to a question about whether the adoption of a digital currency by the Federal Reserve should be considered. "I think it's ahistorical and, frankly, anti-American."
MNI BRIEF: Fed Balance Sheet Could Be Trillions Smaller-Warsh
The Federal Reserve should aim for a much smaller balance sheet in order to have a smaller footprint in financial markets and reduce the risk of inflationary bursts like the one experienced after Covid, former Fed Board Governor Kevin Warsh said Friday. The Fed's balance sheet "is trillions larger than it needs to be. We can't make this change overnight," said Warsh, who is seen as a leading candidate to replace Jerome Powell as Fed chair next year.
MNI BRIEF: China May Manufacturing PMI Remains In Contraction
China's Manufacturing Purchasing Managers Index rose by 0.5 points to 49.5 in May, but remained below the breakeven 50 mark for the second month, data from the National Bureau of Statistics showed Saturday. The production sub-index increased by 0.9 points to 50.7, rising above the critical 50 as manufacturing activities accelerated. The new order sub-index was 49.8, up 0.6 points from the previous month. The non-manufacturing PMI registered 50.3, down 0.1 points from the previous month. The business activity sub-index for the service sector edged up by 0.1 points to 50.2. The expectation sub-index was up 0.1 points to stay in a relatively high prosperity range of 56.5, with most service businesses remaining optimistic about market development.
MNI: Italy Eyes Transition To New NATO Target-Treasury Sources
The Italian government is confident that changes in both European Commission and NATO frameworks will allow for a smoother transition towards a higher defence spending target expected to be announced after the transatlantic summit on June 24, Treasury sources told MNI. Rome believes that a defence spending target of 5% of GDP – a figure currently circulating in policy discussions – would be “almost impossible to meet” given the country’s tight public finances.
MNI SOURCES: ECB Set To Lower 2026 Inflation Projection
The European Central Bank is likely to lower its inflation projection for 2026 to 1.7% or 1.8% in its June exercise, one or two tenths below the 1.9% seen in March, Eurosystem sources told MNI, adding that there could be a pause in rate cuts after a further 25-basis-point reduction next week. “I certainly think we will have an average rate of 1.8% for 2026, but the risk must be on a degree lower, so 1.7% can't be ruled out,” one official said, pointing to the decline in energy costs and euro appreciation, but adding that the implications for prices from realised inflation, together with wages, risks to growth and the outlook for fiscal spending, are probably broadly balanced.
OVERNIGHT DATA
Chicago Business Barometer™ - Slowed To 40.5 In May
The Chicago Business Barometer™, produced with MNI, slowed 4.1 points to 40.5 in May. This was the second consecutive fall, bringing the index to its lowest level since January. The index has now been below 50 for eighteen consecutive months.
The decrease was driven by a fall in New Orders, Order Backlogs and Production. Supplier Deliveries and Employment rose relative to April.

US DATA: Core PCE Unrounded Plus Revisions - April
Core PCE M/M inflation was completely in line with expectations in April. The 0.06pp March upward revision was similar to what some analysts had specified, with downward revisions in Jan and Feb less of a surprise and yesterday's softer Q1 print.
- M/M (SA): 0.116% in Apr (vs BBG cons 0.1 median, MNI unrounded 0.12 av)
- Follows 0.091% in Mar (initial 0.028%), 0.465% in Feb (initial 0.498%) and 0.326% in Jan (initial 0.337%).
- Y/Y (SA): 2.523% in Apr (cons 2.6) from 2.665% in Mar
US DATA: Rare Supercore PCE Deflation But Robust Market-Based Metrics
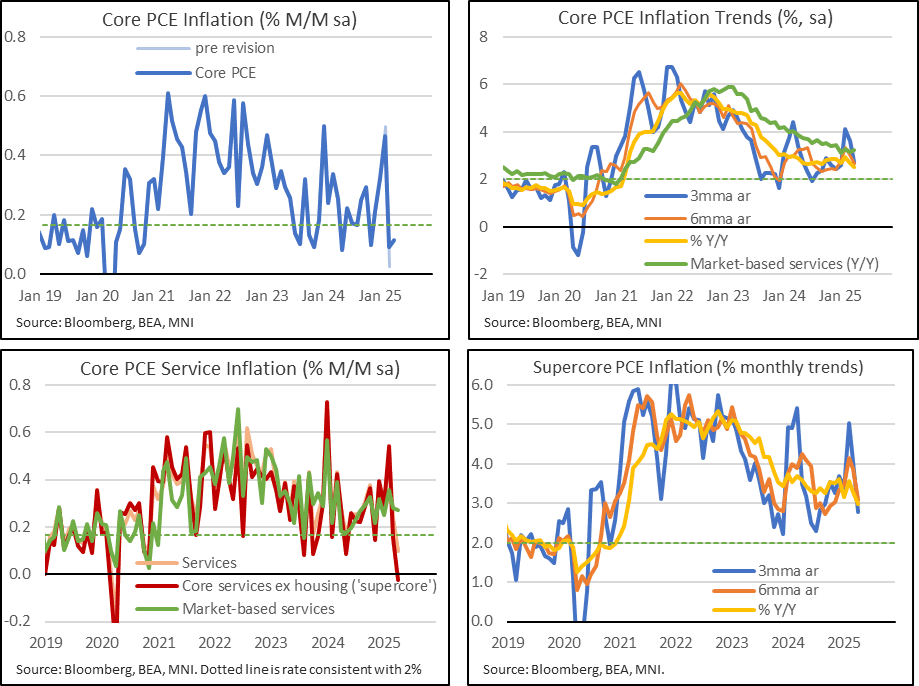
- Core PCE inflation was completely in line with expectations for April on a M/M basis, at 0.116% M/M (unrounded analyst average 0.12).
- It followed a 0.06pp upward revision to 0.09% M/M in March (also roughly as expected after PPI data released mid-month) but with downward revisions earlier in the quarter as we had suspected after yesterday’s Q1 revisions (-0.03pp to 0.465% in Feb, -0.01pp to 0.326% in Jan).
- This marginal sequential firming in core PCE (from 0.09% to 0.12%) came despite a particularly weak core services ex-housing (supercore) at -0.02% M/M in Apr after 0.15% M/M. Supercore last saw M/M deflation in Mar and Apr 2020.
- The core PCE Y/Y meanwhile moderated from 2.67% to 2.52% for a fresh low since Mar 2021.
- Recent run rates are still higher than that but have started to close the gap. The three- and six-month rates both cooled to 2.7% annualized, from 3.6% for the three-month and 3.0% for the six-month, for their lowest since Jan. Having been 0.43pp higher than the Y//Y as recently as Feb, the six-month rate is now 0.14pp higher, pointing to a less troubling recent trajectory.
- A similar trend comparison for supercore PCE inflation sees it on a (slowly) downward path from recently strong rates, with the three-month at 2.8%, six-month at 3.1% and Y/Y at 2.98%. The Y/Y was at 3.57% Y/Y as recently as February.
- One caveat here though when looking at broader services is that market-based services (a measure the Fed has been putting more weight on recently rather than others which include imputed series) still increased a solid 0.27% M/M in April after an upward revised 0.28% M/M (initial 0.15) in March. It left accelerating run rates with 3.7% annualized over three-months, 3.4% over six-months and 3.2% Y/Y, but caution is of course needed when it comes to focusing too heavily on one area.
US DATA: Personal Spending Consolidates In April, Underlying Income Solid
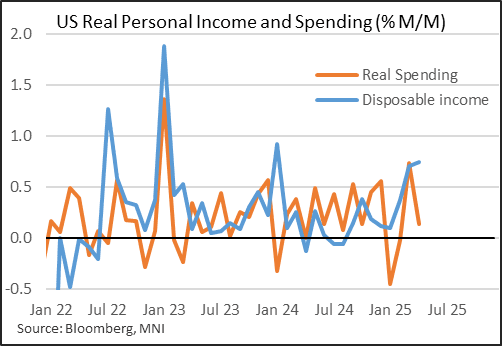
April private spending was a little better than expected - but personal income was much stronger than anticipated. While there are some worrying signs in terms of consumer momentum, particularly in services purchases, the employee income growth which has driven much of the economic expansion has not shown any signs of abating going into Q2.
- Real personal spending rose 0.1% M/M in April, a sharp slowdown from 0.7% in March but slightly above the 0.0% consensus. In nominal terms, it was in-line at 0.2% M/M (again after 0.7%).
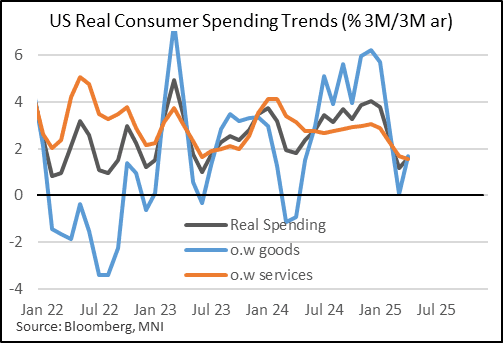
- Overall, spending is running at a nominal 5.5% 3M/3M annualized rate, gaining a bit of momentum since earlier in the year. Real spending is only picking up slowly, at a 1.6% 3M/3M annual rate, though that compares favorably to February's 1.2% which was a 21-month low.
- Real goods consumption contracted by 0.2% after an apparent tariff front-loaded +1.5% in March (still running at a 1.7% 3M/3M rate), with real services purchases dipping to 0.3% from 0.4%. The slowing here is more pronounced on a momentum basis than in goods: 3M/3M annualized real services growth is running at 1.5%, slowest since July 2020 (ie pandemic).
- Income was the big surprise though: it rose 0.8% M/M (in nominal terms) vs 0.3% consensus, with March's revised up to 0.7% from 0.5%.
- Employee compensation - which is 2/3 of income - rose by 0.5% M/M for a remarkably consistent 4th month out of 5. Nominal income is now running at an 8.3% 3M/3M annual rate, which is the fastest since Q1 2024, and has accelerated for 7 consecutive months.
- The jump may prove illusory: personal current transfer receipts stood out for the fastest rise since January 2024, up 2.8% M/M, the bulk of which was Social Security payments (ie government benefits) which will not repeat in terms of future growth. April's bump is very likely reflecting the Social Security Fairness Act, which is upping payments for over 3 million pensioners.
- Either way, real disposable income grew at 0.7% M/M for a second consecutive month, and is growing at a 4.9% 3M/3M annualized clip - likewise the highest since Q1 2024.
- Squaring the circle of soft spending vs high incomes are savings rates: the household savings ratio rose 0.6pp to 4.9% in April, the highest in 11 months. This potentially reflects a lack of consumer confidence in the month, judging from multiple surveys - though we would always take individual months' readings with some caution as they are subject to considerable revisions.
US DATA: UMich Survey Revisions Should Ease Stagflationary Concerns
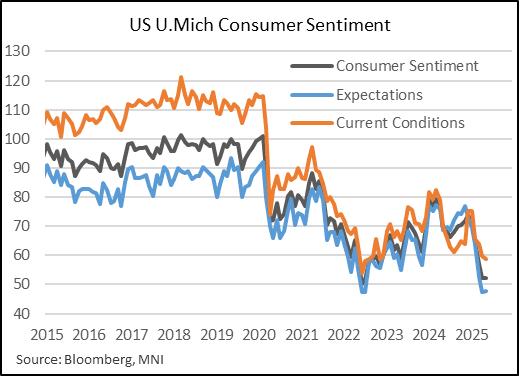
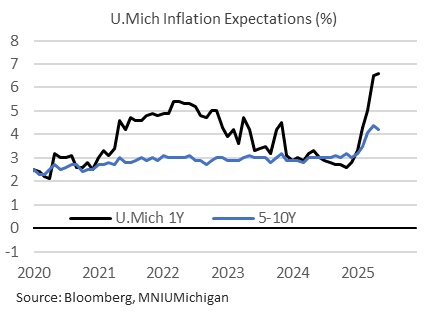
The sharp drop in UMichigan inflation expectations in the final versus preliminary report for May (1Y to 6.6% vs 7.3% prelim, 5-10Y to 4.2% vs 4.6% prelim) largely if not entirely reflects the timing of the survey before and after the US-China tariff climbdown on May 12.
- Indeed the survey dates (prelim survey period ended May 13, but the final survey deadline was May 26) are key to any interpretation of the report, which noted that "sentiment had ebbed at the preliminary reading for May but turned a corner in the latter half of the month following the temporary pause on some tariffs on China goods."
- The headline sentiment figure was revised up 1.4pp to 52.2, leaving it unchanged from April, with current economic conditions up 1.3pp to 58.9 (59.8 April), expectations up 1.4pp to 47.9 (47.3 Apr), and the household finance index up 3pp to 67.
- Even though the improvement vs prelim had been expected, the May final report looks better than consensus anticipated and will alleviate some concerns over a stagflationary consumer outlook that had looked among the worst in survey history.
- Make no mistake, these are very worrying figures for the outlook in their own right.
- But in particular, longer-term inflation expectations appear to be turning a corner lower, after a 4.4% peak in April, potentially giving the Fed (some of whose members had mentioned some concern over the UMich survey, even if only skeptically) a bit more confidence that higher expectations aren't becoming entrenched.
US DATA: Far Smaller Trade Deficit As Tariff Front-Running Corrects Abruptly
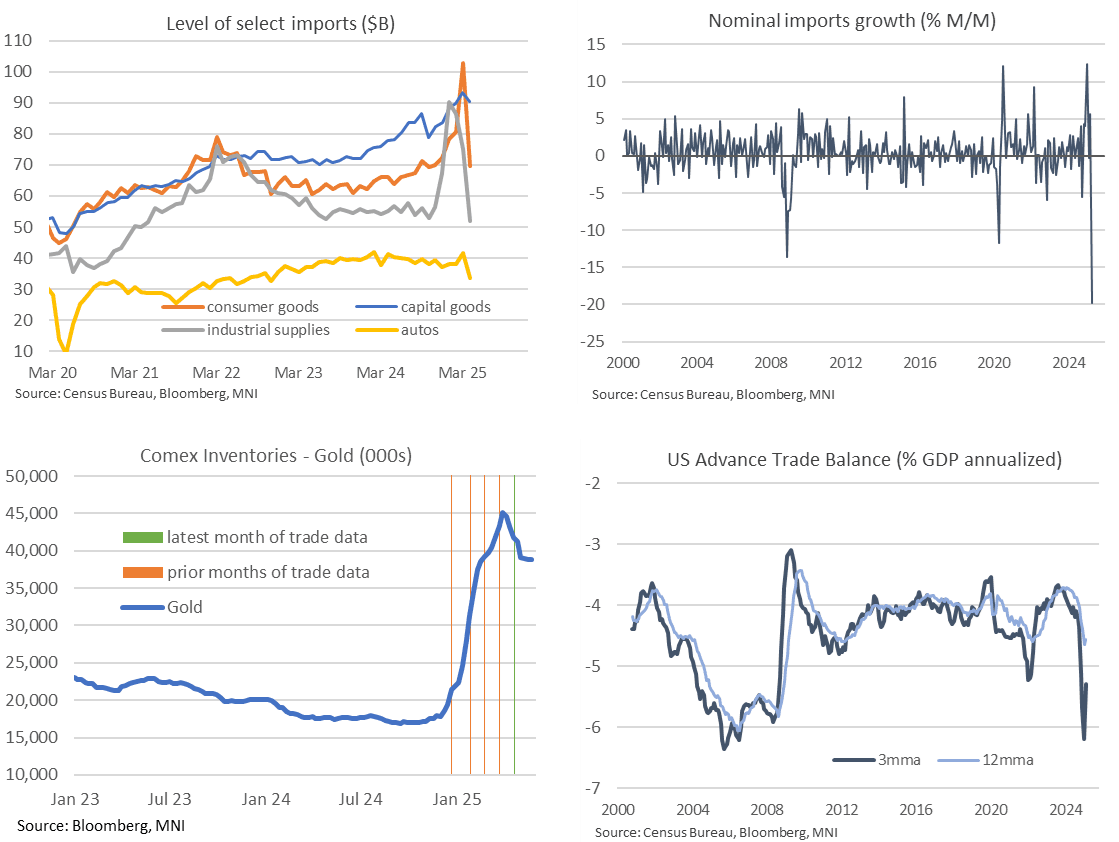
Advance April trade data saw a far smaller than expected goods trade deficit with clear signs of an abrupt cooling in imports after some particularly elevated readings ahead of reciprocal tariffs starting in April. We suspect gold and pharmaceutical products were particularly to blame but will have a better idea next week. Of note though, capital goods imports are one area that hasn't seen a meaningful correction lower.
- The goods trade deficit was far smaller than expected in the advance April release, printing just $87.6bn (cons $143bn, range $110-177bn across 34 estimates) after $162.3bn in March.
- The imports side of the ledger continues to dominate amidst major tariff distortions. Total imports fell -19.8% M/M for the biggest drop on record after a run with 5.7% M/M in Mar, -0.3% M/M in Feb and an almost record high 12.4% M/M in Jan.
- There were pull backs in imports across all the main categories but by far the most impactful were industrial supplies (probably gold) and consumer goods (probably pharma) along with a non-trivial hit to auto imports.
- It’s easiest comparing the outright levels after some unprecedented swings, where industrial supplies and auto imports have pulled back below 2024 averages. However, consumer goods and especially capital goods are still higher, with the latter interesting amidst investment pledges:
- Industrial supplies: $51.8bn in Apr, $75bn Mar, $86bn Feb, $90bn Jan and $67bn in Dec. They averaged $56bn in 2024.
- Consumer goods: $69.6bn in Apr, $103bn Mar, $81bn Feb, $78bn Jan and $72bn in Dec. They averaged $67bn in 2024.
- Autos: $33.6bn in Apr, $41.5bn Mar, $38bn Feb, $38bn Jan and $37bn in Dec. They averaged $40bn in 2024.
- Capital goods: $90.5bn in Apr, $93bn Mar, $90bn Feb, $88bn Jan and $84bn in Dec. They averaged $80bn in 2024.
- Final details, released Jun 5, will be needed but a small reduction in Comex gold inventories had suggested a further correction to more normal levels after gold imports surged in January and then moderated but were still extremely elevated in Feb and Mar.
- Consumer goods had recently seen a more abrupt contribution from a spike in pharmaceutical imports as they jumped from an already elevated $29.5bn in Fed to $50.4bn in Mar (they averaged $21bn in 2024). This was driven by Irish shipments in particular and we suspect this category saw a sharp unwind in April.
- There is still a huge amount of dust to settle but for what it’s worth, the goods trade deficit stands at 5.3% GDP on a three-month basis (from 5.1% in Jan and 4.1% in Oct) whilst the twelve-month rate stands at 4.6% GDP.
US DATA: GDPNow Jumps To 3.8% For Q2 After Import Slide
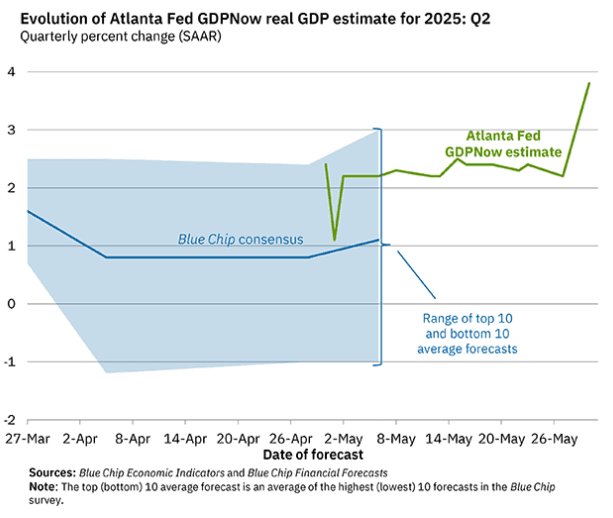
- The Atlanta Fed’s GDPNow has revised its Q2 real GDP growth estimate sharply higher to 3.84% from 2.18% in its May 27 update.
- It follows today’s far smaller than expected trade deficit as imports tumbled after tariff front-running, and indeed the tracker now sees a net trade contribution of +1.45pp on the quarter vs a drag of -0.64pp previously expected.
- Recall that the -4.9pp drag from net trade in Q1 played a huge role in Q1 GDP growth of -0.2% annualized.
- There were however downward revisions to personal consumption (from 3.7% to 3.3%) and gross private domestic investment (from -0.2% to -1.4%).
- PDFP, an area that Powell has frequently put focus on, is currently seen adding 2.7pps to GDP growth (revised down from 3.0pp in the May 27 update) after 2.1pp in Q1 and 2.5pp in Q4.
CANADA DATA: Canada Q1 GDP Annualized +2.2%; Domestic Demand Falls
-
- Canada Q1 annualized GDP +2.2%, above Bank of Canada's forecast for +1.8%. Increase driven by exports of goods and inventory accumulation suggesting stockpiling amid U.S. tariff threats. Imports and weaker residential resales moderated growth.
- StatsCan said Friday final domestic demand fell for the first time since the end of 2023. Annualized final domestic demand -0.1% in Q1 after +5.2% in prior quarter. Household spending slowed to +1.2% vs prior +4.9%. Residential construction was also slower -11% from +17%.
- April advance GDP estimate +0.1% MOM driven by mining, quarrying and oil but this was partially offset by decline in manufacturing.
- March GDP expanded +0.1% in line with economist expectations after -0.2% in Feb. The growth driven by mining, quarrying, oil and gas sector +2.2% MOM as crude extraction resumed following disruptions.
- StatsCan lowered Q4 GDP to +2.1% from +2.6%.
- Last major release before BOC's rate decision June 4. Some economists expect the central bank to hold interest rates at 2.75% for a second time as core inflation is now above the BOC target band, others see a 25bp cut.
MNI: Canada 2024-25 Budget Deficit Unexpectedly Narrows
Canada's preliminary budget deficit for the fiscal year that ended in March narrowed to CAD43.2 billion from CAD50.9 billion in the previous year the finance department said Friday, a surprising result through a period where the government was rolling out pre-election spending pledges. Revenue grew 11% according to the Fiscal Monitor report while program spending growth was slower at 9% over the fiscal year. The finance department cautions final figures are coming later this year, and the bottom line can change by several billion dollars as the books are closed.
SOFR FIXES AND PRIOR SESSION REFERENCE RATES
US TSYS/OVERNIGHT REPO: SOFR Holds Ahead Of Month-End/Settlement Pressures
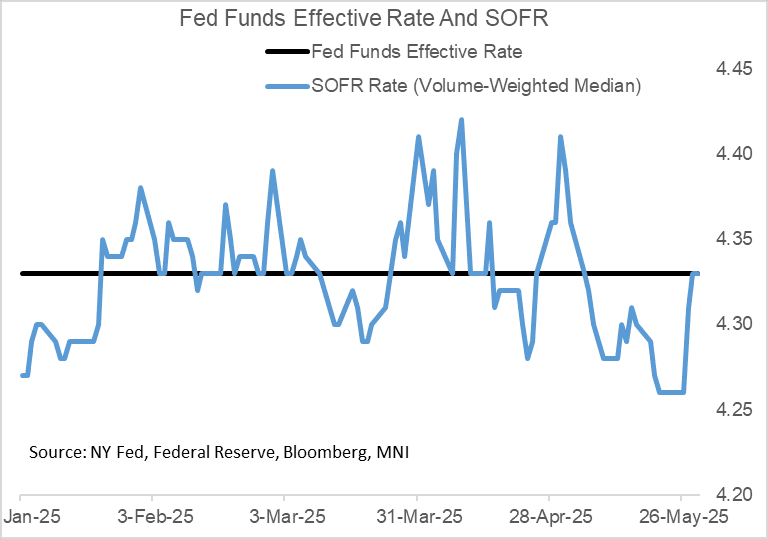
Secured rates were unchanged Thursday after successive rises, with SOFR remaining at 4.33%.
- There were probably countervailing forces at play: to the upside by looming month-end pressures, and to the downside by $29B net Treasury paydowns (bills).
- Friday and Monday will see significantly more upside pressure on rates though: month-end dynamics and $46B in Treasury net new cash raised via FRN / TIPS auction settlements (Friday), and a further $94B in nominal coupon settlements Monday.
REPO REFERENCE RATES (rate, change from prev. day, volume):
* Secured Overnight Financing Rate (SOFR): 4.33%, no change, $2652B
* Broad General Collateral Rate (BGCR): 4.32%, no change, $1059B
* Tri-Party General Collateral Rate (TGCR): 4.32%, no change, $1021B
New York Fed EFFR for prior session (rate, chg from prev day):
* Daily Effective Fed Funds Rate: 4.33%, no change, volume: $114B
* Daily Overnight Bank Funding Rate: 4.33%, no change, volume: $302B
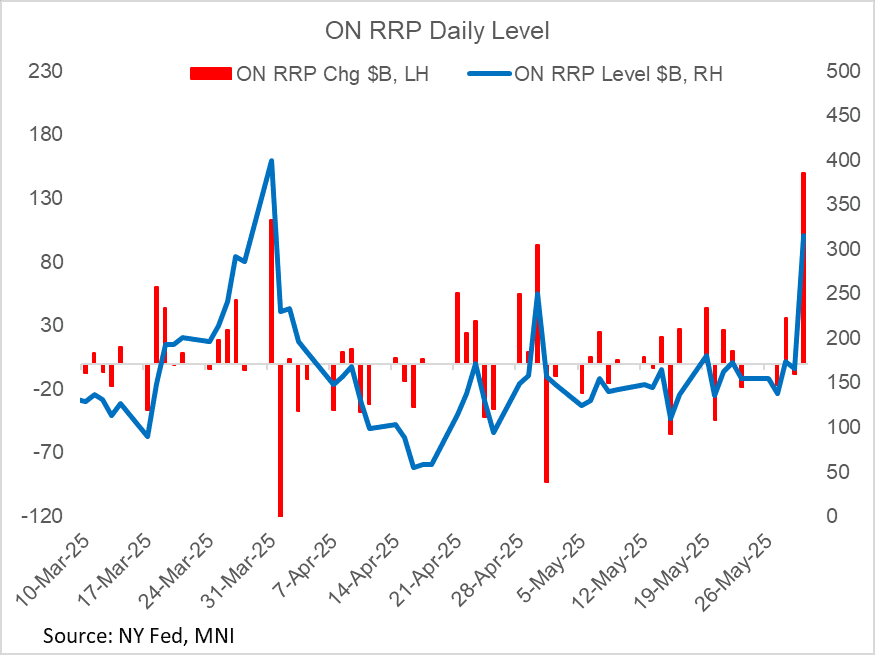
US TSYS/OVERNIGHT REPO: Overnight Reverse Repo Takeup Soars At Month-End
Takeup of the Fed's overnight reverse repo facility soared by $150B Friday, the biggest jump of the year (the last highest was Dec 31, 2024 amid year-/quarter-/month-end).
- The overall takeup ($315.7B) was the highest since quarter-end Q1 (March 31, $399.2B).
- This increase appears to be higher than anticipated (one estimate we saw was Wrightson ICAP's $260B), and indeed the takeup appears unusually large for a non-quarter end.
- Regardless, inflows are expected to reverse sharply lower Monday as usual following month-end.
US 10YR FUTURE TECHS: (U5) Bear Threat Remains Present
- RES 4: 112-04+ High May 2
- RES 3: 111-25 High May 7
- RES 2: 111-05+ High May 9
- RES 1: 110-23/27+ High May 16 and a key resistance / High May 30
- PRICE: 110-21 @ 16:01 BST May 30
- SUP 1: 109-26/12+ Low May 29 / 22 and the bear trigger
- SUP 2: 109-09+ Low Apr 11 and key support
- SUP 3: 109-00 Round number support
- SUP 4: 108-25+ 0.764 proj of the Apr 7 - 11 - May 1 price swing
A bear cycle in Treasury futures remains in play for now, and recent short-term gains are considered corrective. However, the contract is testing resistance 110-23, the May 16 high. A clear break of this level would undermine a bearish theme and highlight a stronger reversal, exposing 111-05+, the May 9 high. A reversal lower would refocus attention on the key support and bear trigger at 109-12+.
BONDS: EGBs-GILTS CASH CLOSE: Ending The Week With Twist Flattening
European curves lightly twist flattened Friday, with long-end instruments continuing to rally.
- Core instruments opened the session relatively flat following Thursday's rally, and drifted higher through the European morning.
- Eurozone inflation data was an early focus, with Germany surprising slightly to the upside, but Spain softer-than-expected (Italy's was in line).
- A risk-off move in equities triggered by US President Trump's accusation that China has "totally violated" their trade agreement helped trigger a safe haven bid, while weaker-than-expected MNI Chicago PMI maintained EGB/Gilt strength.
- After a small retracement as markets eyed month-end, yields closed nearer to their session lows than their highs.
- The German and UK curves both twist flattened. For the week as a whole, curves also twist flattened, with Bunds outperforming Gilts. German 2Y +1.2bp/10Y -6.7bp; UK 2Y +4.0bp/10Y -3.4bp.
- Periphery / semi-core spreads were mixed, with Portugal outperforming.
- Ratings reviews scheduled for after the market close Friday include S&P on France.
Closing Yields / 10-Yr EGB Spreads To Germany
- Germany: The 2-Yr yield is up 0.7bps at 1.776%, 5-Yr is down 0.4bps at 2.064%, 10-Yr is down 0.8bps at 2.5%, and 30-Yr is down 0.7bps at 2.98%.
- UK: The 2-Yr yield is up 2.8bps at 4.023%, 5-Yr is up 1.6bps at 4.144%, 10-Yr is down 0.1bps at 4.647%, and 30-Yr is down 2.4bps at 5.372%.
- Italian BTP spread down 0.1bps at 98bps / Portuguese down 2.3bps at 47.5bps
FOREX: Canadian Dollar Outperforms as BOC Easing Expectations Trimmed
- Some volatile two-way swings for equities had little effect on major currencies Friday, and the USD index looks set to close at unchanged levels on the session, modestly positive on the week. USDJPY remained its volatile self, posting a near 100 pip range across US trade, but broadly consolidates around the 144 handle as we approach the weekend.
- EURUSD has exhibited a stable tone, and the solid bounce from 1.12 on Thursday keeps bullish conditions firmly in play for the pair. On the upside, a break of 1.1419, the May 26 high, would be a bullish development and bolster the underlying trend.
- The most notable strength has been for the Canadian dollar, following a robust set of GDP data across the first quarter and an associated trimming of cut expectations for next week’s BOC. Market pricing now assigns just a ~20% chance of a cut, compared to ~28% prior to today's data.
- Price action backs up the underlying bear trend for USDCAD (-0.64%) - through which a sell-on-rallies theme clearly persists. Barring the corrective bounce earlier in the week, the sequence of lower lows and lower highs. Sights are on 1.3643 next, the Oct 9 2024 low. A phase of USD sales into the Friday month-end fix may have assisted this dynamic. Below here, attention will be on 1.3579, the 1.5 projection of the Feb 3 - 14 - Mar 4 price swing
- Swiss GDP and final eurozone PMIs kick off the economic calendar on Monday, before the focus turns to the US ISM Manufacturing PMI. Fed Chair Powell is also delivering opening remarks at a conference in Washington.
DATA/EVENTS CALENDAR
| Date | GMT/Local | Impact | Country | Event |
| 02/06/2025 | 2300/0900 | ** | S&P Global Manufacturing PMI (f) | |
| 01/06/2025 | 0000/2000 | Fed Governor Christopher Waller | ||
| 02/06/2025 | 0030/0930 | ** | S&P Global Final Japan Manufacturing PMI | |
| 02/06/2025 | 0630/0830 | ** | Retail Sales | |
| 02/06/2025 | 0700/0900 | *** | GDP | |
| 02/06/2025 | 0715/0915 | ** | S&P Global Manufacturing PMI (f) | |
| 02/06/2025 | 0745/0945 | ** | S&P Global Manufacturing PMI (f) | |
| 02/06/2025 | 0750/0950 | ** | S&P Global Manufacturing PMI (f) | |
| 02/06/2025 | 0755/0955 | ** | S&P Global Manufacturing PMI (f) | |
| 02/06/2025 | 0800/1000 | ** | S&P Global Manufacturing PMI (f) | |
| 02/06/2025 | 0830/0930 | ** | BOE Lending to Individuals | |
| 02/06/2025 | 0830/0930 | ** | BOE M4 | |
| 02/06/2025 | 0830/0930 | ** | S&P Global Manufacturing PMI (Final) | |
| 02/06/2025 | 1345/0945 | *** | S&P Global Manufacturing Index (final) | |
| 02/06/2025 | 1400/1000 | *** | ISM Manufacturing Index | |
| 02/06/2025 | 1400/1000 | * | Construction Spending | |
| 02/06/2025 | 1400/1000 | * | Construction Spending | |
| 02/06/2025 | 1400/1000 | Dallas Fed's Lorie Logan | ||
| 02/06/2025 | 1400/1500 | BOE's Mann fireside chat at Fed's IF 75th anniversary conference | ||
| 02/06/2025 | 1530/1130 | * | US Treasury Auction Result for 13 Week Bill | |
| 02/06/2025 | 1530/1130 | * | US Treasury Auction Result for 26 Week Bill | |
| 02/06/2025 | 1630/1830 | ECB Lagarde Video Message at Women In Finance Event | ||
| 02/06/2025 | 1645/1245 | Chicago Fed's Austan Goolsbee | ||
| 02/06/2025 | 1700/1300 | Fed Chair Jerome Powell | ||
| 02/06/2025 | 1700/1800 | BOE Greene Fireside Chat | ||
| 03/06/2025 | 0130/1130 | Business Indicators | ||
| 03/06/2025 | 0130/1130 | Balance of Payments: Current Account | ||
| 03/06/2025 | 0145/0945 | ** | S&P Global Final China Manufacturing PMI |