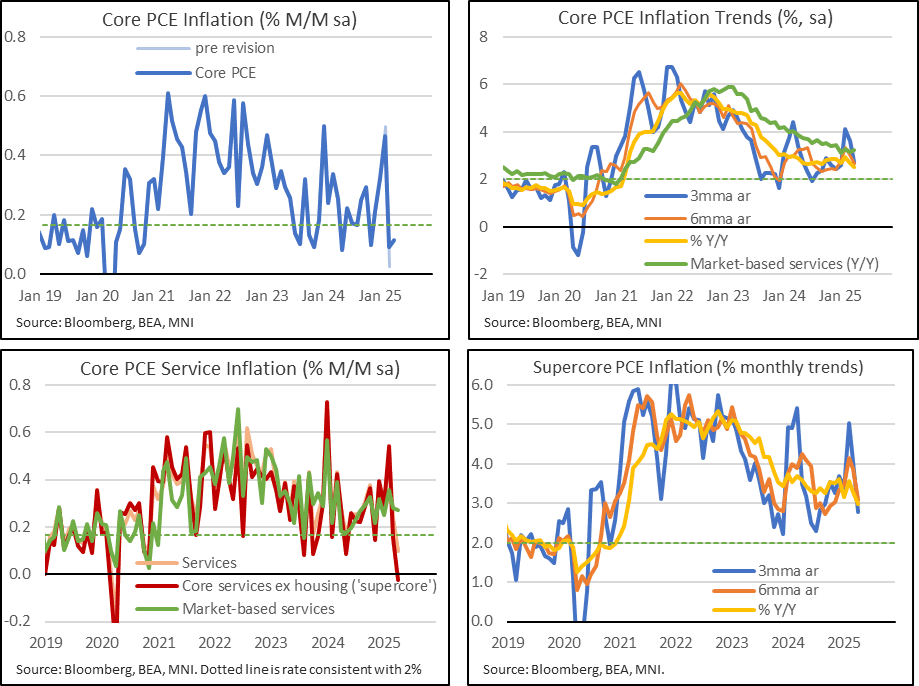
US DATA: Rare Supercore PCE Deflation But Robust Market-Based Metrics
- Core PCE inflation was completely in line with expectations for April on a M/M basis, at 0.116% M/M (unrounded analyst average 0.12).
- It followed a 0.06pp upward revision to 0.09% M/M in March (also roughly as expected after PPI data released mid-month) but with downward revisions earlier in the quarter as we had suspected after yesterday’s Q1 revisions (-0.03pp to 0.465% in Feb, -0.01pp to 0.326% in Jan).
- This marginal sequential firming in core PCE (from 0.09% to 0.12%) came despite a particularly weak core services ex-housing (supercore) at -0.02% M/M in Apr after 0.15% M/M. Supercore last saw M/M deflation in Mar and Apr 2020.
- The core PCE Y/Y meanwhile moderated from 2.67% to 2.52% for a fresh low since Mar 2021.
- Recent run rates are still higher than that but have started to close the gap. The three- and six-month rates both cooled to 2.7% annualized, from 3.6% for the three-month and 3.0% for the six-month, for their lowest since Jan. Having been 0.43pp higher than the Y//Y as recently as Feb, the six-month rate is now 0.14pp higher, pointing to a less troubling recent trajectory.
- A similar trend comparison for supercore PCE inflation sees it on a (slowly) downward path from recently strong rates, with the three-month at 2.8%, six-month at 3.1% and Y/Y at 2.98%. The Y/Y was at 3.57% Y/Y as recently as February.
- One caveat here though when looking at broader services is that market-based services (a measure the Fed has been putting more weight on recently rather than others which include imputed series) still increased a solid 0.27% M/M in April after an upward revised 0.28% M/M (initial 0.15) in March. It left accelerating run rates with 3.7% annualized over three-months, 3.4% over six-months and 3.2% Y/Y, but caution is of course needed when it comes to focusing too heavily on one area.
Want to read more?
Find more articles and bullets on these widgets:
Historical bullets
US DATA: Real GDP Beats Latest Tracking With Solid Private Domestic Demand
Real GDP was close to expectations in the Q1 advance, although to us that in itself was surprising as there hadn’t been enough time for consensus to fully adjust to a sharp increase in consumer imports in March data released the day before on Tuesday. Hiding beneath some significant crosscurrents from net trade and inventories, private domestic demand was surprisingly little changed from its 2024 average but no doubt with question marks over the extent to which it’s been boosted by tariff front-running.
- Real GDP fell -0.3% annualized vs consensus of -0.2%, a median of 26 analyst estimates updated yesterday of -0.8%, and GDPNow gold-adjusted at -1.5%.
- There were some significant crosscurrents relative to GDPNow expectations.
- In a less positive sign, changes in inventories were much stronger than expected as they added 2.25pps to GDP (GDPNow had 0.3pp) for the largest positive contribution since 4Q21. That should be a large drag going ahead.
- It was partly offset by an even larger drag from net exports of -4.8pp (GDPNow -4.05pp gold-adjusted). Ordinarily that surprise amidst particularly firm import growth would be a positive development but tariff front-running clouds interpretation.
- Looking through these noisier categories, underlying demand signs were encouraging with resilient consumption growth and a bounce in non-residential investment.
- Personal consumption increased 1.8% (cons 1.2), adding 1.2pp to quarterly GDP growth (GDPNow saw 0.9pp or 1.4%). That said it’s still a sizeable moderation from 4.0% in Q4 and 3.1% averaged in 2024 and that’s despite some likely tariff front-running.
- Non-residential investment meanwhile saw a large bounce from a weak Q4, rising 9.8% to add 1.3pp to GDP growth (strongest quarter since 2Q23) after -0.4pp.
- Government spending however was surprisingly negative on the quarter, dragging -0.25pp (GDPNow 0.3pp).
- That combination meant that final domestic demand increased 2.3% in Q1 after 3.0% in Q4 but private domestic demand impressively accelerated a touch to 3.0% in Q1 after 2.95% in Q4, having averaged 3.0% in 2024.

GILTS: UK 10yr Yield level update
- A quick update on the UK 10yr Yield after it cleared the initial 4.46% support.
- Most Investors will now be Watching out for any potential extension towards the April and 2025 low at 4.363%.
Today, reference 93.60:
- 4.363% = 94.36.
STIR: U.S. Data Offsets, 97bp Of Fed Cuts Priced Through Dec
Two-way movements in Fed pricing after the latest rounds of data, with the firmer-than-expected Q1 PCE and personal consumption prints, as well as a Q1 GDP release that wasn’t as bad as many expected in the wake of yesterday’s trade data (-0.3% vs. -0.2% in the BBG median, latter deemed stale in light of yesterday’s data), offsetting the softer-than-expected ADP employment release.
- Zooming out, the Q1 data underscores the stagflationary risks evident in the economy.
- Fed Funds show 2.5bp of cuts for May, 16bp through June, 39bp through July, 60.5bp through September, 78.5bp through October and 97.5bp through year-end.
- That compares to 2.5bp, 17bp, 38.5bp, 60bp, 78bp and 97bp ahead of the data.
- Market briefly priced ~99.5bp of Fed cuts through year-end on the back of the ADP reading, before swing back to ~95bp following the Q1 data.
- Focus now moves to March PCE data, due at 10:00 NY/15:00 London.