MNI EUROPEAN MARKETS ANALYSIS: Yen Weakens Post BoJ
- The BoJ left rates on hold as expected, but cut both its inflation and GDP forecasts, while also stating downside risks due to trade uncertainties. JGB futures are richer, while USD/JPY is back above 144.00 this afternoon.
- Aiding gains in USD/JPY has been a further bounce in US equity futures, with better tech earnings driving sentiment. There were a host of earlier headlines around trade talks and potential deals with a number of countries, but nothing concrete. The US trade representative said that deals were likely in weeks, not months, although official discussions with China haven't begun.
- Later April US manufacturing ISM/PMI, Challenger job cuts, March construction and jobless claims print. The UK S&P Global manufacturing PMI for April is also released. Europe is shut.
MARKETS
US TSYS: Asia Wrap - Quiet session
TYM5 has traded sideways within a range of 112-05 to 112-10+ during the Asia-Pacific session. It last changed hands at 112-07, unchanged from the previous close.
- The US 10-year yield is a little higher, dealing around 4.18%, up from its close around 4.16%.
- The US 2-year yield is a little higher, dealing around 3.62%, up from its close around 3.6027%
- Earlier comments from US President Trump touted pledged tech investment into the US, while also re-iterating calls for lower interest rates.
- NVIDIA CEO Jensen Huang: "We're going to build NVIDIA's technology, the next generation of that, all here in the United States. Without the President's leadership, his policies, his support, and very importantly his strong encouragement -- manufacturing in the United States wouldn't have accelerated to this pace."
- BOJ left rates unchanged and sees downside risk to the economy in FY25 and 26.
- The 10-year Yield, drifts back towards the first target of 4.10%. Through this level we could get another wave of demand. Buyers should return on any bounce back towards 4.30%.
- Data/Events : US Initial Jobless Claims, S&P US Man PMI, ISM Man PMI
JGBS: Richer After BoJ's GDP & CPI Forecast Downgrades
JGB futures are sharply higher but off session highs, +49 compared to settlement levels.
- As widely expected, the BoJ left its policy rate unchanged at 0.50%, which was a unanimous decision of 9-0 by the board.
- The economic outlook was downgraded though in terms of both lower GDP and inflation forecasts. It also notes prices and growth risks for the 2025 and 2026 fiscal years rest to the downside.
- The central bank retained its bias that if the outlook is realised it will raise rates further, but the central bank places a caveat on that given extreme uncertainties around the trade outlook.
- Cash US tsys are dealing ~2bps cheaper in today's Asia-Pac session. Today's US calendar will see Initial Jobless Claims, S&P Manf PMI and ISM Manf PMI.
- Cash JGBs are 1-5bps richer on the day across benchmarks out to the 20-year and 1-2bps cheaper beyond. The benchmark 10-year yield is 3.6bps lower at 1.282% versus the cycle high of 1.596%.
- Swaps have twist-steepened with rates 4bps lower to 1bp higher, pivoting at the 30-year.
- Tomorrow, the local calendar will see Jobless Rate, Job-To-Applicant Ratio, Monetary Base and Weekly International Investment Flow data alongside an enhanced liquidity auction for OTR 1-5-year JGBs.
BOJ: Downgrades Both Inflation & GDP Forecasts, Trade Uncertainties Highlighted
As widely expected, the BoJ left its policy rate unchanged at 0.50%, which was a unanimous decision of 9-0 by the board. The economic outlook was downgraded though in terms of both lower GDP and inflation forecasts. It also notes prices and growth risks for the 2025 and 2026 fiscal years rest to the downside. The central bank retained its bias that if the outlook is realized it will raise rates further, but the central bank places a caveat on that given extreme uncertainties around the trade outlook.
- In terms of core inflation forecasts, the 2025 FY was nudged down to 2.2%, from 2.4%, while 2026 is now at 1.7%, form 2.0% prior, while for 2027 it is at 1.9%, so sub the BoJ's 2% inflation goal.
- The core measure which also excludes energy was nudged up for 2025 FY to 2.3%, from 2.1%. The 2026 FY forecast was nudged down to 1.8% from 2.1% prior. For 2027 this metric was forecast at 2.0%.
- On growth, FY 2025 is projected at 0.5% versus 1.1% prior. 2026 at 0.7%, from 1.0% prior and 2027 was at 1.0%.
- The central bank also noted that real yields remain at a significantly low level, i.e. policy rates can rise further but the overall stance is likely to remain accommodative.
- The key lines from statement: ""If our economic and price forecasts are realised, we will continue to raise our policy rate," the BOJ said in a statement.
- "Considering extremely high uncertainties over the future course of trade and other policies in each jurisdiction," however, the BOJ will scrutinise economic price developments and guide policy without pre-conception, it said." (via Rtrs).
- The next policy meeting is in June, and unless we see a very sharp turnaround on the trade/tariff outlook it's difficult to see the central bank raising rates at this meeting. Current market pricing has very little priced in in terms of BoJ tightening to the end of 2025.
AUSSIE BONDS: Modestly Cheaper, Subdued Session, Jun-35 Supply Tomorrow
ACGBs (YM -2.0& XM -3.5) are modestly weaker, with trading relatively subdued.
- There was a $4bn widening in Australia’s merchandise trade surplus in March after narrowing $2.5bn in the previous month. The move to the highest surplus at $6.9bn in over a year was driven by a strong pickup in goods exports driven by Australia’s mining commodities, while imports contracted on the month. Through the volatility though, the trend in the trade surplus is steady.
- Opinion polls continue to point to a return of the incumbent Labor government following Saturday’s federal election but it remains unclear whether it can hold onto its majority, which is likely to depend on developments in a number of individual seats.
- Cash ACGBs are 1-3bps cheaper with the AU-US 10-year yield differential at +2bp.
- Cash US tsys are dealing ~2bps cheaper in today's Asia-Pac session.
- The bills strip is little changed.
- RBA-dated OIS pricing is slightly firmer across meetings today. A 50bp rate cut in May is given a 4% probability, with a cumulative 112bps of easing priced by year-end (based on an effective cash rate of 4.09%).
- Tomorrow, the AOFM plans to sell A$1200mn of the 2.75% 21 June 2035 bond.
AUSTRALIA: Recent Polls Little Changed, Labour Looks Likely To Retain Government
Opinion polls continue to point to a return of the incumbent Labor government following Saturday’s federal election but it remains unclear whether it can hold onto its majority which is likely to depend on developments in a number of individual seats. In the first half of April, the average of surveys had a 2-party preferred breakdown of 53% to 47% in favour of Labor (ALP) and this has barely shifted in the second half of the month at 52.5% to 47.5%.
Australia opinion polls 2-party preferred %
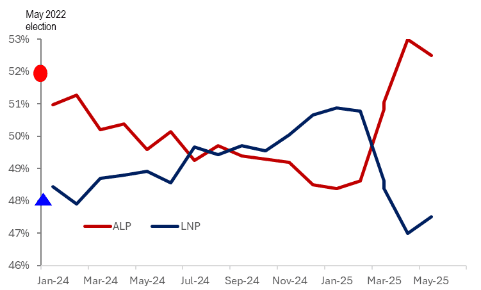
- A poll hasn’t had the LNP in front on a 2-party preferred basis since end March.
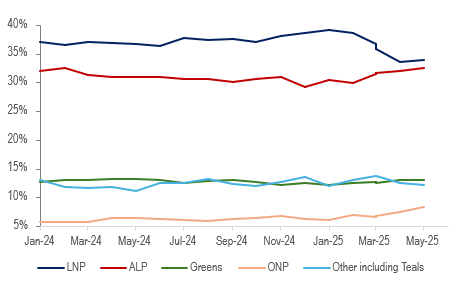
- Polls are signalling that the centre-right opposition LNP could see a drop in its primary vote to around 34% from 36% at the May 2022 election, while the ALP is in line at 33%. The LNP’s vote seems to have shifted to the right-wing One Nation which surveys suggest has seen an increase in support to 8% from a 5% 2022 result. The left-wing Greens are at 13% after 12% in 2022.
- The last election saw a number of green Teals win seats as independents. The “other” vote may be stronger this year with the poll average in the second half of April at 12% after 10% in 2022, but this is down from 14% in March.
Australia opinion polls primary vote %
- The ALP holds 10 seats by less than a 4% margin with 4 under 1%. It is looking to win two Brisbane seats the Greens gained from the LNP in 2022 and hold by less than 4%.
- The LNP has 17 seats with less than 4% but a number of these faced a major independent challenger in 2022. There are 7 with less than 2%, including LNP leader Dutton’s, and could encounter serious competition especially from Teal candidates.
- Independents hold 5 seats by less than 3% including 4 Teals. The Teals won these off the LNP in 2022.
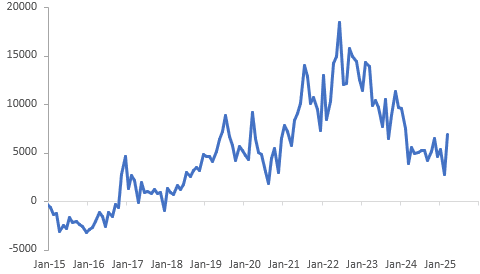
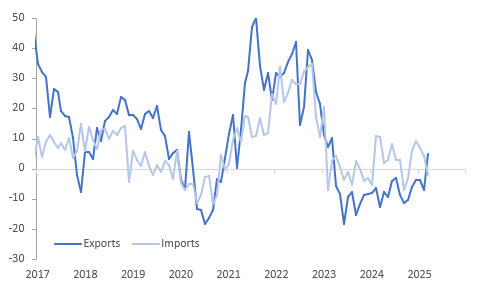
AUSTRALIA DATA: Surplus Widens But Trend Sideways
There was a $4bn widening in Australia’s merchandise trade surplus in March after narrowing $2.5bn in the previous month. The move to the highest surplus at $6.9bn in over a year was driven by a strong pickup in goods exports driven by Australia’s mining commodities, while imports contracted on the month. Through the volatility though, the trend in the trade surplus is steady.
Australia merchandise trade surplus A$mn
- Exports rose 7.6% m/m to be up 5.0% y/y, the first positive in two years. Non-rural goods rose 8.6% m/m, rural fell 8.5% m/m (weakness was broad-based) and non-monetary gold rose 25.9% m/m.
- Imports fell 2.2% m/m to be down 2.1% y/y after +4.2% y/y in February. The weakness was across major categories with consumer goods down 0.7% m/m & 3.3% y/y, capital goods -5.1% m/m & -10% y/y and intermediate -2.1% m/m & -0.4% y/y, possibly signalling continued subdued domestic demand.
- Food & clothing drove the drop in consumer goods, while vehicles rose 3.3% m/m. Machinery, telecoms equipment and other capital goods fell, while ADP equipment and industrial transport rose.
Australia goods exports vs imports y/y%
Source: MNI - Market News/ABS
AUSTRALIA DATA: Q1 Exports To US Up Sharply
While it is too early to see the impact of the 10% tariff on US imports from Australia and 25% on its steel and aluminium, there was a sharp jump in exports to the US in Q1 to beat the deadlines, but there is likely to be some unwind in Q2 due to the new duties and the frontloaded shipments. Export growth to much of Asia improved in March as commodity volumes rose.
Australia merchandise exports by country y/y%
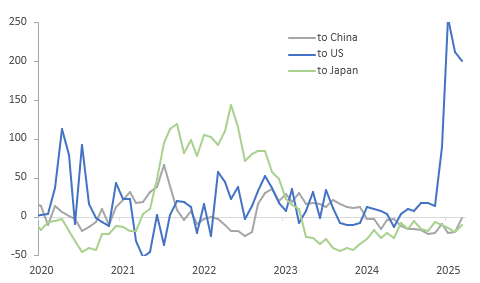
- Goods exports to the US rose 140.5% q/q in Q1 due to tariff fears was up 200% y/y in March. The US is a relatively small export destination for Australia worth 4.6% of total exports in 2024 compared to 34.6% for China.
- Shipments to China have been weak but rose sharply in March, as they usually do, and are now down only 2.4% y/y after -20.4% y/y in February. There were sharp increases in the volume of iron ore shipped to China but also coal was higher.
- Japan and Korea increased their purchases of Australian iron ore and coal, while India saw a large increase in the latter.
- Total export values to Japan were still down 11.4% y/y but improved from -20.2%, while to Korea they are up 3.7% y/y after +13.3% y/y. Shipments to India rose 30.2% y/y.
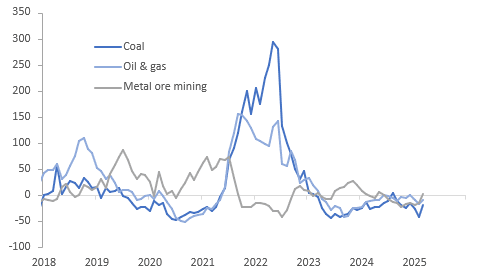
- Double-digit volume increases in iron ore, coal and LNG far outweighed broad-based declines in unit values. Overall export values of metal ores rose 11.6% m/m, coal +10.7%, other mineral fuels +4.2%, metals +3.0% and other manufactures +13.3%. Annual growth in commodity exports remains soft though.
Australia commodity exports y/y%
BONDS: NZGBS: Closed With A Modest Twist-Steepener, US Claims & PMI Data Due
NZGBs closed showing a modest twist-steepener, with benchmark yields 1bp lower to 1bp higher.
- NZ-US and NZ-AU 10-year yield differentials were unchanged on the day.
- Cash US tsys are dealing ~2bps cheaper in today’s Asia-Pac session. Today’s US calendar will see Initial Jobless Claims, S&P Manf PMI and ISM Manf PMI.
- Today’s local supply showed moderate demand with cover ratios ranging from 2.84x (May-54) to 3.77x (May-30).
- “The New Zealand unemployment rate is expected to rise to 5.3% in the March quarter from 5.1% in the December 2024 quarter as job growth is not fast enough to meet population growth, Westpac said in a Wednesday report.” (MT Newswires). The Q1 Employment is due next Wednesday.
- Swap rates closed flat to 3bps higher, with the 2s10s curve steeper and implied swap spreads wider.
- RBNZ dated OIS pricing closed flat to 4bps firmer across meetings, with early 2026 leading. 26bps of easing is priced for May, with a cumulative 81bps by November 2025.
- Tomorrow, the local calendar will see Building Permits data.
FOREX: G10 Wrap - Can The USD Catch Up With Stocks ?
The BBDXY has had an Asian range of 1223.83 - 1226.48, Asia is currently trading around 1226. Bloomberg - “The EU is planning to present a package of proposals to the US next week that would lower trade and non-tariff barriers, boost investments in the US and bolster purchases of US LNG and tech, people familiar said. The bloc is also moving forward with retaliatory measures should negotiations fail.” The unchanged decision from the BOJ today was well expected, but the downgrade to both GDP and inflation forecasts is weighing, particularly in terms of likely further rate hikes. The next focus point will be Governor Ueda's press conference a little later on.
- EUR/USD - Asian range 1.1300 - 1.1332, Asia is currently trading 1.1310. Intra-day support is around 1.1300, should this area not hold demand should remerge on dips back to 1.1100. Month end USD demand could have contributed to the overnight price action but with risk outperforming a sustained move below 1.1300 could see some longs pared back.
- GBP/USD - Asian range 1.3293 - 1.3333, the GBP momentum seems to be stalling towards the decent Weekly resistance around 1.3500. Intra-day support is around the 1.3250 area, then the pivotal 1.30/31 support is next.
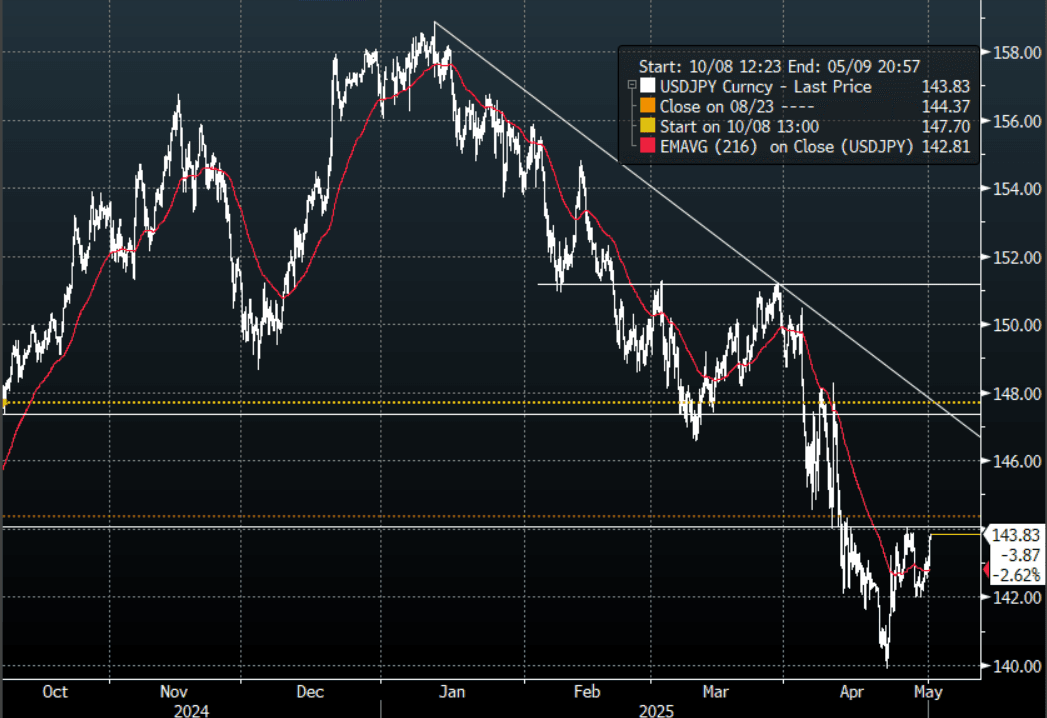
- USD/JPY - Asian range 142.88 - 143.82, has drifted higher for most of the Asia session after the BOJ downgrades weigh on sentiment. Watch for a break back above 144.00 which could trigger some shorts to pare back, then more importantly the 145/146 area which should once more offer good levels for sellers to reengage.
- USD/CNH - Asian range 7.2664 - 7.2779, Onshore market was closed for Labor Day holidays. Will need to get back above 7.3000 again to start thinking about moving higher again. The longer it stays below there the higher the chance of weaker longs being forced to pare back exposure.
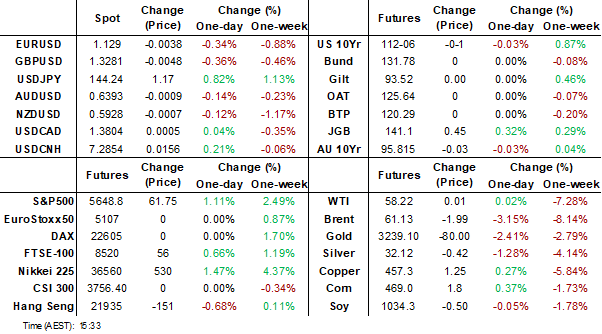
- Cross asset : SPX +1.07%, Gold $3226, US 10-Year yield 4.17%, BBDXY 1226, Crude oil $58.13.
- Data/Events : US Initial Jobless Claims, S&P US Man PMI, ISM Man PMI
Fig 1: USD/JPY Spot Hourly Chart
Source: MNI - Market News/Bloomberg
FOREX: Antipodean Wrap - AUD & NZD Outperform In The Crosses
This Asian session has seen another decent leg higher in risk as Microsoft and Meta beat earning expectations. The BOJ left rates unchanged and downgraded both inflation and GDP forecasts. The AUD and NZD continue to benefit from the better outlook for risk.
- AUD/USD - Asian range 0.6389 - 0.6427, the AUD is currently dealing around 0.6410. AUD continues its attempts to hold onto its gains above 0.6400, managing to shrug off the bounce in the USD for now. While the support around 0.6350 holds the focus will be on building upward momentum. Should 0.6350 break shorts will be keen to add again.
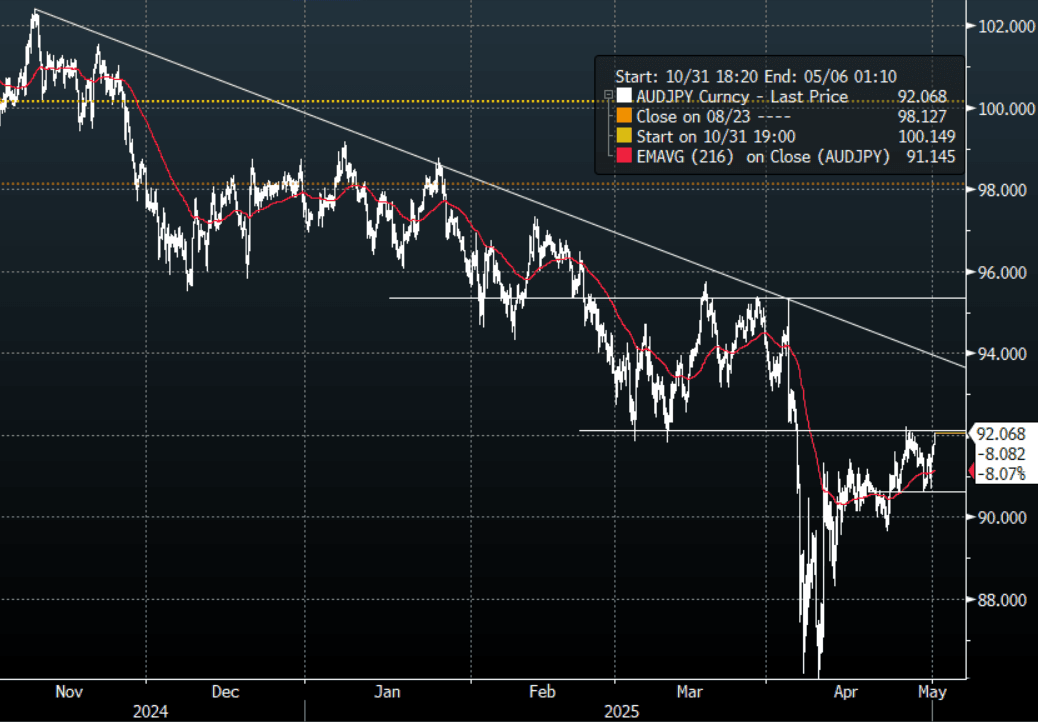
- AUD/JPY - Asian range 91.35 - 92.06. Price goes into the London trading around 92.04, testing the upper boundary of the 0.8950/0.9200 range. If risk remains on the front foot there is a chance we see this gain momentum above 0.9200.
- NZDUSD - Asian range 0.5930 - 0.5951, going into London trading around 0.5940. Demand should return first around 0.5900, then around the 0.5800 area.
- AUD/NZD - Asian range 1.0760 - 1.0801, the Asian session currently trading 1.0785. Sellers are capping the 1.0800 area for now, expect more supply towards 1.0850.
Fig 1 : AUD/JPY Spot Hourly Chart
Source: MNI - Market News/Bloomberg
OIL: Crude Holds Onto Week’s Losses, WTI Finding Support at $58 & Brent At $61
Oil prices are moderately lower again today after falling sharply over the week and are now down more than 7% this week as the market remains nervous about the impact of tariffs on global demand and will watch today’s US April manufacturing PMI data and Friday’s payrolls closely for early signs of their impact. Q1 US GDP contracted as imports jumped. The USD index is 0.2% higher, which is likely also to be weighing on dollar-denominated crude.
- WTI is down 0.2% to $58.11/bbl off the intraday low of $58.01. It appears to find support at $58, with only a brief move below on Wednesday. Brent is 0.1% lower at $61.02/bbl after a trough of $60.91 with moves below $61 difficult to hold.
- OPEC meets on Monday to decide its production quotas from June. Following its larger-than-expected increase in April which amounted to 3 months of increases in one, Reuters reported that Saudi Arabia is not overly concerned about lower prices suggesting that it may focus on market share instead.
- Later April US manufacturing ISM/PMI, Challenger job cuts, March construction and jobless claims print. The UK S&P Global manufacturing PMI for April is also released. Europe is shut.
- Gold’s decline continued in the Asian trading day, having opened at US$3,288.73.
- Following a mixed bag of US economic data last night confused signals and sent gold lower after an unexpected contraction in GDP was followed by Core PCE and strong pending home sales questioned whether rate cuts were imminent.
- Much of gold's rise can be attributed to it's 'safe haven status' and as US Treasury Secretary Bessent indicates that some trade deals are about to be announced, gold has the potential to fall further from here.
- Gold lost further ground today down -1.7% to $3,229.25
- Having reached a new high earlier in April of $3,423.98 gold has retreated over 5% since.
- Year to date gold remains one of the best performing assets up over 23% but as hedge fund positioning has turned more neutral it seems likely to be in for a period of consolidation as the world assesses the next phase of the trade war.
ASIA STOCKS: Strong Inflows Continue for India
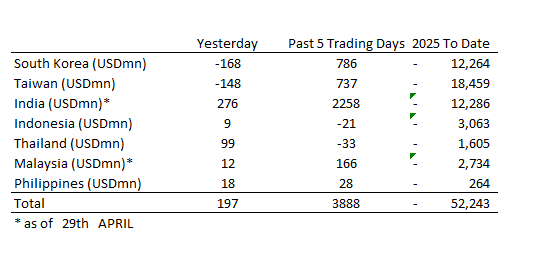
Strong inflows continue with India topping US$2bn of inflows over the last five days.
- South Korea: Recorded outflows of -$168m as of yesterday, bringing the 5-day total to +$786m. 2025 to date flows are -$12,264m. The 5-day average is +$157m, the 20-day average is -$300m and the 100-day average of -$138m.
- Taiwan: Had outflows of -$148m as of yesterday, with total inflows of +$737m over the past 5 days. YTD flows are negative at -$18,459. The 5-day average is +$147m, the 20-day average of -$8m and the 100-day average of -$198m.
- India: Had inflows of +$276m as of the 29th, with total inflows of +$2,258m over the past 5 days. YTD flows are negative -$12,286m. The 5-day average is +$452m, the 20-day average of +$87m and the 100-day average of -$121m.
- Indonesia: Had inflows of +$9m as of yesterday, with total outflows of -$21m over the prior five days. YTD flows are negative -$3,063m. The 5-day average is -$4m, the 20-day average -$52m and the 100-day average -$37m
- Thailand: Recorded inflows of +$99m as of yesterday, outflows totaling -$33m over the past 5 days. YTD flows are negative at -$1,605m. The 5-day average is -$7m, the 20-day average of -$24m the 100-day average of -$19m.
- Malaysia: Recorded inflows of +$12m as of the 29th, totaling +$166m over the past 5 days. YTD flows are negative at -$2,734m. The 5-day average is +$33m, the 20-day average of -$25m and the 100-day average of -$35m.
- Philippines: Saw inflows of +$18m as of yesterday, with net inflows of +$28m over the past 5 days. YTD flows are negative at -$264m. The 5-day average is +$6m, the 20-day average of -$2m the 100-day average of -$4m.
SOUTH KOREA: Exports Not Showing Tariff Impact Yet
- South Korea’s April exports rose +3.7% YoY, up from +3.0% in March and topping US$58bn.
- Imports declined by -2.7% to just $53bn but the decline was much less than anticipated by surveys.
- However, when seasonally adjusted April’s export growth was a mere +0.7% indicating that the 10% tariff levied on the country is having an impact. That tariff is expected to increase to 25% after a recently announced 3-month grace period in which Korean officials are frantically negotiating a trade deal.
- The challenge for the Korean economy will be their auto sector with over 40% of exports from the major Korean car companies going to the US.
- Ahead of the upcoming Presidential election Korea’s trade minister has been in Washington for talks on a trade deal and US Treasury Secretary Bessent has indicated that an announcement could be forthcoming following the meetings.
THAILAND: BoT Sees Significant Risks To Growth From Trade Policies
The Bank of Thailand (BoT) cut rates 25bp to 1.75% as expected in a 5 to 2 vote. The move was driven by a lower growth outlook with risks skewed to the downside, tight financial conditions and inflation expected to stay below the bottom of the 1-3% band. It reiterated the need for structural reforms saying that “a combination of complementary policies to enhance” competitiveness would be required.
- The two dissenting members voted for no change to retain policy space so that the timing of easing could be optimised.
- Thailand’s growth in 2025 has been revised down even under a best case scenario driven by the trade and tourism sectors, as global growth slows. Previously BoT expected Thai growth to be around 2.5% but if US tariffs stay close to where they are now it believes growth will be about 2%. If they are higher though, BoT estimates only 1.3% in 2025.
- Given heightened uncertainty, it will continue to monitor trade developments globally (including retaliation to US policy) but also financial markets and the baht, which have been functioning normally.
- Headline inflation is projected to be below 1% due to government subsidies and lower global oil prices. Core though should be steady – it printed at 0.9% y/y in March.
- As financial conditions tightened, lending growth and credit quality deteriorated and BoT will monitor the impact of global trade disruption on vulnerable households and businesses.
- See press release here.
UP TODAY (TIMES GMT/LOCAL)
| Date | GMT/Local | Impact | Country | Event |
| 01/05/2025 | 0630/0830 | ** | Retail Sales | |
| 01/05/2025 | 0830/0930 | ** | BOE Lending to Individuals | |
| 01/05/2025 | 0830/0930 | ** | BOE M4 | |
| 01/05/2025 | 0830/0930 | ** | S&P Global Manufacturing PMI (Final) | |
| 01/05/2025 | - | *** | Domestic-Made Vehicle Sales | |
| 01/05/2025 | 1230/0830 | *** | Jobless Claims | |
| 01/05/2025 | 1230/0830 | ** | WASDE Weekly Import/Export | |
| 01/05/2025 | 1345/0945 | *** | S&P Global Manufacturing Index (final) | |
| 01/05/2025 | 1400/1000 | *** | ISM Manufacturing Index | |
| 01/05/2025 | 1400/1000 | * | Construction Spending | |
| 01/05/2025 | 1430/1030 | ** | Natural Gas Stocks | |
| 01/05/2025 | 1530/1130 | * | US Bill 08 Week Treasury Auction Result | |
| 01/05/2025 | 1530/1130 | ** | US Bill 04 Week Treasury Auction Result | |
| 02/05/2025 | 0130/1130 | * | Producer price index q/q | |
| 02/05/2025 | 0130/1130 | *** | Retail trade quarterly | |
| 02/05/2025 | 0130/1130 | ** | Retail Trade | |
| 02/05/2025 | 0630/0730 | DMO to announce details of long syndication for W/C 19 May | ||
| 02/05/2025 | 0715/0915 | ** | S&P Global Manufacturing PMI (f) | |
| 02/05/2025 | 0745/0945 | ** | S&P Global Manufacturing PMI (f) | |
| 02/05/2025 | 0750/0950 | ** | S&P Global Manufacturing PMI (f) | |
| 02/05/2025 | 0755/0955 | ** | S&P Global Manufacturing PMI (f) | |
| 02/05/2025 | 0800/1000 | ** | S&P Global Manufacturing PMI (f) | |
| 02/05/2025 | 0900/1100 | *** | HICP (p) | |
| 02/05/2025 | 0900/1100 | ** | Unemployment | |
| 02/05/2025 | 1130/2030 | * | Labor Force Survey | |
| 02/05/2025 | 1230/0830 | *** | Employment Report |