MNI EUROPEAN MARKETS ANALYSIS: USD/JPY Above 156.00
- Q4 NZ jobs data was mixed (better jobs growth but a higher unemployment rate). The heat has come out of the recent move up in NZ yields, while NZD/USD faltered above 0.6060 (although the pullback has been shallow).
- USD/JPY continues to recover, now above 156.00, as the election looms. Gold and silver have continued to rise as well, with AUD outperforming the softer NZD trend.
- Looking ahead, we get EU Jan CPI. In the US, despite the BLS data delays, both US ADP and ISM Services are scheduled on Wednesday’s calendar.
MARKETS
US TSYS: Neutral Bias Remains, Despite Yields Near 1 Month Highs
The US 10-Yr future traded in a 111-17+ to 111-21+ range today, treading water for much of the day even as many major equity bourses weakened. The 10-Yr moved lower initially but stabilized at 111-19+, just below its opening level of 111-20
Front end cash was flat with longer dated USTs only modestly higher in yield, having on a weak tone but with some modest improvement as equities stalled.
- The 2-Yr up +0.2bps to 3.574%
- The 5-Yr is up +0.2bps to 3.837%
- The 10-Yr up +0.6bps to 4.274%
- The 30-Yr up +0.6bps to 4.902%
US equity futures are point pointing to a mixed start at this stage, and with Friday's NFP delayed, focus turns to the treasury refunding announcement, though not markets not expecting any surprises. There will be a US$17bn 17-week auction.
Investors remain sensitive to shifts in the "Fed regime" as the transition toward Warsh approaches. Bostic speaks Wednesday and markets will look for guidance on how the committee views the recent bounce in manufacturing activity .
ADP Employment change is key, with private sector employment is expected to show an increase of 45k for January, up from December's gain of 41,000.
This ISM Services Index is forecast to drop to 53.5 (from 54.4 in December). Markets will closely watch the Prices sub-index (forecast at 64.0) for signs of cooling inflationary pressure.
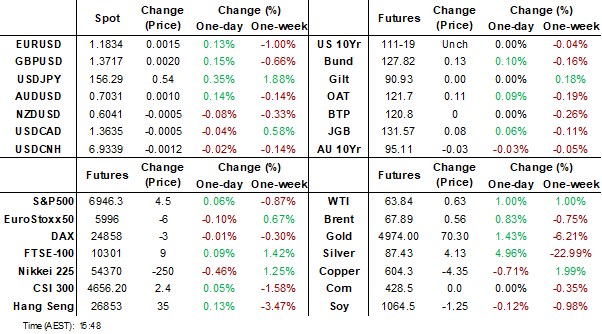
JGBS: Modest Rally Across Curve, 5Y Remains Vulnerable, 30Y Supply Tomorrow
JGB futures are stronger, +12 compared to settlement levels.
- Cash JGBs are 1-2bps richer across benchmarks, with the futures-linked 7-year outperforming.
- After Tuesday’s underwhelming 10-year auction, where the bid-to-cover ratio fell below its 12-month average, attention turns to tomorrow's 30-year supply.
- The yield curve remains near its steepest on record, although it has traded within a well-defined range since mid-2025.
- Since late last year, the 2s/5s segment has seen the most pronounced steepening, with the 5-year sitting in a relatively unfavoured part of the curve. Several factors continue to weigh on the 5-year sector:
- A potential fiscal boost under a Takaichi administration would imply increased debt supply, adding pressure to the sector.
- The threat that renewed yen weakness could bring forward BOJ rate hikes relative to current pricing.
- The 5-year has recently been, and is likely to remain, a preferred duration to short for more aggressive traders. In particular, the strategy of shorting 5-year versus 30-year bonds to express flattening themes appears to have further room to run as the BOJ moves closer to another hike.
- Swap rates are 1-2bps lower.
- Tomorrow, the local calendar will see Weekly International Investment Flow data.
Source: Bloomberg Finance LP
AUSSIE BONDS: Post-RBA Weakness Remains
ACGBs (YM -4.0 & XM -3.0) are weaker, having extended yesterday’s post-RBA sell-off. ACGB futures are 3-7bps weaker than yesterday’s pre-RBA levels, with a flatter curve. Nevertheless, futures remain above yesterday’s intraday lows
- See MNI RBA Review here.
- Cash US tsys are slightly cheaper in today’s Asia-Pac session.
- Cash ACGBs are 3-4bps cheaper with the AU-US 10-year yield differential at +59bps.
- Today’s auction result extended the trend of firm pricing for ACGBs, with the weighted average yield printing 0.16bps through prevailing mids, according to Yieldbroker. Moreover, demand was stronger, as reflected by a cover ratio of 3.7250x, up from the prior 3.1950x.
- The increase in demand came with the bond’s outright yield at its cycle high, ~15bps higher than the previous outing. However, the 3/10 yield curve was around its flattest level since late 2024, approximately 40bps flatter than at the time of its syndicated sale.
- The AOFM plans to sell A$800mn of the 1.00% 21 December 2030 bond on Friday.
- The bills strip has bear-steepened, with pricing -1 to -4 across contracts.
- RBA-dated OIS pricing is firmer again today across meetings, extending yesterday’s post-RBA decision sell-off. Currently, pricing is 6-10bps firmer across meetings than pre-RBA level.
- Tomorrow, the local calendar will see Trade Balance.
RBA: MNI RBA Review-Feb 2026: Further Tightening Likely Needed
EXECUTIVE SUMMARY:
- The RBA raised the cash rate to 3.85%, as expected by the sell-side consensus and which was largely priced by the market (around 75% priced in per OIS markets prior to the decision). The decision was unanimous by the board. The risks appear skewed towards further action to ensure that inflation moves sustainably back into the target band of 2-3%.
- RBA-dated OIS pricing is firmer again today across meetings, extending yesterday’s post-RBA decision sell-off. That leaves RBA-dated OIS showing tightening across all meetings, with the probability of a 25bp hike rising from 17% for March to 105% by June and 172% by December 2026.
- Full preview at this link:
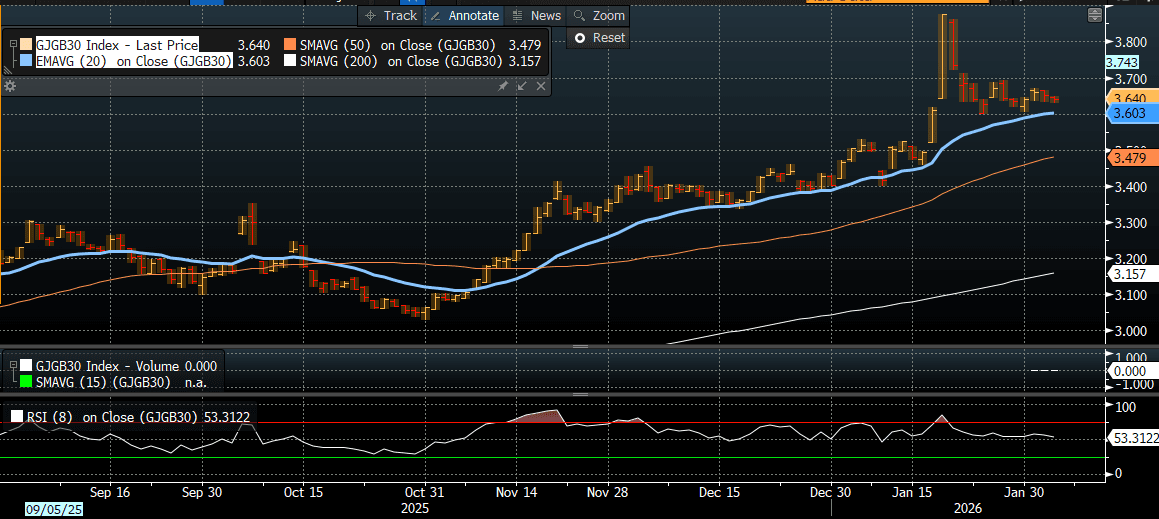
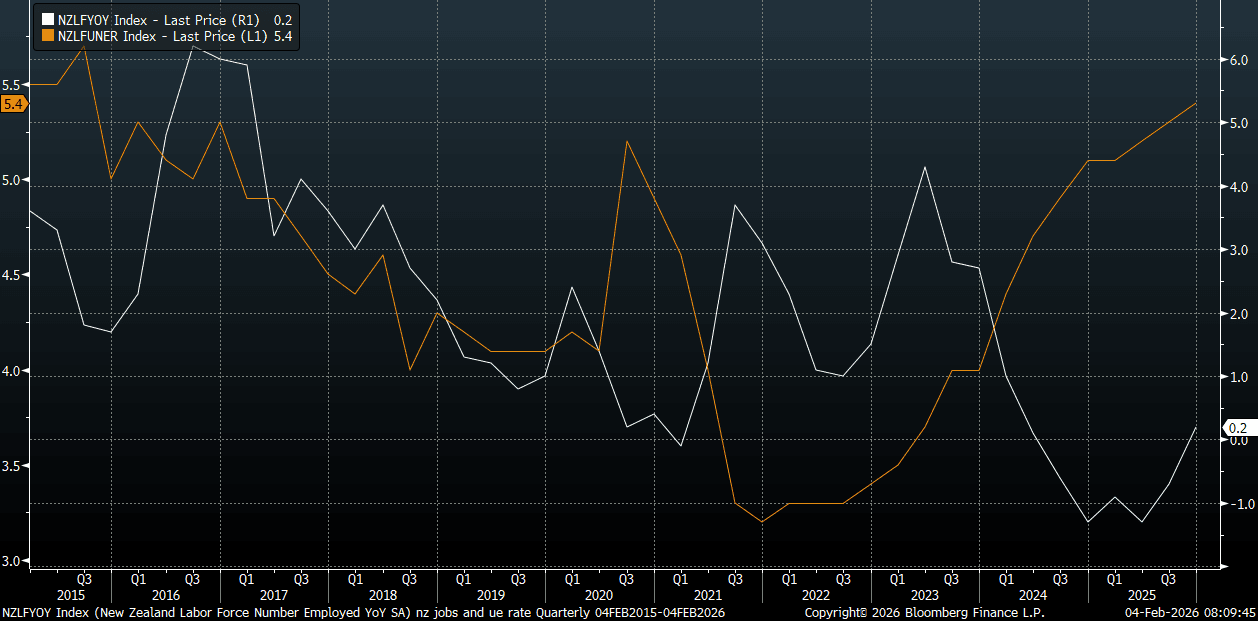
BONDS: NZGBS: Q4 Jobs Report Extends Rally
NZGBs closed 4-5bps richer after today’s Q4 Employment Report.
- NZ-US and NZ-AU 10-year differentials finished 3bps lower.
- The NZ Q4 jobs report was a mixed bag. On the positive side, the jobs growth picture was better than forecast, rising 0.5%q/q, versus 0.3% forecast and flat in Q3. This was the strongest q/q rise since Q2 2023. It also bought the y/y pace back to positive territory at 0.2% from a revised 0.7%y/y fall in Q3.
- The unemployment rate edged up to 5.4%, above both the market consensus and RBNZ forecast of 5.3%. The participation rate rose to 70.5%, versus 70.3% forecast. Arguably we would have needed to see a combination of stronger jobs growth and a lower unemployment rate to get the market more excited about a potentially earlier 2026 rate hike from the RBNZ.
- Swap rates closed 5-7bps lower, with a steeper 2s10s curve.
- RBNZ-dated OIS pricing closed softer for late 2026 meetings. No tightening is priced for February, while December 2026 assigns 46bps, 5bps softer than yesterday’s close.
- Tomorrow, the local calendar will see Cotality Home Value data.
- The NZ Treasury also plans to sell NZ$225mn of the 4.50% May-30 bond, NZ$175mn of the 4.25% May-34 bond and NZ$50mn of the 5.00% May-54 bond.
Bloomberg Finance LP
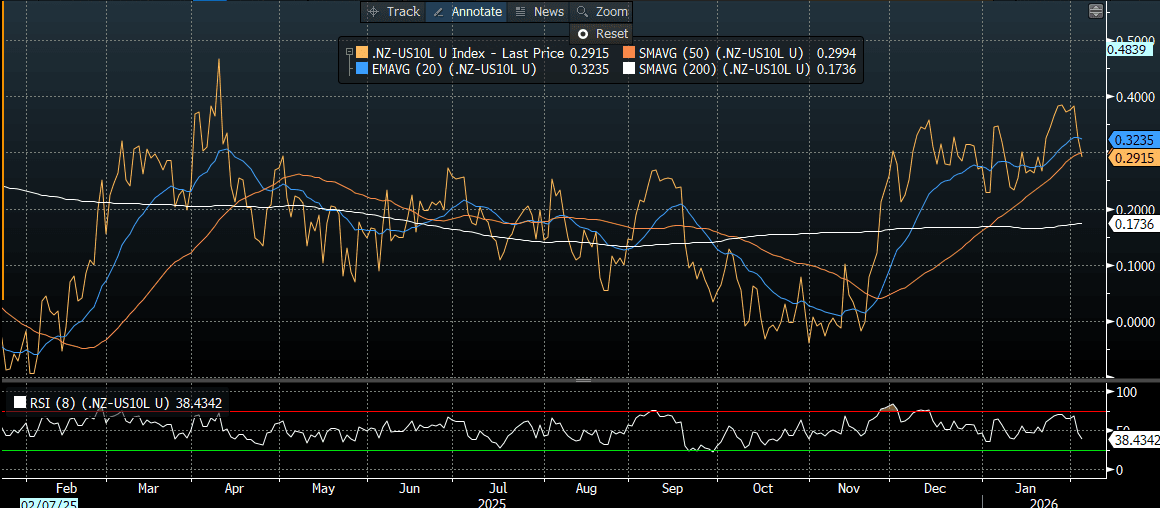
NEW ZEALAND: Firmer Jobs Growth Offset By Higher U/E Rate, RBNZ Likely On Hold
The NZ Q4 jobs report was a mixed bag. On the positive side, the jobs growth picture was better than forecast, rising 0.5%q/q, versus 0.3% forecast and flat in Q3. This was the strongest q/q rise since Q2 2023. It also bought the y/y pace back to positive territory at 0.2%, which was also above expectations and from a revised 0.7%y/y fall in Q3. The unemployment rate edged up to 5.4%, above both the market consensus and RBNZ forecast of 5.3%. The participation rate rose to 70.5%, versus 70.3% forecast (which was also the prior outcome). Arguably we would have needed to see a combination of stronger jobs growth and a lower unemployment rate to get the market more excited about a potentially earlier 2026 rate hike from the RBNZ.
- The data suggests that the better economic tone for NZ through late 2025 aided jobs growth, but is yet to erode spare capacity in terms of the unemployment rate. The chart plots the y/y jobs growth figure (the white line) and the unemployment rate (orange line). The unemployment rate in Q4 was at its highest since 2015.
- Stats NZ Noted: "underutilisation rate was unchanged at 13.0 percent", while on wages, "The labour cost index (LCI) all salary and wage rates (including overtime) increased 2.0 percent in the year ended December 2025, while the unadjusted LCI increased 3.3 percent."
- The labour cost index is down slightly from Q3's pace of 2.1%y/y. This remains well off 2023/24 highs above 4%y/y.
Fig 1: NZ Jobs growth Y/Y (White Line) & Unemployment Rate (Orange Line)
Source: Bloomberg Finance L.P./MNI
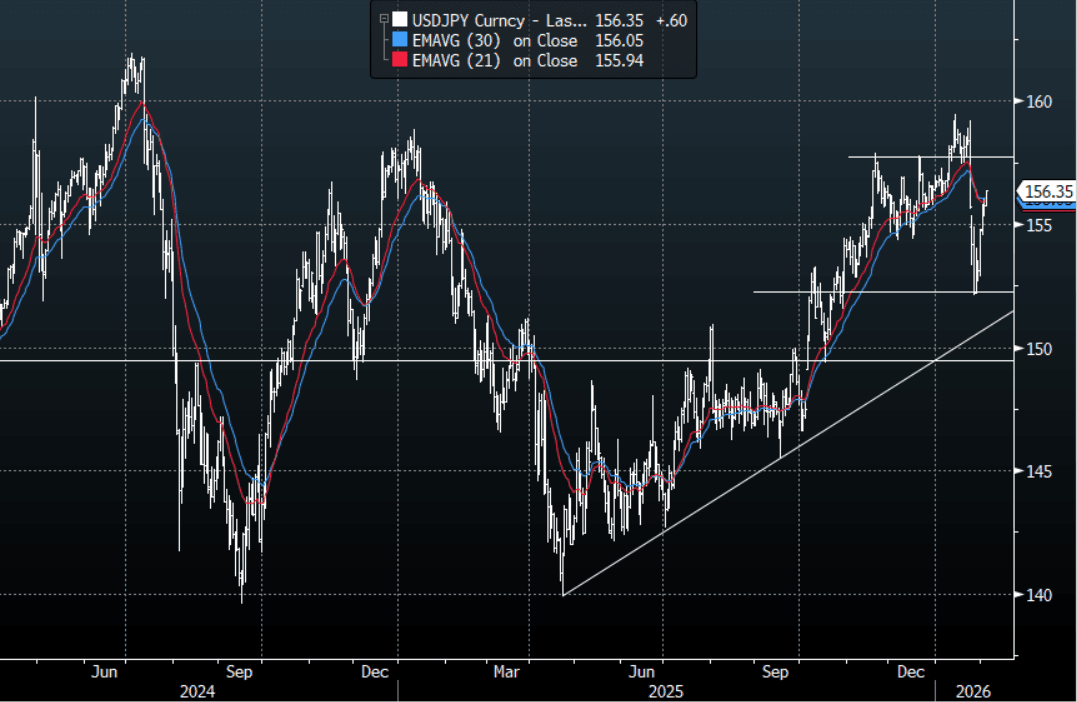
JPY: USD/JPY - Drifts Above 156.00 As The Election Looms
The USD/JPY range today has been 155.70 - 156.39 in the Asia-Pac session, it is currently trading around 156.35. USD/JPY continues to grind back up as we get closer to the weekend elections. A large portion of the leveraged short Yen positions being built up heading into the elections would have been washed out thanks to the Fed/MOF rate check after the BOJ rate decision. This large move lower was more down to overextended positioning than fundamentals and as we head toward this weekend's election all the reasons for the Yen short will come back to the fore. This should see USD/JPY which has lost its immediate upward momentum remain well supported on dips as the market looks toward the 160.00 area once again. Resistance on the day should be around 156.50-157.00 and support is back towards the 155.00 area.
- “Hedge funds are reviving bets against the yen and positioning for renewed weakness as Japan heads into a pivotal election.” - BBG
- Options : Close significant option expiries for NY cut, based on DTCC data: 153.25($801m), 159.50($769m). Upcoming Close Strikes : 153.00($1.59b Feb 5), 154.00($1.13b Feb 5) - BBG.
- The USD/JPY Average True Range(ATR) for the last 10 Trading days: 145 Points
Fig 1 : USD/JPY Spot Daily Chart
Source: MNI - Market News/Bloomberg Finance L.P
FOREX: USD - Treading Water Around The 1190 Area In BBDXY
The BBDXY has had a range today of 1187.30 - 1188.85 in the Asia-Pac session; it is currently trading around 1188. Risk could not hold onto the ISM gains and has quickly given them up as the rotation out of Tech picks up pace. The USD is treading water around the 1190 area and it is still tough to have any strong conviction on its next medium term direction. I suspect that bounces will continue to find sellers in the short-term as the USD still has few friends, but the caveat being if we do have some sort of a correction in Stocks will the USD safe haven bid come back ? The market is not positioned for this. On the day, the first resistance is toward the 1193-1198 area and then more importantly back above 1200 where I suspect sellers could return.
- EUR/USD - Asian range 1.1809-1.1832, Asia is currently trading 1.1830. Price action has left an ugly bearish shadow on the weekly chart, but we are approaching levels that should start to see some buyers return. On the day, the support remains between the 1.1760-1.1790 area, a move through here could signal a deeper reversion back to the important 1.1700 area where I suspect buyers would again be around. I suspect a bounce back toward the 1.1870-1.1910 area would find sellers first up as the pair looks to consolidate as the market tries to get some conviction on how it thinks the USD will trade from here.
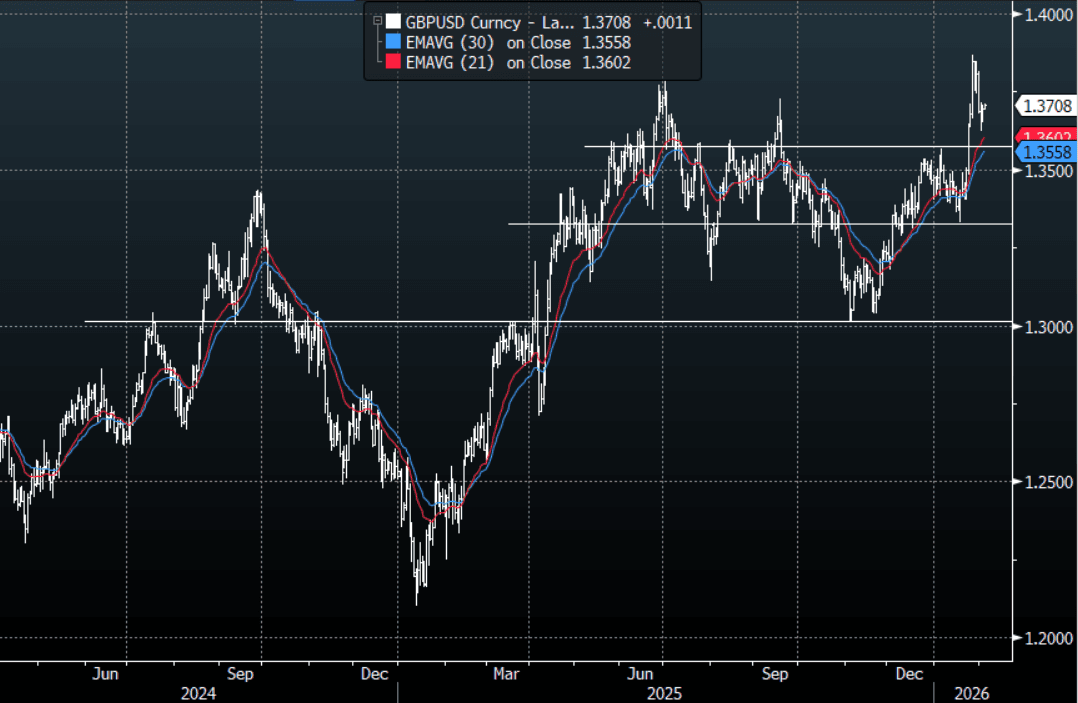
- GBP/USD - Asian range 1.3691-1.3713, Asia is currently dealing around 1.3710. The pair like everything else had an ugly weekly close leaving a clear rejection of the 1.3850 area. On the day, first support is 1.3600-1.3650 then the 1.3500 area.
- Cross asset : SPX +0.05%, Gold $5060, US 10-Year 4.27%, BBDXY 1188, Crude Oil $63.80
- Data/Events : Italy HCOB Italy Services PMI/CPI, Spain HCOB Spain Services PMI, France HCOB France Services PMI, Germany HCOB Germany Services PMI, EZ HCOB Eurozone Services PMI/PPI/CPI
Fig 1: GBP/USD Spot Daily Chart
Source: MNI - Market News/Bloomberg Finance L.P
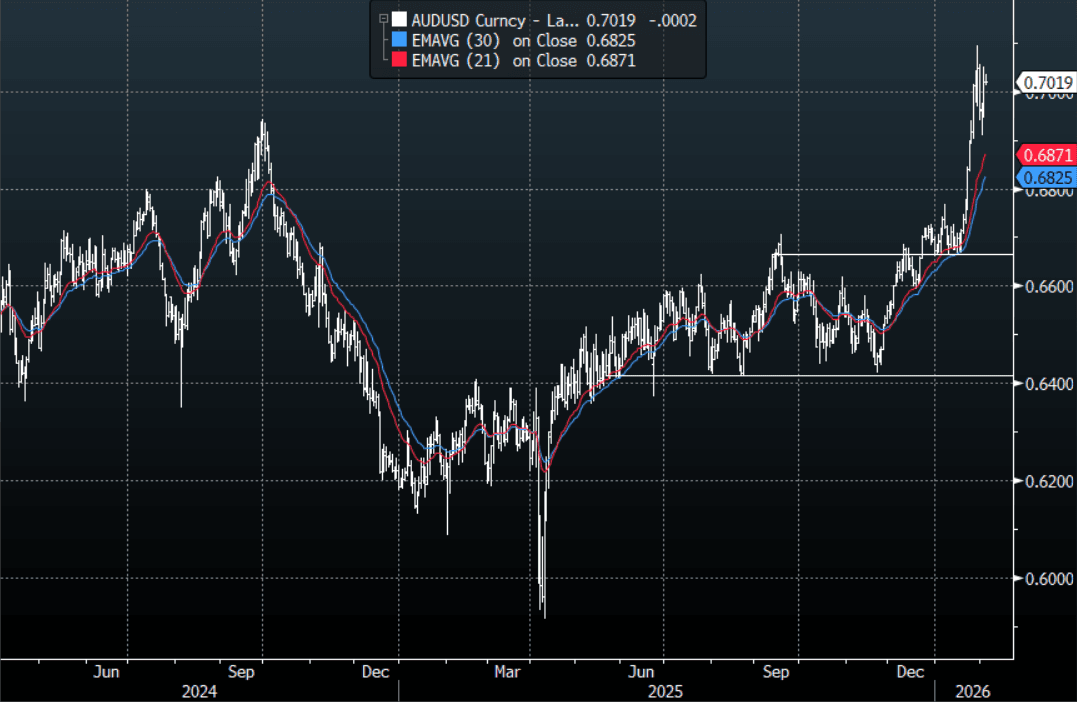
AUD/USD - Holding Above 0.7000
The AUD/USD has had a range today of 0.7013 - 7036 in the Asia- Pac session, it is currently trading around 0.7020. The AUD is holding above 0.7000 for now even as stocks have another pullback from their highs stalling the pairs upward momentum momentarily. The AUD has been outperforming across the board as leveraged funds increased their longs anticipating yesterday's hike, I suspect these trades will now begin to be added to as further hikes are priced in. On the day, the first buy-zone is toward the 0.6970-0.7000 area, if this does not hold we could see a deeper pullback toward 0.6900 where I suspect buyers could be lining up. The AUD is looking to regain its upward momentum to test the pivotal 0.7100-0.7200 and potentially extend higher from there.
- MNI RBA Review-Feb 2026: Further Tightening Likely Needed: The RBA raised the cash rate to 3.85%, as expected by the sell-side consensus and which was largely priced by the market. The decision was unanimous by the board. The risks appear skewed towards further action to ensure that inflation moves sustainably back into the target band of 2-3%.
- RBA-dated OIS pricing is firmer again today across meetings, extending yesterday's post-RBA decision sell-off. That leaves RBA-dated OIS showing tightening across all meetings, with the probability of a 25bp hike rising from 17% for March to 105% by June and 172% by December 2026.
- Options : Closest significant option expiries for NY cut, based on DTCC data: 0.6950(AUD1.96b). Upcoming Close Strikes : 0.6860(AUD1.51b Feb 9), 0.6875(AUD913m Feb 6), 0.6900(AUD1.64b Feb 9) - BBG
- The AUD/USD Average True Range for the last 10 Trading days: 84 Points
Fig 1: AUD/USD spot Daily Chart
Source: MNI - Market News/Bloomberg Finance L.P
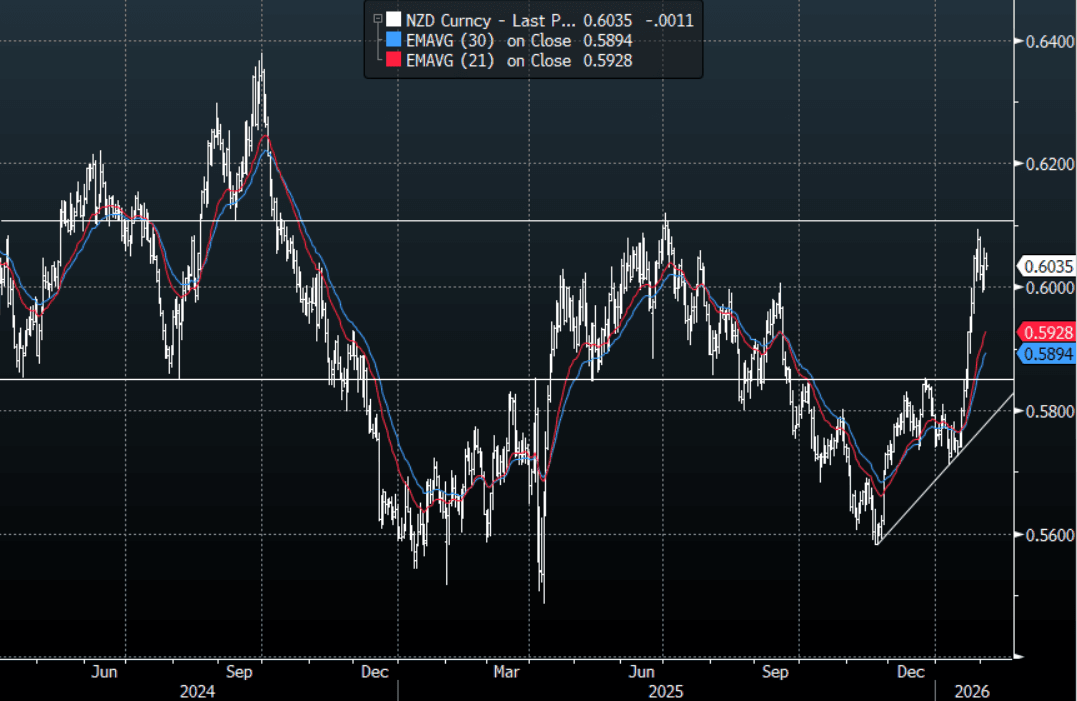
NZD/USD - Pulls Back From 0.6060 On Unemployment Data
The NZD/USD had a range today of 0.6028-0.6063 in the Asia-Pac session, it is currently trading around 0.6035, -0.20%. The NZD topped out above 0.6060 and moved lower as the unemployment rate is likely to keep the RBNZ on hold for now. On the day, the first support is around the 0.5985-0.6015 area as the market looks to regain its upward momentum. A break below here could signal a deeper pullback toward 0.5900 and put the test of 0.6100 off for a while.
- MNI AU - NZ Firmer Jobs Growth Offset By Higher U/E Rate, RBNZ Likely On Hold : The NZ Q4 jobs report was a mixed bag. On the positive side, the jobs growth picture was better than forecast. The unemployment rate though edged up to 5.4%, above both the market consensus and RBNZ forecast of 5.3%. Arguably we would have needed to see a combination of stronger jobs growth and a lower unemployment rate to get the market more excited about a potentially earlier 2026 rate hike from the RBNZ.
- “Less Hawkish RBNZ Pricing Better Reflects OCR Outlook, ANZ Says. “Markets had gotten well ahead of themselves in terms of the outlook” for rate hikes, says a senior strategist at ANZ Bank NZ.” - BBG
- Options : Closest significant option expiries for NY cut, based on DTCC data: 0.5975(NZD746m). Upcoming Close Strikes : 0.5910(NZD399m Feb 5) - BBG
- The NZD/USD Average True Range for the last 10 Trading days: 62 Points
Fig 1: NZD/USD Spot Daily Chart
Source: MNI - Market News/Bloomberg Finance L.P
ASIA STOCKS: US Lead Weighs on Japan and China, India's Momentum Builds
- Japanese stocks led the region lower today, unable to hold onto early gains and down -0.95%. Yesterday's run up in stocks with gains of almost 4% saw profit takers emerge Wednesday and some sector specific selling in tech following the US lead overnight. Downside looks capped for now as EMA's remain upward sloping and the NKY remains near to neutral on momentum indicators.
- The lead in from the US and Japan set China's major bourse on the back foot Wednesday, with major bourses down around -0.50%. Investors are likely positioning ahead of Chinese New Year and with the gold related volatility of last week still fresh in their minds, it seems likely that a more cautious approach will bias investors for now.
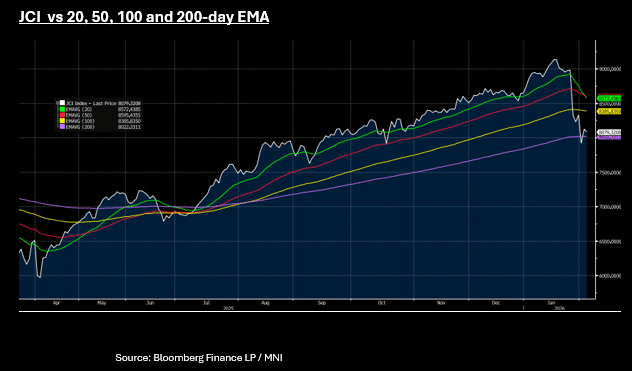
- Despite the Fin Mins assurances during a BBG TV interview, the JCI is down today, following a similar pattern to the NKY. Yesterday's gains of +2.5% has seen profit takers emerge, still cautious after the volatility of last week. The JCI is holding above 8,000, but as the 20-day EMA dips below the 50-day EMA, it suggests the short term negative momentum is outpacing the medium term trend. The JCI is holding above the 200-day EMA of 8,022, with last week's lows at 7,941.
The NIFTY 50 has opened modestly higher Wednesday, up over +3.5% since Sunday's close, having opened for the budget. The US tariff agreement continues to feed into an improved sentiment with the index above all moving averages, whilst largely neutral on momentum indicators, suggesting this positive momentum could continue.
OIL: EMAs Point to Bullish Uptrend as Oil Rises Again
- Oil's overnight rally continued in Asia with WTI up 1%. WTI has traded in a range of $63.47 - $64.17 but was unable to hold above $64, settling back below at $63.83 bbl.
- The technical backdrop remains positive for WTI with a bullish crossover, where the 20-day trades above the 50 and 100-day EMAs signaling that the short term momentum is outpacing the medium term trend.
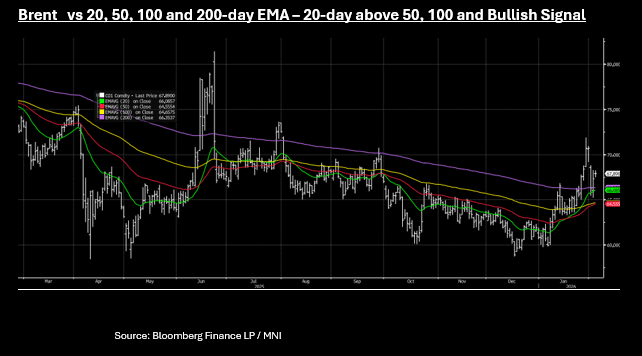
- Brent has traded in a $67.50- $68.26 context but could not hold above $68, slipping back below and settling at $67.87 bbl and a similar technical backdrop to WTI.
- News of a US warship shooting down an Iranian drone saw oil in a bullish reversal begin late Tuesday. US forces also intervened in the Strait of Hormuz after armed Iranian boats reportedly harassed a US-flagged merchant vessel. President Trump told reporters that "We are negotiating with them (Iran) right now" and "they'd like to do something." "They had a chance to do something a while ago and it didn't work out, and we did Midnight Hammer," he said, referring to the June US military strike in Iran and a likely reminder of the consequences for Iran.
- Official data out Wednesday will provide US crude inventories updates which are expected to fall, with BBG reporting that the drawdown could be the largest since June.
GOLD: $5,000 Poses No Challenge for Gold as Rally Resumes
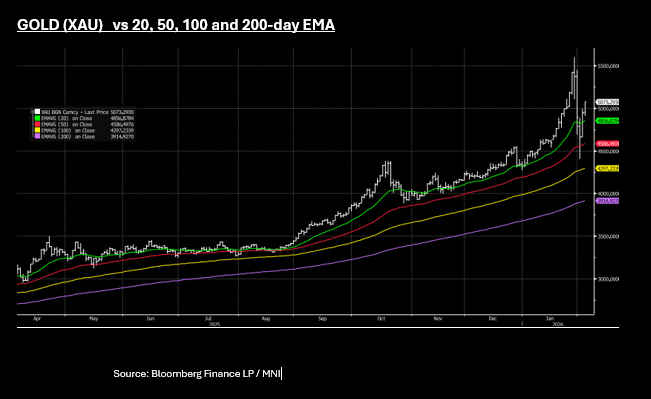
- If gold's move overnight in the US looked like a technically driven relief rally, today's move looked increasingly like dip buyers taking charge.
- With the USD steady and risk sentiment strong, gold opened at US$4,952 and rallied from the outset, with the psychological level of $5,000 posing now resistance.
- Gold is currently up +2.45% at $5,068.37 and with momentum indicators remain fairly neutral and above all EMA's, the next key resistance is at $5,100.
- As a second retail focused gold trading platform in China signaled a funding shortfall following outflows last week, there may be an element of seasonality ahead of the Lunar New Year where demand from Chinese retail investors and households has provided a strong support historically,
CNY: Bullish Consensus On Yuan Outlook Continues To Rise
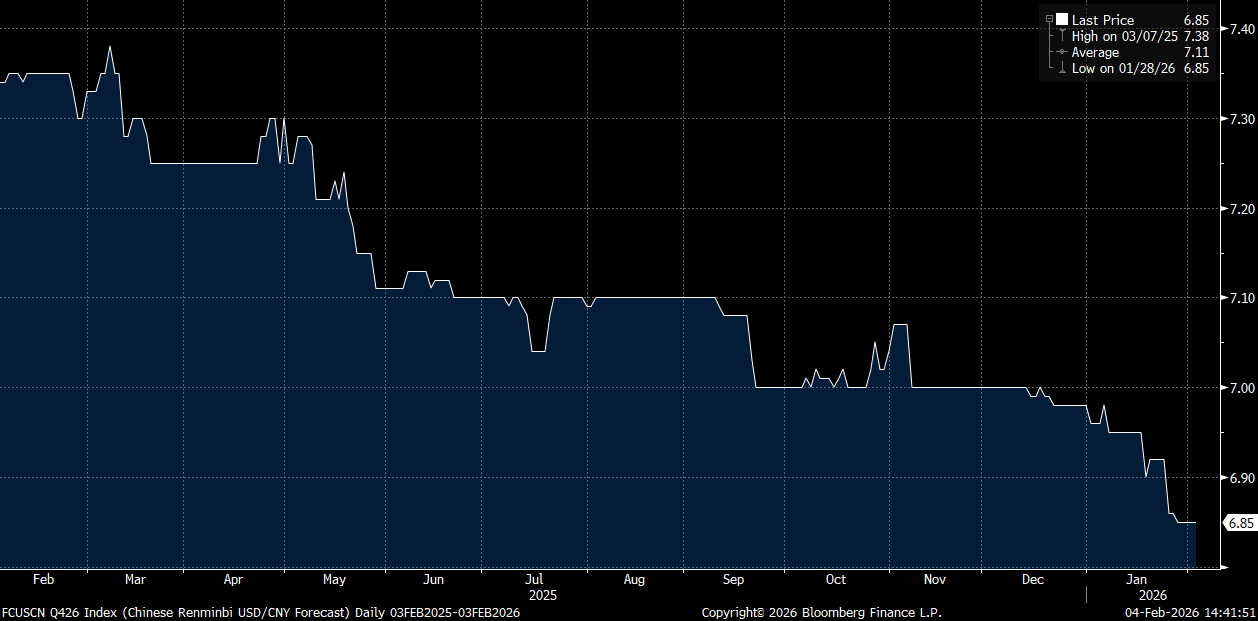
USD/CNH couldn't build on fresh downside after the earlier test under 6.9300. We sit back near 6.9350 in latest dealings, little changed for the session. USD indices are little changed, but USD/JPY is pushing high, last near 156.30. CNH/JPY is now close to 22.54, continuing to rebound from the late Jan plunge (highs on Jan 23 of 22.8737). Broader sell-side momentum for the yuan outlook remains positive. The chart below plots the BBG consensus for USD/CNY by end 2026. The bias has been skewed lower, particularly since the start of the year (now at 6.8500).
- Via BBG: "Bank of America Corp. boosted its forecast for the yuan, with the onshore yuan likely to end the third quarter at 6.7 per dollar." Adding: "“Recent yuan appreciation momentum — backed by robust exports and firmer policy signals — leads us to revise the forecasts,” Piron wrote. “The yuan’s strength is spilling into broader emerging-market FX gains.”
- 6.70 by end Q4 is the low end of the BBG range, with 7.10 the high point. The USD/CNH 9 month forward outright sits near 6.8300 in latest dealings, while the 12 month is just under 6.8000. Hence forwards are pricing in this outlook to some degree. Still, the extent of the downside move in consensus forecasts since the start of the year, from near 7.00 to 6.85, is likely to leaving the market looking for further spot USD/CNH downside.
- A fresh break under 6.9300 should see the 6.9000 region targeted. Focus post the Lunar new year break (mid Feb) will be on policy comfort around a stronger yuan, along with export growth and conversion trends.
Fig 1: Trend For Consensus 2026 Year End USD/CNY Forecast
Source: Bloomberg Finance L.P./MNI
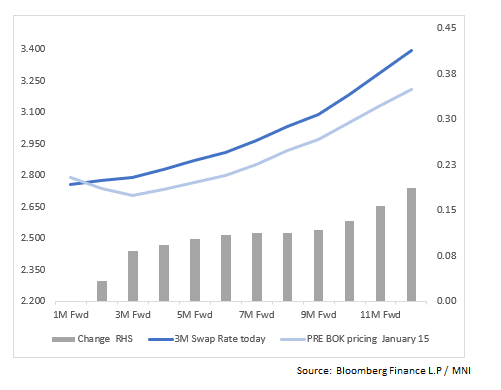
SOUTH KOREA: 1-Yr KRW Swaps Continue to Price in Rate Hikes
- The January 15 Bank of Korea meeting saw it hold its benchmark interest rate steady at 2.50% for the fifth consecutive meeting, a decision that saw some short term upward pressure on Korean Treasury bond yields. This move, coupled with the removal of previous guidance on potential rate cuts, signaled a more hawkish stance and an likely end to the easing cycle, pushing the 10-year yield to its highest in more than a year.
- At year end, the remnants of rate cuts remained priced in for early 2026 but they are now gone. Over the next 1, 2 and 3 months there is a cumulative 5bps of hikes priced into our swaps model and over the next 12 months +66bps (from +53bps last week) of increases all of focused in Q3/Q4
- The MIPR function on BBG has +42bps of increases over a 12 month period .
- Data releases for February so far have been strong with exports strong, and CPI within target. The government continues to talk about further fiscal support which could put upward pressure on yields, something they and the BOK have been seeking to avoid.
INDONESIA: Could Indian Positive Sentiment Spill Over to Indonesia? (Part 1)
- Indonesia has had a challenging start for its financial markets in 2026, with Finance Minister Purbaya going on the front foot in a BBG TV interview defending his government's economic track record.
- Purbaya sought to allay fears of a fiscal blowout committing his government to 3% fiscal deficit cap, whilst downplaying the President's nephew as new deputy BI Governor. On the latter he was clear that he will not interfere with BI policy decision making, rather ensuring the fiscal and monetary policymakers are working together.
- He saw the MSCI warning as a good thing stating that "once the government corrects the lack of transparency, it will remove the disease from the market,” and “People will take a look at the fundamentals of the economy again, which are strong.”
- In EM space, India is widely considered the most direct peer for Indonesia regarding yield performance and investor sentiment.
- Year to date Indonesia financial assets have struggled with the JCI down -6% (NIFTY 50 -1.5%), 10-Yr INDOGB -3.5% (UST 10-Yr -2.4%, INDIA 10-Yr -2.2%) and the Rupiah -0.45% (Rupee -0.44%)
- Currency woes weigh heavy on bond flows in Indonesia, and despite regular BI intervention, it requires an additional / new catalyst for a turnaround.
- Purbaya is right in that the underlying economy / economic data is robust but for now not the catalyst. However looking farther afield, could a tariff deal for India lead to a turnaround for INR and be a catalyst for IDR stability?
Fig 1: USDINR vs USDIDR
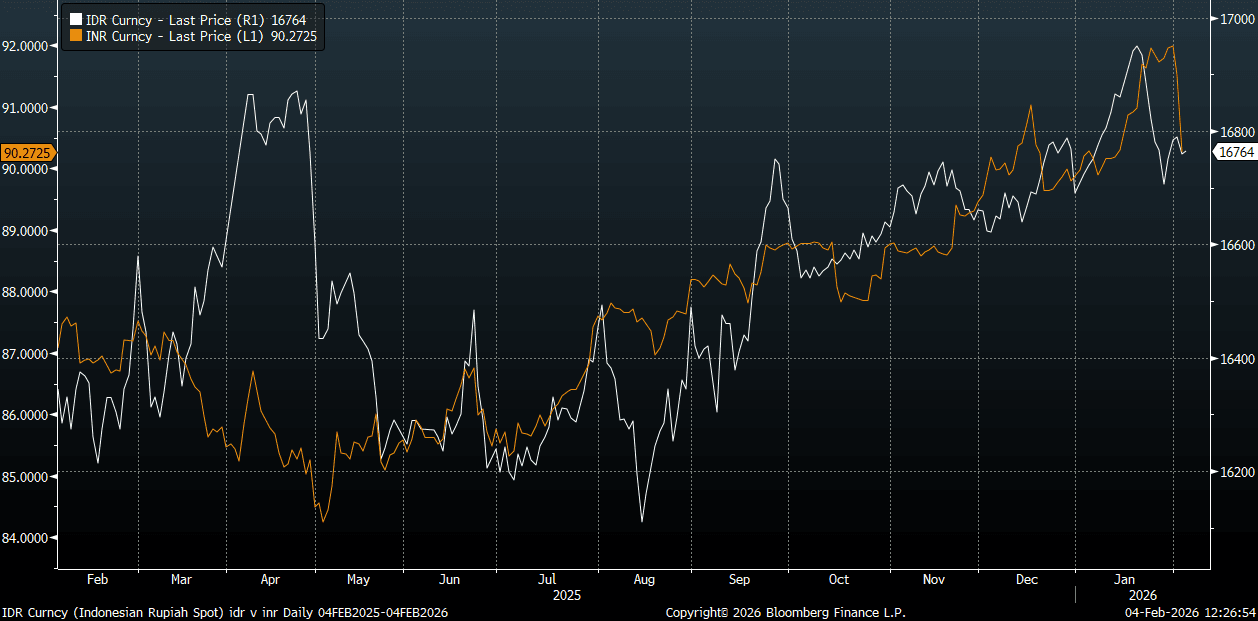
source: Bloomberg Finance LP / MNI
INDONESIA: Could Indian Positive Sentiment Spill Over to Indonesia? (Part 2)
- Post the US tariff announcements, local forecasters have moved quickly with their USDINR forecasts. Via BBG: "The rupee outperformed its Asian peers after the US tariff announcement, and analysts from Societe Generale see the currency moving to 87-88 per dollar in the coming weeks, while those from HSBC Holdings forecast a move to 88 by the end of March". A potential 3.8% gain in INR (to 87) could spill over to IDR. INR / IDR correlations average near +0.30, suggesting downside potential for USDIDR (close to 1.15%).
- This would get USDIDR near to 16,570, only just above the BI target range of 16,400 -16,500 and with further, ongoing intervention and support from the BI; could get there.
- Looking for a tipping point / catalyst is difficult when bond yields are already at the top of Q1 forecasts of 6.30% (current 6.31%). Our bias though is for downside risks rather than a break higher. The 10yr started the year closer to 6.00%. Note as well year end forecasts of 5.80-6.00%.
- Bond yields have a negative correlation to the JCI (see the chart below) and if Purbaya's message is true for equities and if the near terms trend of higher yields/weaker IDR dissipates, watch USDINR and its relationship to USDIDR moves as a potential input into turnaround of the fortunes in Indonesia.
Fig 1: JCI vs INDOGB 10-Yr Yield (inverted)
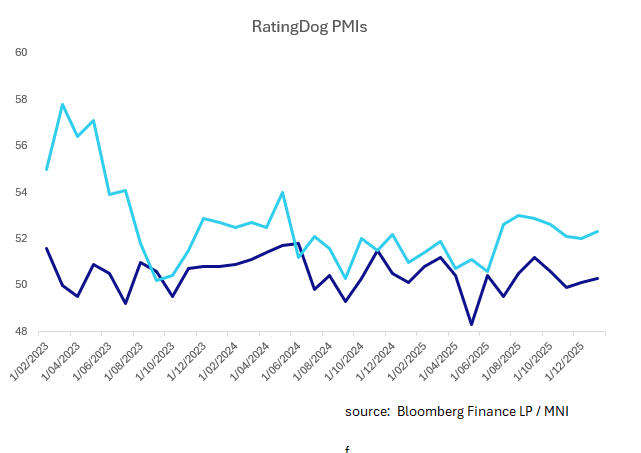
CHINA: Services PMI Up, Supports No Rush for Monetary Policy Moves
- The RatingDog China Services PMI increased to 52.3 in January 2026 from 52.0 in December, marking the strongest expansion in services activity in three months and the 37th consecutive month of growth.
- Stronger new business, including a rise in new export orders contributed to the upturn, leading services firms to increase staffing levels for the first time since July 2025
- The result is a modest respite for authorities given the multi decline in house prices and recent volatility in equities and commodities.
- The result follows Monday's RatingDog China Manufacturing January release which saw a modest improvement to +50.3 (prior +50.1).
- This sees the composite up to +51.6, its highest in 3 months.
- There appears no immediate pressure for monetary policy intervention. News reports of the interest rate on MLF hitting new lows, supports lending and is consistent with the view of incremental changes to support the transfer mechanism for rates instead of an imminent rate cut.
- CGB 10-Yr has edged lower in yield today, currently at 1.805%. Leading into Lunar New Year, could test 1.80% as liquidity is added to support markets.
CHINA: MLF Rates Lower on New Pricing Structure, Not Policy Shift
- The Medium-term Lending Facility (MLF) is a monetary policy tool used by the PBoC to manage liquidity in the banking system and influence medium-term interest rates.
- The MLF has transitioned to a more market-driven, bidding mechanism, rather than the PBoC setting a single uniform interest rate. Under this "multiple-price auction" system introduced in March 2025, participating banks bid at different rates for a set amount of funds.
- This has seen PBOC charging some lenders as low as 1.5% in January, down from the last official rate of 2% early in 2025, before the PBOC stopped publishing the figure.
- The MLF provides collateralized loans to commercial and policy banks to ensure they have stable funding for periods from 3 to 12 months and is primarily viewed as a backstop to manage maturity mismatches between lending and deposits. Operations are monthly and supplement daily OMO, with an injection of CNY700bn in January.
- A more market focused approach is aimed at lowering the cost the MLF, as the PBoC encourages banks to lower interest rates for small and medium enterprises.
- DR007 is the best gauge for interbank lending liquidity and the central bank's actual monetary stance. The PBoC uses this rate to manage the "interest rate corridor," making it a lead indicator for where the LPR might move in the future. Currently it is at 1.59%
- We expect less of headline policy moves in the first part of the year in China, more incremental moves like this to support the broader economy.
Fig 1: DR007 - 1-Yr Decline Since Moving to More Market Based Approach
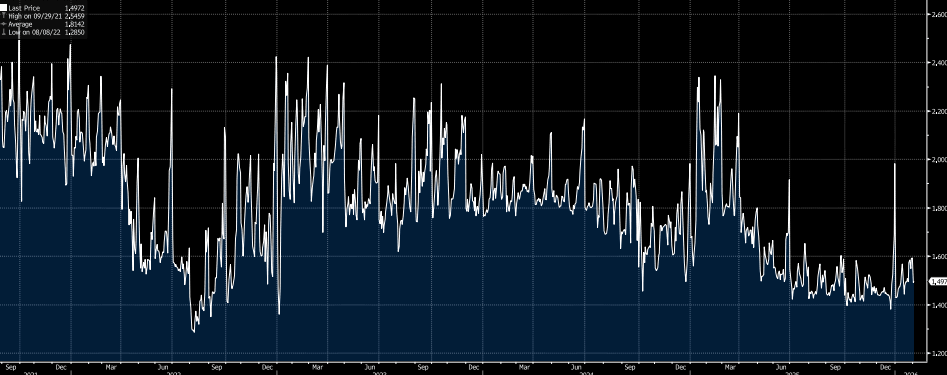
source: Bloomberg Finance LP / MNI
UP TODAY (TIMES GMT/LOCAL)
| Date | GMT/Local | Impact | Country | Event |
| 04/02/2026 | 0815/0915 | ** | S&P Global Services & Composite PMI (f) | |
| 04/02/2026 | 0830/0930 | Riksbank Minutes | ||
| 04/02/2026 | 0845/0945 | ** | S&P Global Composite & Services PMI (f) | |
| 04/02/2026 | 0850/0950 | ** | S&P Global Composite & Services PMI (f) | |
| 04/02/2026 | 0855/0955 | ** | S&P Global Composite & Services PMI (f) | |
| 04/02/2026 | 0900/1000 | ** | S&P Global Composite & Services PMI (f) | |
| 04/02/2026 | 0930/0930 | ** | S&P Global Composite & Services PMI (Final) | |
| 04/02/2026 | 1000/1100 | ** | EZ PPI | |
| 04/02/2026 | 1000/1100 | *** | EZ HICP Flash | |
| 04/02/2026 | 1000/1100 | *** | EZ HICP Flash | |
| 04/02/2026 | 1000/1100 | *** | EZ HICP Flash | |
| 04/02/2026 | 1000/1100 | *** | EZ HICP Flash (2dp) | |
| 04/02/2026 | 1000/1100 | *** | Italy Flash Inflation | |
| 04/02/2026 | 1000/1100 | *** | HICP (p) | |
| 04/02/2026 | 1000/1100 | *** | Italy Flash Inflation | |
| 04/02/2026 | 1200/0700 | ** | MBA Weekly Applications Index | |
| 04/02/2026 | 1315/0815 | *** | ADP Employment Report | |
| 04/02/2026 | 1330/0830 | *** | Treasury Quarterly Refunding | |
| 04/02/2026 | 1445/0945 | *** | S&P Global Composite & Services Index (final) | |
| 04/02/2026 | 1500/1000 | *** | ISM Non-Manufacturing Index | |
| 04/02/2026 | 1500/1000 | Treasury Secretary Scott Bessent | ||
| 04/02/2026 | 1530/1030 | ** | US DOE Petroleum Supply | |
| 04/02/2026 | 1530/1030 | ** | DOE Weekly Crude Oil Stocks | |
| 04/02/2026 | 1700/1200 | Richmond Fed's Tom Barkin | ||
| 04/02/2026 | 2330/1830 | Fed Governor Lisa Cook | ||
| 05/02/2026 | 0030/1130 | ** | Trade Balance | |
| 05/02/2026 | 0700/0800 | ** | Manufacturing Orders | |
| 05/02/2026 | 0745/0845 | * | Industrial Production | |
| 05/02/2026 | 0830/0930 | ** | S&P Global Final Eurozone Construction PMI | |
| 05/02/2026 | 0900/1000 | * | Retail Sales | |
| 05/02/2026 | 0930/0930 | ** | S&P Global/CIPS Construction PMI | |
| 05/02/2026 | 1000/1100 | ** | EZ Retail Sales | |
| 05/02/2026 | 1200/1200 | *** | Bank Of England Interest Rate | |
| 05/02/2026 | 1200/1200 | *** | Bank Of England Interest Rate | |
| 05/02/2026 | 1230/1230 | BOE Press Conference | ||
| 05/02/2026 | - | European Central Bank Meeting | ||
| 05/02/2026 | 1315/1415 | *** | ECB Deposit Rate | |
| 05/02/2026 | 1315/1415 | *** | ECB Main Refi Rate | |
| 05/02/2026 | 1315/1415 | *** | ECB Marginal Lending Rate | |
| 05/02/2026 | 1330/0830 | *** | Jobless Claims | |
| 05/02/2026 | 1330/0830 | ** | WASDE Weekly Import/Export | |
| 05/02/2026 | 1345/1445 | ECB Press Conference |