MNI EUROPEAN MARKETS ANALYSIS: Trump Takes Aim At Pharma
- President Trump has indicated he will advise his FED Chair pick by the end of this week.
- Pharma stocks in Asia were hit today as the President threatened higher tariffs on them.
- China's public kindergarten students will have 100% of final-year fees waived
- Coming up today German Manufacturing Orders, EU Construction PMIs, Italian Industrial Production, EU Retail Sales and US Crude Oil inventories.
US TSYS: Asia Wrap - Yields Edge Higher In A Quiet Session
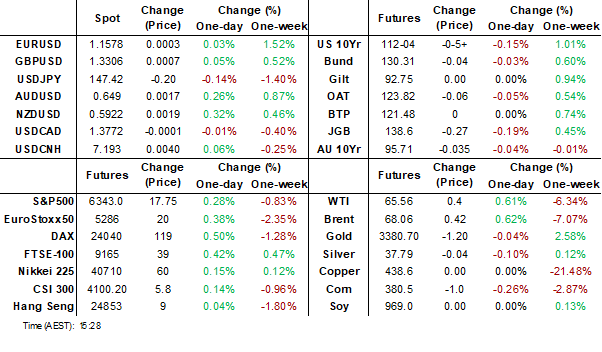
The TYU5 range has been 112-04 to 112-07 during the Asia-Pacific session. It last changed hands at 112-04, down 0-05 from the previous close.
- The US 2-year yield has edged higher trading around 3.726%.
- The US 10-year yield has moved higher trading around 4.222%, up 0.01 from its close.
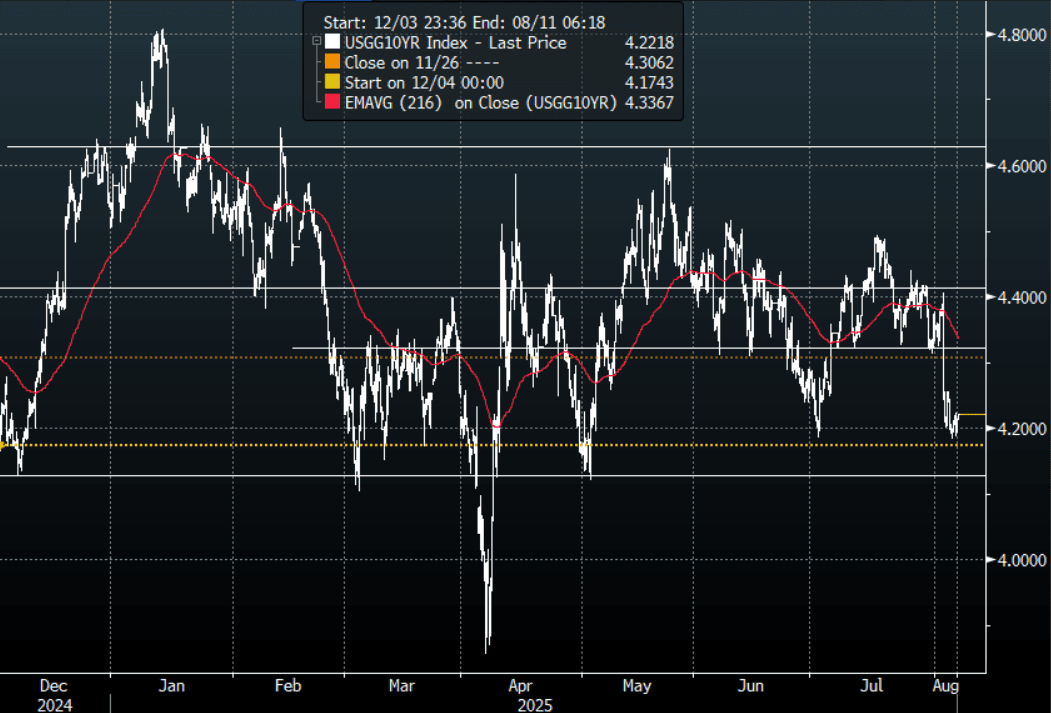
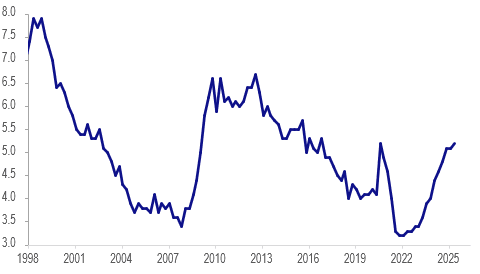
- The 10-year yield had a powerful move lower in reaction to the NFP data, breaking below its 4.30% pivot within the wider range 4.10% - 4.65%. This now turns momentum lower in yields and you could expect buyers of treasuries on bounces back towards 4.30/35% now looking to initially test the 4.10% area.
- Bloomberg - “Trump said he’ll pick a successor for Adriana Kugler before the end of the week. He added that the replacement for Jerome Powell is down to four people and that Scott Bessent declined to be considered for the role.” - BBG
- The Department of the Treasury will auction $42 billion of August 2035 notes
- Bloomberg - “Bond traders are increasingly betting on up to 75 bps in Fed rate cuts in 2025 amid signs of a weakening US economy. The shift in sentiment follows soft payrolls data and stagnation in the services sector.”
- Truflation on X: “PCE close to 2%! All inflation metrics are falling. No more excuses. No more empty words. It's time to act, Powell.”
- Data/Events: MBA Mortgage Applications
Fig 1: 10-Year US Yield Daily Chart
Source: MNI - Market News/Bloomberg Finance L.P
GLOBAL MACRO: Sharp Narrowing In US Deficits With China, EU & Canada
In line with global export growth peaking in March, US data shows that its trade deficit peaked at the same time. Countries front loaded shipments to beat the early April reciprocal tariff announcement. Ship tracking data for May show that the number of container vessels moderated, and consistent with this the US June visible trade deficit fell to its lowest in over two years. Given the bringing forward of shipments, the data is going to be difficult to interpret over H2. It will take time to see what the impact from the increase in the US effective tariff rate to around 16% will be on the deficit.
- Bilateral balances have generally turned over 2025. The deficit with Canada narrowed around $2.1bn in June from March but almost $10bn since January, China’s $8.4bn and $22.2bn respectively and the EU’s $37.6bn and $13.4bn.
- Looking at Asian trends, the 12-month sum of the US deficit with Japan has stabilised, narrowed with China and Korea, but deteriorated with India and especially Taiwan.
US merchandise trade deficit $bn 12mth sum
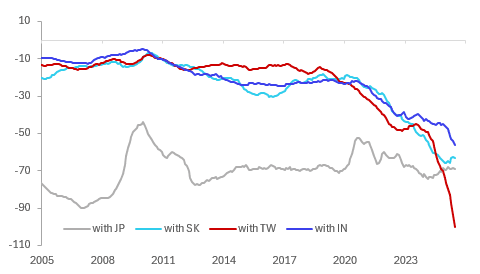
- The monthly deficit with Taiwan has consistently widened over 2025 as negotiations with the US took place. Its reciprocal tariff was reduced to 20% from 32% but uncertainty over its key chip shipments continues. The number of ships leaving for the US has moderated since late July but remain around the recent average.
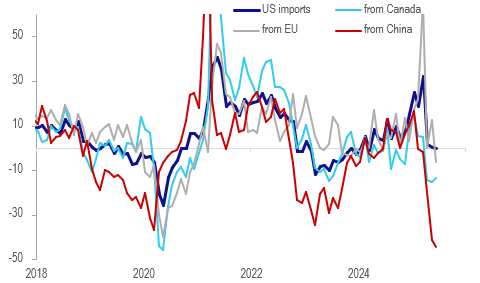
- US imports growth peaked in March at 32.3% y/y and fell 0.2% y/y in June driven by sharp declines from its main trading partners. Imports from Canada fell 13.7% y/y, 6.3% from the EU but a sharp 44.5% from China.
- There also seems to have been a frontloading of US exports with growth peaking at 10.8% y/y in April as firms were likely concerned about retaliation. This has moderated since with June only 3.4% y/y.
US merchandise imports y/y%
Source: MNI - Market News/LSEG
JGBS: Post-Wages Data Twist-Flattener Is Holding
JGB futures are weaker and at session lows, -26 compared to settlement levels.
- (MNI) Japan's inflation-adjusted real wage, a key gauge of household purchasing power, remained in negative territory for a sixth consecutive month in June but narrowed to -1.3% from May's 2.6% decline, preliminary data from the Ministry of Health, Labour and Welfare showed Wednesday.
- (Bloomberg) - The Japanese currency's recent strength can be expected to wane somewhat after wages data came in substantially weaker than had been expected. That's likely to be seen as reinforcing the BOJ's instinctive policy caution, pushing traders to pare back already modest bets on a rate hike this year.
- The cash JGB curve has twist-flattened, with benchmark yields 2bps higher to 1bp lower. The benchmark 10-year yield is 2.1bps higher at 1.493% versus the cycle high of 1.616%.
- Swaps are cheaper, with rates 1-2bps higher.
- Tomorrow, the local calendar will see Weekly International Investment Flow, Tokyo Office Vacancies and Leading/Coincident Index data alongside 30-year supply.
AUSSIE BONDS: Little Changed On A Subdued Data-Light Session
ACGBs (YM -0.5 & XM -1.0) are little changed on a data-light session.
- Cash US tsys are flat to 1bp cheaper, with a steepening bias, in today's Asia-Pac session after yesterday's twist-flattener.
- Cash ACGBs are 1bp cheaper with the AU-US 10-year yield differential at +2bps.
- The latest ACGB Mar-36 auction saw strong demand, with the weighted average yield coming in 0.21bps through prevailing mid-yields, according to Yieldbroker, continuing the trend of firm pricing at recent ACGB auctions. However, the cover ratio collapsed to 3.3111x from 4.45x.A$1000mn of the 3.00% 21 November 2033 bond is planned for Friday.
- The bills strip is weaker, with pricing -1 to -3.
- RBA-dated OIS pricing is little changed across meetings today. A 25bp rate cut in August is given a 100% probability, with a cumulative 63bps of easing priced by year-end (based on an effective cash rate of 3.84%).
BONDS: NZGBS: Closed At Worst Levels But Only Modestly Cheaper
NZGBs closed 3bps cheaper across benchmarks, with the NZ-US 10-year yield differential little changed on the day.
- Cash US tsys are flat to 2bps cheaper, with a steepening bias, in today's Asia-Pac session after yesterday's twist-flattener. Today’s US calendar will see BA Mortgage Applications.
- NZ employment was weaker in Q2 than the RBNZ projected in May declining 0.1% q/q and 0.9% y/y, in line with consensus, after a downwardly-revised 0.0% q/q & -0.7% y/y in Q1. The unemployment rate rose 0.1pp to 5.2%, highest since Covid-impacted Q3 2020, but as the RBNZ forecast. The next rate decision is on August 20 and will include an updated outlook. With job shedding continuing and activity indicators remaining lacklustre and inflation in the band, another 25bp rate cut is likely.
- Swap rates closed 1-2bps higher, with the 2s10s curve little changed.
- RBNZ dated OIS pricing closed slightly firmer across meetings. 23ps of easing is priced for August, with a cumulative 41bps by November 2025.
- Tomorrow, the local calendar will see RBNZ Inflation Expectations data.
- The NZ Treasury also plans to sell NZ$225mn of the 4.50% May-30 bond, NZ$175mn of the 4.50% May-35 bond and NZ$50mn of the 1.75% May-41 bond.
NEW ZEALAND: Q2 Sees Increased Labour Market Capacity
NZ employment was weaker in Q2 than the RBNZ projected in May declining 0.1% q/q and 0.9% y/y, in line with consensus, after a downwardly-revised 0.0% q/q & -0.7% y/y in Q1. The unemployment rate rose 0.1pp to 5.2%, highest since Covid-impacted Q3 2020, but as the RBNZ forecast. The next rate decision is on August 20 and will include an updated outlook. With job shedding continuing and activity indicators remaining lacklustre and inflation in the band, another 25bp rate cut is likely.
NZ unemployment %
Source: MNI - Market News/LSEG
- With excess supply in the labour market, wage inflation continues to moderate. April 1 pay rises are included in the Q2 data boosting the quarterly rates but they were below Q2 2024.
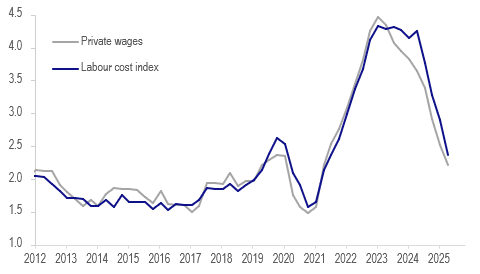
- Q2 labour costs rose 0.6% q/q to be up 2.4% y/y down from 2.9% y/y in Q1 and the slowest rate since Q2 2021. Private wages rose 0.6% q/q to moderate to 2.2% y/y from 2.5%, lowest since Q1 2021.
NZ wages y/y%
- Underutilisation continues to trend higher too. It troughed recently at 9% in Q3 2022 and rose 0.4pp to 12.8% in Q2, the highest since Q3 2020. It is up 0.9pp since Q2 2024.
- The participation rate fell 0.2pp to 70.5%. There was a 5% y/y rise in 15-24 year olds in education which is probably being driven by difficulties in finding employment. The employment rate for this age group is down 3pp to 53.1%.
FOREX: Asia FX Wrap - USD Drifts Lower
The BBDXY has had a range of 1208.77 - 1210.24 in the Asia-Pac session, it is currently trading around 1208, -0.10%. The USD, with a huge rejection of the 1220/1230 area on Friday, had a knee-jerk reaction lower to the outsized move in US rates as the market's view on growth and interest rate cuts is re-evaluated. The USD is consolidating just above its 1205 support, as the market contemplates the increasing headwinds to risk and what that means for the USD. The market is still very quick to jump onto opportunities to sell the USD, a sustained move back above the 1230 area would be needed to put pressure on the bears.
- EUR/USD - Asian range 1.1564 - 1.1585, Asia is currently trading 1.1585. The pair has bounced nicely off the important 1.1300/1.1400 area. The market is consolidating just ahead of its first resistance towards the 1.1650/1.1700 area.
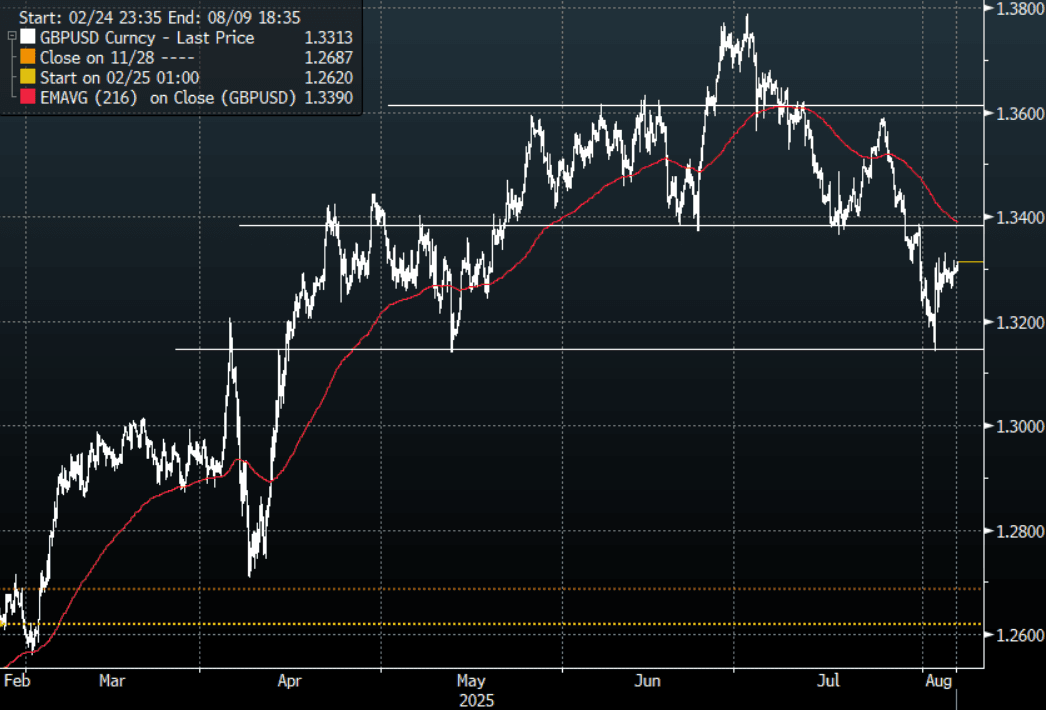
- GBP/USD - Asian range 1.3292 - 1.3313, Asia is currently dealing around 1.3310. The pair bounced nicely off the 1.3100/1.3200 support area. I would suspect sellers would be around on a bounce back towards 1.3400 initially.
- USD/CNH - Asian range 7.1880 - 7.1955, the USD/CNY fix printed 7.1409, Asia is currently dealing around 7.1920. Sellers should be around on bounces while price holds below the 7.2200/2500 area and the PBOC manages the fix lower. Above 7.2500 and we could see a test of the USD Shorts.
- Cross asset : SPX +0.25%, Gold $3375, US 10-Year 4.222%, BBDXY 1208, Crude Oil $65.58
- Data/Events : France Private Sector Payroll, Italy Industrial Production, Germany Factory Orders/HCOB Construction, EZ Retail sales
Fig 1: GBP/USD Spot 120min Chart
Source: MNI - Market News/Bloomberg Finance L.P
JPY: Asia Wrap -USD/JPY Drifts Lower Shrugging Off Wage Data.
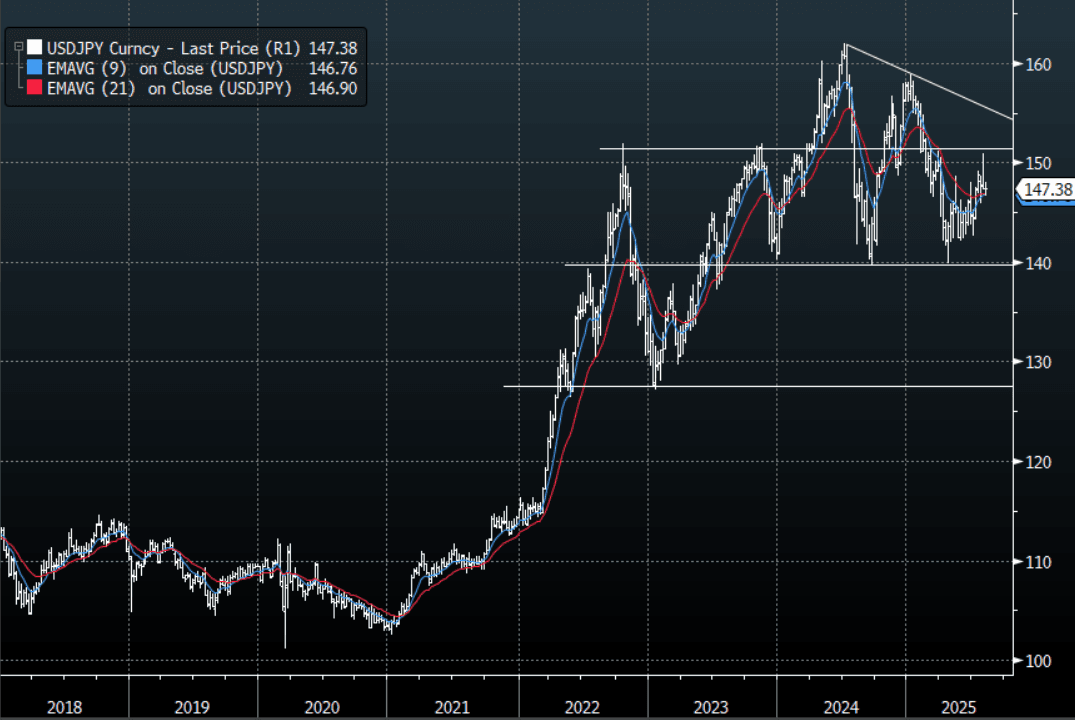
The Asia-Pac USD/JPY range has been 147.34 - 147.75, Asia is currently trading around 147.35, -0.20%. USD/JPY initially tried higher after weaker than expected wage data, but good sellers towards 148.00 continue to cap for now. Price has moved very quickly away from the pivotal 151/152 area much to the relief of Institutional Yen longs and the BOJ. CFTC Data shows leveraged accounts had started to aggressively build Yen shorts last week so this quick move lower would be a bitter pill to swallow. Price is holding above the support area around 146.50/147.00 for now, a move sub 145.00 is needed to turn momentum lower once more, until then the 145.00-151-00 range should dominate.
- "HAYASHI: AGREED W/ US THAT JAPAN PHARM WON'T BE AT DISADVANTAGE” - BBG
- "JAPAN'S KONO: NECESSARY TO RAISE RATES TO STRENGTHEN YEN" - BBG
- (MNI) Japan's inflation-adjusted real wage, a key gauge of household purchasing power, remained in negative territory for a sixth consecutive month in June but narrowed to -1.3% from May's 2.6% decline, preliminary data from the Ministry of Health, Labour and Welfare showed Wednesday.
- (Bloomberg) - The Japanese currency’s recent strength can be expected to wane somewhat after wages data came in substantially weaker than had been expected. That’s likely to be seen as reinforcing the BOJ’s instinctive policy caution, pushing traders to pare back already modest bets on a rate hike this year.
- Options : Close significant option expiries for NY cut, based on DTCC data: 147.00($1.5b).Upcoming Close Strikes : 147.65($1.14b Aug 7), 148.50($1.24b Aug 7) - BBG.
- CFTC data shows asset managers surprisingly added slightly to their JPY longs +75119( Last +72326), while leveraged funds aggressively added to their newly built short JPY position -31280(Last -11571).
Fig 1 : USD/JPY Spot Weekly Chart
Source: MNI - Market News/Bloomberg Finance L.P
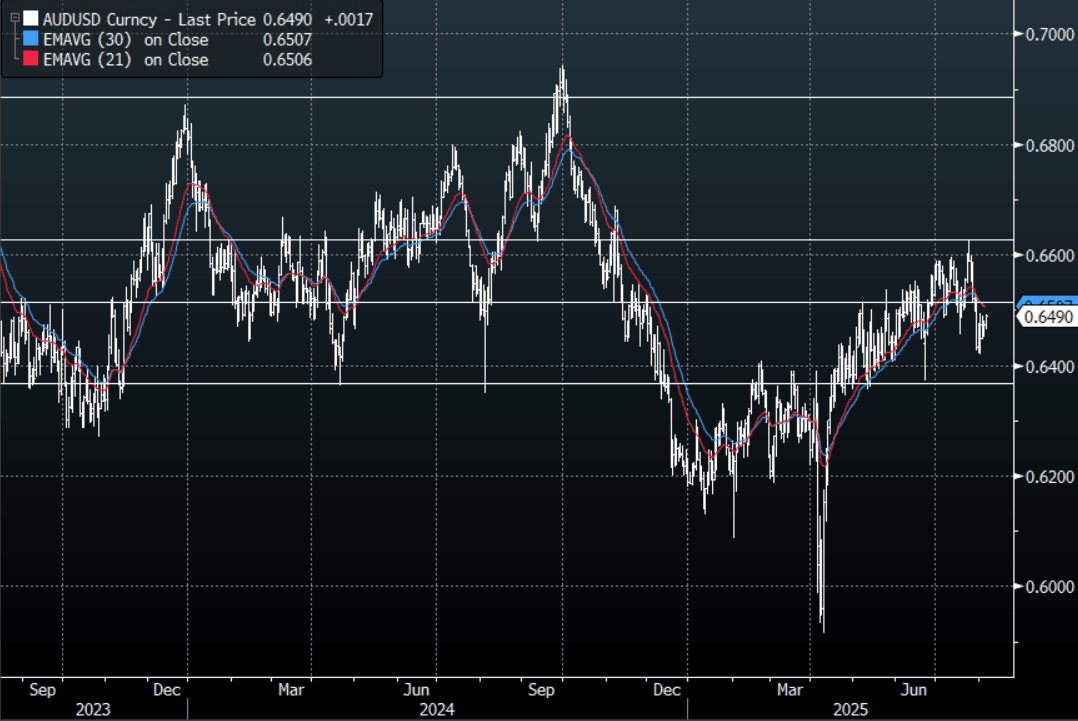
AUD: Asia Wrap - AUD/USD Gets A Boost From A Positive Asian Session For Risk
The AUD/USD has had a range of 0.6465 - 0.6492 in the Asia- Pac session, it is currently trading around 0.6490, +0.25%. The AUD has bounced in our session as Asian equities trade positively ignoring the wobble seen in the US in response to the ISM Services data. The AUD bounced nicely off the 0.6400 area but I suspect sellers might return back towards 0.6500/50 initially. I feel the performance of US equities over August/September will be crucial as seasonality points to some strong headwinds approaching.
- MNI Exclusive - The Reserve Bank of Australia looks set to cut the cash rate by 25 basis points to 3.6% on Aug 12, but further easing could prove a policy mistake and force the Bank to reverse course within six months unless a major global shock intervenes, former RBA board member Warwick McKibbin told MNI.
- Options : Closest significant option expiries for NY cut, based on DTCC data: 0.6575(AUD701m). Upcoming Close Strikes : 0.6500(AUD4.27b Aug 8), 0.6600(AUD1.97b Aug 7), 0.6800(AUD1.72b Aug 7) - BBG
- CFTC Data shows Asset managers reduced their shorts slightly -49183(Last -53959), the Leveraged community added to their own shorts -13997(Last -12010).
- AUD/JPY - Asia-Pac range 95.40 - 95.76, Asia is trading around 95.70. The pair failed on multiple attempts above 97.00 and has moved swiftly back to test its first support toward the 95.00 area. There should be sellers around the 96.00/96.50 area initially, a sustained break below 94.50/95.00 could signal a deeper move lower.
Fig 1: AUD/USD spot Daily Chart
Source: MNI - Market News/Bloomberg Finance L.P
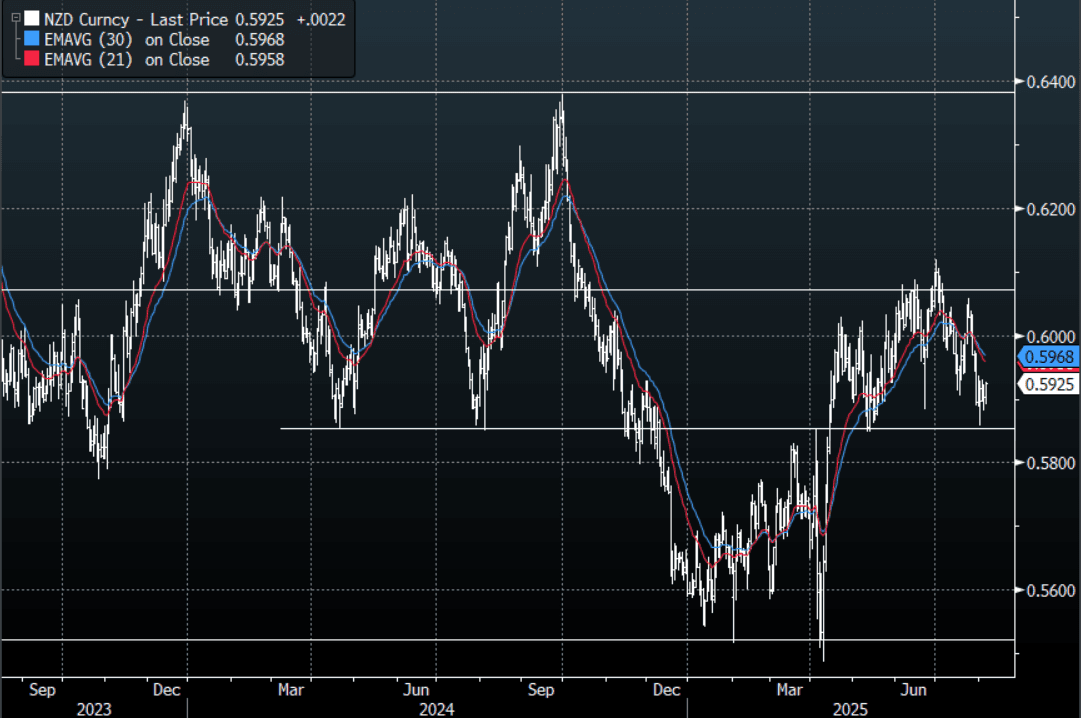
NZD: Asia Wrap - NZD/USD Bounces On a Better Employment Print & Positive Risk
The NZD/USD had a range of 0.5891 - 0.5926 in the Asia-Pac session, going into the London open trading around 0.5925, +0.37%. The NZD has bounced in our session in response to a better than expected unemployment print and Asian equities trading positively ignoring the wobble seen in the US in response to the ISM Services data. NZD/USD bounced nicely off its 0.5850 support but I would suspect sellers could return on any bounce back toward 0.6000. With the seasonality for risk looking poor there is a chance it tests the pivotal 0.5800/50 area, a break of which would open up a move back to the 0.5500 lows.
- NEW ZEALAND: Q2 Sees Increased Labour Market Capacity. NZ employment was weaker in Q2 than the RBNZ projected in May declining 0.1% q/q and 0.9% y/y, in line with consensus, after a downwardly-revised 0.0% q/q & -0.7% y/y in Q1. The unemployment rate rose 0.1pp to 5.2%, highest since Covid-impacted Q3 2020, but as the RBNZ forecast. The next rate decision is on August 20 and will include an updated outlook. With job shedding continuing and activity indicators remaining lacklustre and inflation in the band, another 25bp rate cut is likely.
- “NZ FINANCE MINISTER WILLIS: EXPECT UNEMPLOYMENT TO FALL LATER THIS YEAR, EXPECT EXPORTS TO CONTINUE TO BOOM. INCREASED US TARIFF RATE ON NZ WON'T HAVE BIG IMPACT" - BBG
- Kelly Eckhold(Westpac NZ) on LinkedIn: “Today's labour market reports came in a touch stronger than our forecasts but more or less in line with the RBNZ's thinking. The Unemployment rate rise to 5.2% instead of our 5.3% forecast. While jobs growth remains weak, the under 20's are moving out of the workforce and heading into training. The NEET rate was unchanged this quarter in seasonally adjusted terms. I think this is a return to normality for this younger cohort and bodes well for their future.”
- Options : Closest significant option expiries for NY cut, based on DTCC data: none. Upcoming Close Strikes : 0.5970(NZD496m Aug 7), 0.5920(NZD483m Aug 11), 0.5930(NZD646m Aug 11). - BBG
AUD/NZD range for the session has been 1.0949 - 1.0982, currently trading 1.0955. The Cross moved lower in response to the better employment print but continues to consolidate on a 1.09 handle as the pair tries to build some momentum to move higher.
Fig 1: NZD/USD Spot Daily Chart
Source: MNI - Market News/Bloomberg Finance L.P
ASIA STOCKS: Trump Takes Aim at Pharma
Some of Asia's pharma stocks took a hit today as President Trump aimed his tariff sights firmly in their direction. Pharma shares in Australia, Japan, South Korea and India are down by 2-3% after Trump said in an interview that he will be putting tariffs on Pharmaceuticals.
Following yesterday's better than expected GDP, Indonesia's Jakarta Composite has consolidated above 7,500 over 25% off the March lows.
A government initiative to provide free preschool education has given Chinese childcare related stocks a boost with rises of +2-4% .
- The Hang Seng posted modest gains of +0.18% as it attempts to trade above 29,500. The CSI 300 is up +0.18%, Shanghai Comp is up +0.27% and Shenzhen up +0.55%.
- The Nikkei has had a strong day rising +0.60% after Tuesday's gains of +0.64%.
- The TAIEX in Taiwan is the worst regional performer, down -0.77%
- The KOSPI followed the TAIEX down by -0.18%.
- Malaysia's FTSE KLCI couldn't follow up on yesterday's gains of +0.76% and is lower by -0.16%.
- The Jakarta Composite is one of the best performers in July but could only rise marginally today by +0.08%.
- The FTSE Straits Times is down -0.07% and the PSEi in the Philippines up +0.62%.
- The NIFTY 50 in India declined -0.30% yesterday and has opened marginally lower this morning.
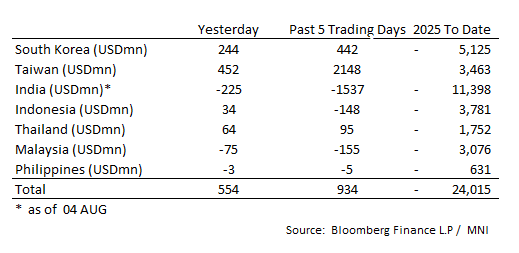
ASIA STOCKS: Mixed Flows Across Regional Markets
Taiwan’s inflows over last five days have tipped over $2bn as international flows return. India’s fortunes have turned the other was as strong outflows continue.
- South Korea: Recorded inflows of +$244m yesterday, bringing the 5-day total to +$442m. 2025 to date flows are -$5,125. The 5-day average is +$88m, the 20-day average is +$193m and the 100-day average of +$2m.
- Taiwan: Had inflows of +$452m yesterday, with total inflows of +$2,148 m over the past 5 days. YTD flows are positive at +$3,463. The 5-day average is +$430m, the 20-day average of +$333m and the 100-day average of +$161m.
- India: Had outflows of -$225m as of the 4th, with total outflows of -$1,537m over the past 5 days. YTD flows are negative -$11,398m. The 5-day average is -$307m, the 20-day average of -$169m and the 100-day average of +$35m.
- Indonesia: Had inflows of +$34m yesterday, with total outflows of -$148m over the prior five days. YTD flows are negative -$3,781m. The 5-day average is -$30m, the 20-day average -$15m and the 100-day average -$29m.
- Thailand: Recorded inflows of +$64m yesterday, with inflows totaling +$95m over the past 5 days. YTD flows are negative at -$1,752m. The 5-day average is +$19m, the 20-day average of +$35m and the 100-day average of -$12m.
- Malaysia: Recorded outflows as of -$75m yesterday, totaling -$155m over the past 5 days. YTD flows are negative at -$3,076m. The 5-day average is -$31m, the 20-day average of -$17m and the 100-day average of -$17m.
- Philippines: Recorded outflows of -$3m yesterday, with net outflows of -$5m over the past 5 days. YTD flows are negative at -$631m. The 5-day average is -$1m, the 20-day average of -$4m the 100-day average of -$4m.
OIL: Crude Higher Again, US Inventory Data Out Later
Oil prices are higher today supported by US industry data showing a large crude drawdown and the upcoming August 8 deadline for a truce in Ukraine otherwise purchasers of Russian fuel will be hit by extra US tariffs. Crude is down over 5% in the first three trading days of the month. WTI is 0.6% higher at $65.54/bbl following a high of $65.63. Brent is up 0.6% to $66.90/bbl after reaching $66.94. The USD index is down 0.1%.
- Markets believe that even if there isn’t a US-Russia agreement, that it will be very difficult to reduce Russian fuel shipments materially. US special envoy Witkoff is scheduled to be in Russia today for meetings.
- Daily Russian product exports declined around 4% in July from June to their lowest in nine months based on Vortexa data compiled by Bloomberg. Refining rates are down and summer has driven an increase in domestic consumption. Russia has stopped gasoline exports for now.
- Bloomberg reported that US oil inventories fell a more-than-expected 4.2mn last week, according to people familiar with the API data. Gasoline stocks fell 900k while distillate rose 1.6mn. The official EIA data is out later today and will be monitored for signs of weakening demand.
- Later the Fed’s Cook, Collins and Daly speak. Euro area June retail sales, June German factory orders and French Q2 employment print.
Gold Turns At Initial Resistance Level
Gold prices are down 0.25% to $3372.2/oz during today’s APAC session, pressured by stronger risk appetite, after rising 2.8% over the first three trading days of August. They reached a high of $3385.40 early in the session and then trended lower to $3373.24 pressured by slightly higher US long-end yields. The USD index is down 0.1% though.
- Gold faced resistance today at its high of $3385.40, 4 August high, but has remained above support at $3268.2, 30 July low. The rally since the disappointing US payrolls print signals that previous weakness was corrective.
- Equities are generally higher with the S&P e-mini up 0.2%, Nikkei +0.5% and Hang Seng +0.2% but KOSPI down 0.3%. Oil prices are higher with WTI +0.6% to $65.58/bbl. Copper is up 0.2%.
- Later the Fed’s Cook, Collins and Daly speak. Euro area June retail sales, June German factory orders and French Q2 employment print.
METALS: Copper - Trades Heavy, Positioning Still Looks A Problem
The range overnight for the HGU5 contract was 437.25 - 447.10, Asia is currently trading around 439.70, +0.30%. Copper has found a base around 435.00 and is consolidating after the huge move lower resulting from the Trump administrations move to differentiate between refined metal and semi-processed products when applying tariffs. The market has been caught wrongfooted and the lack of a decent bounce after such a huge move as well as news of the closure of 1 of Chile's biggest copper mines highlights the positioning issue. Any bounce back to 465 -480 should find sellers initially.
- The LME cash market closed overnight around 9571.18.
- (Bloomberg) - “Codelco halted processing plants at its biggest copper mine in Chile after a deadly tunnel collapse on July 31. The shutdown will reduce output of the metal by about 30,000 metric tons a month, a quarter of Codelco’s production.”
- “Trump’s first wave of copper tariffs will hit imports valued at more than $15 billion last year, highlighting the potential inflationary impact on American manufacturers.”
Fig 1 : Copper(HGU5) Hourly Chart
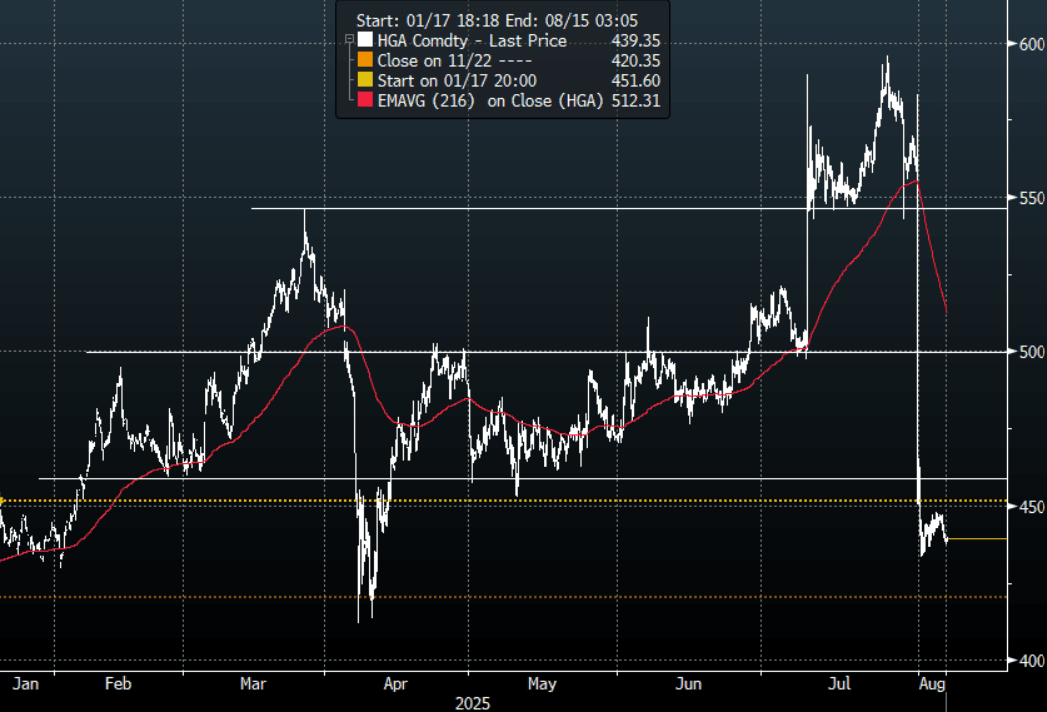
Source: MNI - Market News/Bloomberg
INDIA: RBI on Hold as Tariff Threat Hovers
- As we expected the Reserve Bank of India maintained the benchmark interest rate at 5.50% today, with a vote unanimous.
- The Governor spoke to the positive outlook for the economy the challenges from tariffs cloud the short term.
- The large reduction in June we felt needed time to wash through the economy at a time when inflation continues to moderate.
- Since the rate cutting began, the RBI has reduced its benchmark by 100bps and provided significant liquidity boost to the system.
- The RBI maintained its “neutral” policy stance, giving MPC members some flexibility amid global uncertainty.
THAILAND: Broad Based Weakness In Thai CPI Inflation
Thai inflation printed below expectations in July with headline down 0.7% y/y after -0.25% due to lower global oil and local vegetable prices. It has been trending lower through 2025 and July was the fourth consecutive negative. Core was slightly lower than consensus at 0.8% y/y down from 1.1%. The Bank of Thailand left rates at 1.75% in June to allow it to time future easing. It has cut rates 75bp this cycle and with broad based moderation in inflation, it could ease again on August 13.
Thailand CPI y/y%
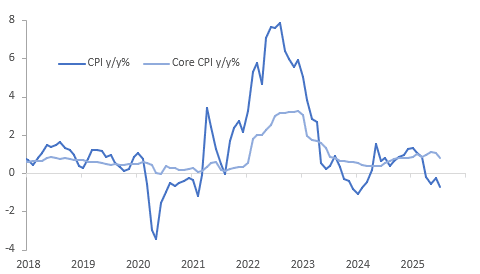
- The Trade Policy and Strategy Office said that there isn’t deflation as consumer demand increased and prices rose for many items. It projects Q3 CPI to fall 0.5% y/y but return to positive territory in Q4.
- Food inflation moderated to 0.8% y/y from 1.6% in May driven by moderation across most items but especially a 9.4% y/y drop in fruit & vegetables.
- Non-food inflation was down at -1.7% y/y from -1.45% with all major components negative except recreation & education. Energy was down 7.3% y/y from -6.3% while transport & comms was -3.9% after -3.2%.
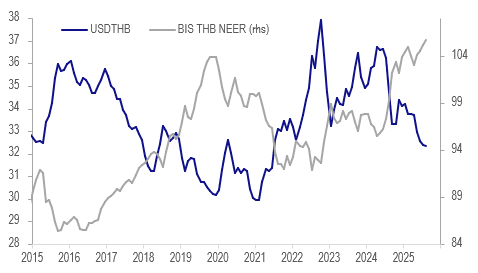
- USDTHB is slightly lower today at 32.37 and is down 0.9% since the last BoT decision on June 25. The THB NEER has also risen for four consecutive months with August up 0.5% m/m so far. With the stronger currency tightening financial conditions and inflation below target, an August rate cut is on the cards.
Thailand THB
Source: MNI - Market News/LSEG
UP TODAY (TIMES GMT/LOCAL)
| Date | GMT/Local | Impact | Country | Event |
| 06/08/2025 | 0600/0800 | ** | Manufacturing Orders | |
| 06/08/2025 | 0730/0930 | ** | S&P Global Final Eurozone Construction PMI | |
| 06/08/2025 | 0800/1000 | * | Industrial Production | |
| 06/08/2025 | 0830/0930 | ** | S&P Global/CIPS Construction PMI | |
| 06/08/2025 | 0900/1100 | ** | Retail Sales | |
| 06/08/2025 | 1100/0700 | ** | MBA Weekly Applications Index | |
| 06/08/2025 | 1430/1030 | ** | DOE Weekly Crude Oil Stocks | |
| 06/08/2025 | 1430/1030 | ** | US DOE Petroleum Supply | |
| 06/08/2025 | 1700/1300 | ** | US Note 10 Year Treasury Auction Result | |
| 06/08/2025 | 1800/1400 | Boston Fed's Susan Collins | ||
| 06/08/2025 | 1800/1400 | Fed Governor Lisa Cook | ||
| 06/08/2025 | 1910/1510 | San Francisco Fed's Mary Daly | ||
| 07/08/2025 | 0130/1130 | ** | Trade Balance | |
| 07/08/2025 | 0600/0800 | ** | Trade Balance | |
| 07/08/2025 | 0600/0800 | ** | Industrial Production | |
| 07/08/2025 | 0600/0800 | *** | Flash Inflation Report | |
| 07/08/2025 | 0645/0845 | * | Foreign Trade | |
| 07/08/2025 | 0700/0900 | ** | Unemployment | |
| 07/08/2025 | 1100/1200 | *** | Bank Of England Interest Rate | |
| 07/08/2025 | 1100/1200 | *** | Bank Of England Interest Rate | |
| 07/08/2025 | 1130/1230 | BOE Press Conference | ||
| 07/08/2025 | - | *** | Trade | |
| 07/08/2025 | 1230/0830 | *** | Jobless Claims | |
| 07/08/2025 | 1230/0830 | ** | WASDE Weekly Import/Export | |
| 07/08/2025 | 1230/0830 | ** | Preliminary Non-Farm Productivity | |
| 07/08/2025 | 1300/1400 | BOE Decision Maker Panel Data BOE Decision Maker Panel Data |