MNI ASIA OPEN: US Price Pressures May Pend In The Pipeline
MNI (NEW YORK) -
EXECUTIVE SUMMARY
- US DATA: PPI Price Pressures Pick Up Strongly Across Board In July
- MNI INTERVIEW: Fed Should Hold, Focus On Inflation - Emmons
- MNI: US Pushes EU For More Concessions Despite Deal- Officials
- US-RUSSIA: Trump Has 'Plenty Of Tools' To End Ukraine War - White House
NEWS
MNI INTERVIEW: Fed Should Hold, Focus On Inflation - Emmons
The Federal Reserve should hold rates steady at its next meeting in mid-September despite signs of a softer economy, with inflation yet to reach the 2% target, former St. Louis Fed economist William Emmons told MNI, adding that a cut was probable anyway. Any September cut would likely be framed in cautious terms, with a meeting-by-meeting approach and no commitment to additional reductions, Emmons said, adding that this would nonetheless feed speculation of further easing.
MNI: US Pushes EU For More Concessions Despite Deal- Officials
A joint statement between the U.S. and the EU formalising their July 27 trade agreement is being delayed by a gulf between the two sides’ understanding of what was agreed, with Washington pushing for further concessions in return for confirming a 15% tariff cap in key areas such as cars and pharmaceuticals, EU sources told MNI.
US-RUSSIA: Trump Has 'Plenty Of Tools' To End Ukraine War - White House
White House Press Secretary Karoline Leavitt has provided a short update to Fox News on the upcoming summit between US President Donald Trump and Russian President Vladimir Putin in Alaska on Friday. Leavitt reiterated that Putin "requested the meeting" and Trump wants to "exhaust all options to try to bring this war to a peaceful resolution." Leavitt added that "what comes after the meeting is up to President Trump and that is part of the reason he is going." She continued: "[Trump] has incredible instincts and he wants to sit down and look the Russian President in the eye and see what progress can be made..."
MNI Norges Bank Review - Aug '25: June Outlook Still Intact
Norges Bank held rates at 4.25% as unanimously expected, while the guidance language was essentially unchanged compared to June. Norges Bank continues to expect the policy rate “will be reduced further in the course of 2025”, if “the economy evolves broadly as currently envisaged”. The June rate path that indicated “one or two additional rate cuts in the course of the year” is still appropriate.
US TSYS: Curve Bear Flattens As PPI Casts Slight Doubt On September Fed Cut
The Treasury cash curve bear flattened modestly Thursday, after strong producer price data cast doubt on Fed easing prospects.
- Early trade was very constructive, with 2 and 5-year yields hitting the lowest levels since early May.
- But the early pullback in yields soon gave way to bear flattening, with July's producer price report coming in much hotter than expected (headline 0.9% M/M vs 0.2% expected), pushing back against the post-CPI narrative that tariffs were not materializing as acutely as feared.
- Released alongside PPI, initial jobless claims were in-line (224k vs 225k expected), continuing to show a steady "low hiring, low firing" labor market dynamic.
- Fed speakers included hawkish 2025 FOMC voter and St Louis Fed President Musalem, who said it's too early for him to decide on whether to support a rate cut in September, while a 50bp cut would be "unsupported" by the fundamentals and the outlook.
- Overall, the day's developments meant a September Fed cut is no longer fully priced (23bp at writing, vs 26bp+ Weds), helping apply pressure on the short-end of the Treasury curve.
- Latest levels: The 2-Yr yield is up 6bps at 3.7345%, 5-Yr is up 5.4bps at 3.8154%, 10-Yr is up 5.4bps at 4.2868%, and 30-Yr is up 5.2bps at 4.8776%. Sep 10-Yr futures (TY) down 11.5/32 at 111-26 (L: 111-24.5 / H: 112-14)
- Friday's calendar includes several key data points including retail sales, import prices, industrial production, the Empire State manufacturing survey, and preliminary University of Michigan August consumer sentiment - not to mention the Trump-Putin summit in Alaska in late afternoon ET.
OVERNIGHT DATA
US DATA: PPI Price Pressures Pick Up Strongly Across Board In July
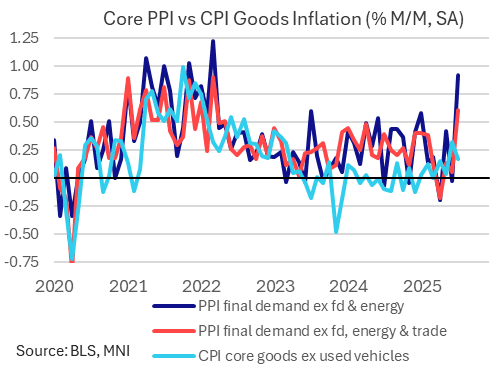
July's Producer Price Index report was one of the strongest in years on a month-to-month basis in the major core aggregates. In contrast to this week's more benign core goods CPI reading than was expected, this will reignite concerns that tariffs will increasingly feed through to consumer prices in the months ahead.
- The headline PPI reading of 0.9% M/M greatly exceeded expectations (0.2%), with ex-food/energy (0.9% vs 0.2%) and "core" ex-food/energy/trade (0.6% vs 0.2%) likewise well to the upside. All had been flat M/M in June, though among revisions, June's core figure was nudged up 0.1pp to mark a positive reading (+0.05% M/M unrounded). For all three categories, this was the highest M/M PPI reading in 40 months.
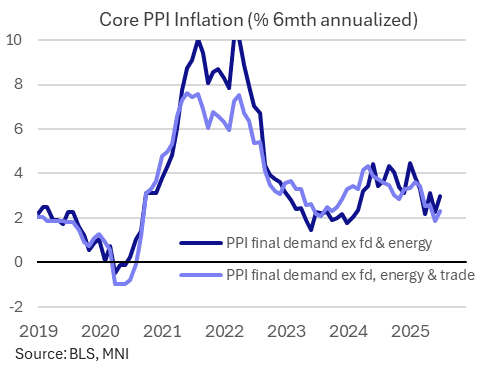
- While all three had seen slowing momentum over the last several months, this print has singlehandedly started to reverse the trend: the 6-month annualized moving average core PPI rose to 2.3% from 1.9% (which had been a 57-month low), with the 3-month measure up to 3.2% from 0.0%. To be sure these are still relatively behaved (Y/Y was 2.8%), but another month close to this in August will see the tide turn decisively.
- The potentially tariff-related details are worrisome depending on where you look, but overall both services and goods saw outsized price rises.
- Final demand services prices rose 1.1% M/M (-0.1% prior), the fastest since March 2022. The report notes that more than 30% of the rise in prices for final demand services was due to margins for machinery and equipment wholesaling (+3.8%), with trade services +2.0% overall (highest since March 2022) though some of the notorious imputed volatile services prices such as portfolio management/investment advice also played a part (though only added around 0.1-0.2pp to total PPI), and furniture retailing prices fell.
- And in final demand goods, one-quarter of the 0.7% M/M rise (fastest since January, and vs 0.3% prior) was due to higher vegetable prices. The core (ex-food/energy) reading of 0.4% was an advance from 0.2% prior and the fastest since January 2023.
- PPI finished goods rose a fairly non-descript 0.5%, but PPI finished services - which has at times correlated well to "supercore" inflation - rose 1.0%, easily the fastest since March 2022. This may be seen as a sign that wholesale price inflation is close to spilling over into consumer price categories, though again overall momentum doesn't appear to be worrisome unless confirmed by another hot/warm print in August.
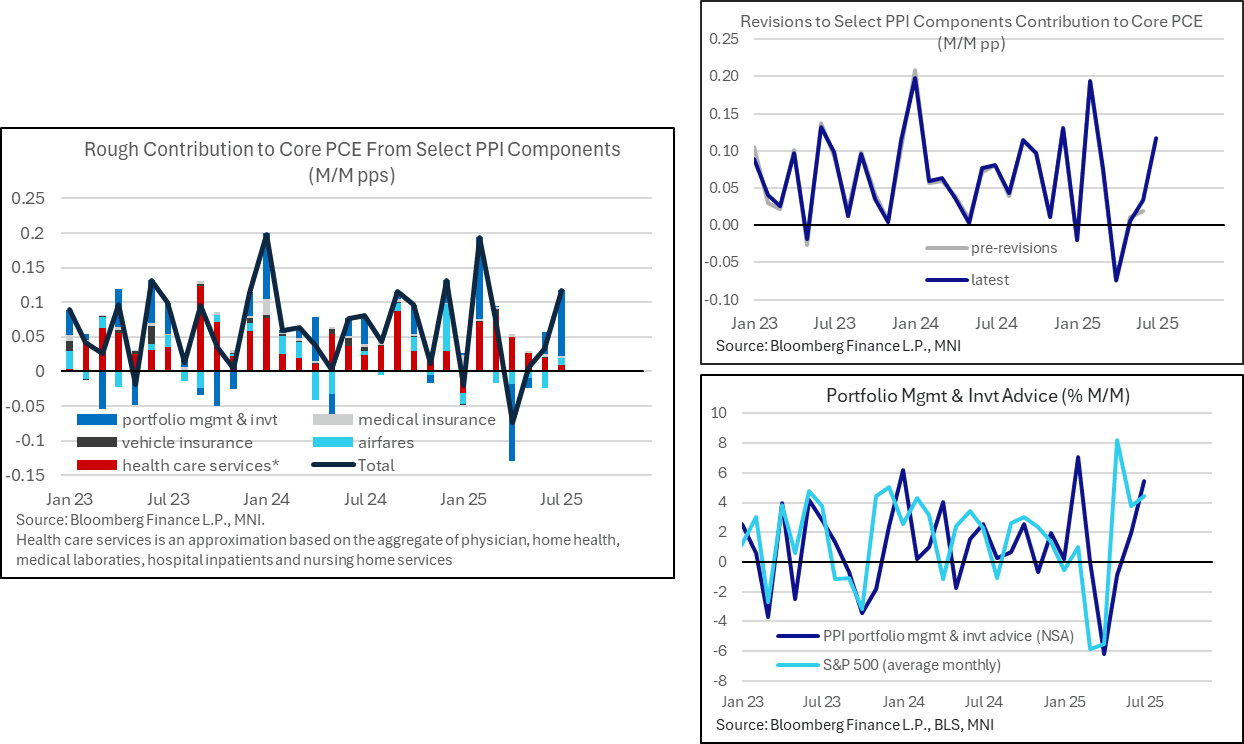
US DATA: PPI Details Suggest Higher Core PCE Estimates For July
- Our proxy for core PCE contributions from typically important PPI categories sees them adding 0.12pps to M/M core PCE in July after 0.03pps in June (hardly revised from 0.02pp prior).
- It’s dominated by portfolio management & investment advice adding 0.10pps, on the back of a 5.4% M/M increase after a near unrevised 1.94%. M/M.
- It’s hard to get a sense of consensus here but Nomura had pencilled in 2.7% M/M. The series had been notably ‘underperforming’ recent stock market moves.
- Recall that Tuesday’s CPI report saw core PCE estimates for July center on 0.25% M/M vs a tentative 0.31% M/M prior to CPI. It follows 0.26% M/M in June prior to any revisions.
- These select details crudely suggest core PCE estimates back into at least a 0.30-0.35 range with some upside risk beyond that (considering core CPI was 0.32% M/M). It will of course depend on what analyst had penciled in for various components as some other details were on the soft side.
US DATA: Another Low Fire Low Hire Jobless Claims Report
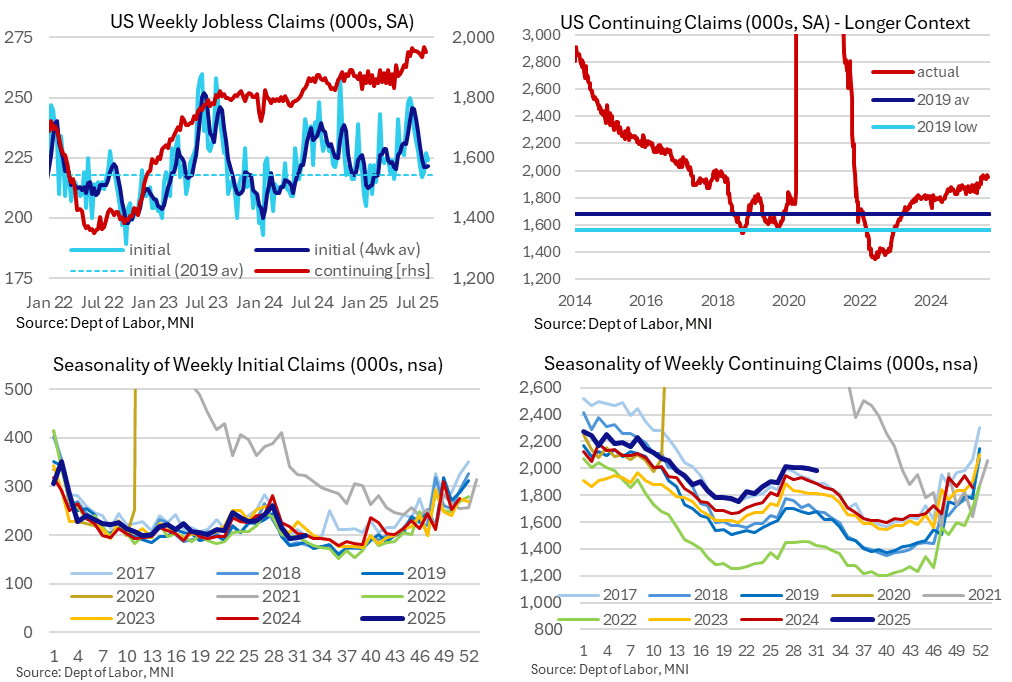
Jobless claims were as expected in latest weekly data at a still historically low level whilst continuing claims dipped after a slightly lower than first thought recent high in the previous week. The data continue to paint a picture of low levels of layoffs but also some continued pressure on those without a job.
- Initial jobless claims nudged down to 224k (sa, cons 225k) in the week to Aug 9 after a marginally upward revised 227k (initial 226k) in the week prior.
- The four-week average ticked up 1k to 222k and has broadly stabilized here since mid-July at levels close to the 218k averaged in 2019.
- Continuing claims meanwhile were lower than expected as they eased to 1953k (cons 1967k) in the week to Aug 2 after yet another downward revision to 1968k (initial 1974k).
- That still leaves the previous week for continuing claims at a fresh high since late 2021 but it’s a little closer to the previous high of 1964k in June. We wrote last week that continuing claims had been revised lower in at least the fifteen previous weekly reports.
- Somewhat more notably though, the NSA level of continuing claims is settling at a level more clearly above the typical range for non-pandemic years having previously been right at the high end.
- That suggests the SA process might be a little more favorable. However, it's also worth noting that due to the recent rise in covered employment as part of its quarterly adjustment, the claim rate dipping a tenth to 1.28% left it at a level that it has seen in most weeks since late May (covered employment the denominator for this rate).
- Taking a step back with a historical comparison, initial claims are close to the 2019 average of 218k when the unemployment rate averaged 3.67% whilst continuing claims are close to the 2017 average of 1957k when the u/e rate averaged 4.36%. The latest u/e rate stood at 4.25% in July but remains close to the 4.15% averaged for over a year now.
SOFR FIXES AND PRIOR SESSION REFERENCE RATES
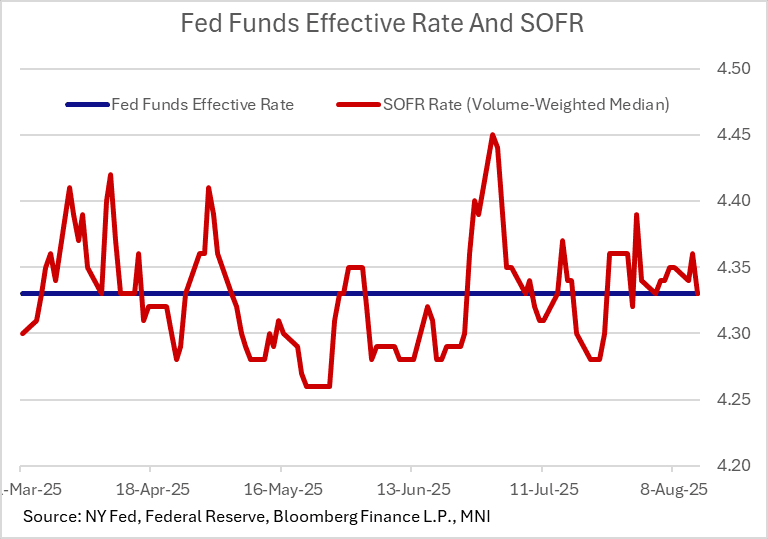
US TSYS/OVERNIGHT REPO: Secured Rates Dip Between Treasury Settlement Days
Secured rates pulled back sharply Wednesday, reversing Tuesday's Treasury supply-led rise. SOFR fell 3bp to 4.33%, with BGCR and TGCR down 2bp each. That's the lowest SOFR rate since Aug 4.
- While Wednesday's softening was expected, pressures are expected to start rebuilding today amid $42B in net bill settlements, followed by $35B in coupon settlements Friday.
REPO REFERENCE RATES (rate, change from prev. day, volume):
* Secured Overnight Financing Rate (SOFR): 4.33%, -0.03%, $2796B
* Broad General Collateral Rate (BGCR): 4.32%, -0.02%, $1177B
* Tri-Party General Collateral Rate (TGCR): 4.32%, -0.02%, $1146B
New York Fed EFFR for prior session (rate, chg from prev day):
* Daily Effective Fed Funds Rate: 4.33%, no change, volume: $116B
* Daily Overnight Bank Funding Rate: 4.33%, no change, volume: $267B
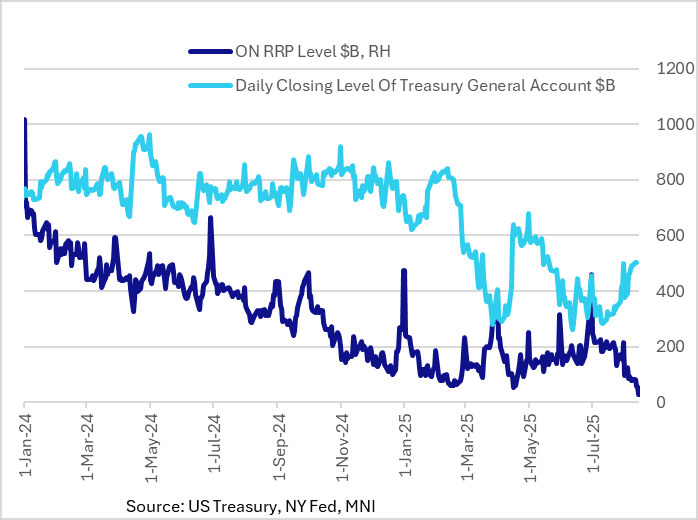
US TSYS/OVERNIGHT REPO: ON RRP Takeup At 4+ Year Lows As Treasury Cash Rebuilds
Takeup of the New York Fed's overnight reverse repo facility fell by $28.4B Thursday to $28.8B, the lowest since April 2021. Similarly, the number of counterparties fell to a post-2021 low of just 14.
- Aside from the usual month-end pickup, takeup has been falling in pronounced fashion as Treasury has begun ramping up bill sales to rebuild the Treasury General Account after the lifting of the debt limit in the first week of July.
- At current levels, ON RRP is basically negligible compared with a peak of over $2.5T at the end of 2022.
- We will be interested to see the Fed's weekly balance sheet release later today for the current level of system reserves versus ON RRP and TGA. So far reserves have remained relatively unchanged despite a sharp rise in the TGA, with ON RRP instead falling.
BONDS: EGBs-GILTS CASH CLOSE: US Pipeline Inflation Snuffs Out Early Gains
Unexpectedly strong US pipeline inflation data snuffed out a nascent European bond rally Thursday.
- After a small dip in yields in a relatively quiet European morning session, global yields spiked led by Treasuries in early afternoon after US producer price inflation came in much higher than expected in July, pointing to potential pipeline CPI pressures from tariffs.
- The brunt of the sell-off was felt by the long end, with curves bear steepening.
- Gilts underperformed Bunds on the day, with UK monthly economic activity data and headline Q2 GDP readings largely firmer-than-expected.
- 10Y Gilts reversed the prior session's rally, with yields closing at the highest level since Jul 28.
- Eurozone data was less impactful: Q2 GDP confirmed flash estimates at 0.1% Q/Q, with quarterly employment also growing at 0.1%; June industrial production was weaker-than-expected.
- Periphery / semi-core EGB spreads closed slightly wider, reversing early session tightening.
- Friday's calendar contains neither top-tier data nor ECB/BOE speakers, putting most of the global focus on the US-Russia talks over Ukraine due after the European cash close.
Closing Yields / 10-Yr EGB Spreads To Germany
- Germany: The 2-Yr yield is up 1.2bps at 1.946%, 5-Yr is up 2.6bps at 2.283%, 10-Yr is up 3.2bps at 2.712%, and 30-Yr is up 3.9bps at 3.267%.
- UK: The 2-Yr yield is up 4.5bps at 3.908%, 5-Yr is up 4.3bps at 4.052%, 10-Yr is up 5.2bps at 4.641%, and 30-Yr is up 6.4bps at 5.492%.
- Italian BTP spread up 0.8bps at 77.9bps / French OAT up 0.3bps at 65.9bps
FOREX: Hotter PPI Stalls USD Downtrend
- A hotter PPI print helped stall the USD's recent slippage - snapping the losing streak in the USD Index that had resulted in a break of support. PPI came in higher than forecast on both a final demand and ex-food and energy basis, helping undo a large part of the market reaction to CPI earlier in the week. This should feed through positively into the latest PCE view at the Fed, and could limit the space for easing later this year - although OIS markets still showed a September rate cut as the likely outcome.
- AUD held losses into the Thursday close, erasing any marginal gains on the labour market data. Thursday price action countered the gradual uptrend in AUDUSD throughout this month, and counters any support for the currency stemming from risk sentiment - as US equities remain at alltime highs. This raises the question of whether AUD would be able to capitalize on any further risk-on, for example driven through a potential Russia-Ukraine ceasefire.
- Stronger-than-expected Q2 UK GDP of 0.3% Q/Q led EURGBP on track for its sixth consecutive daily decline, with breach of key support through the 0.8611-13 level further pressuring the pair which now sits at its lowest reading since early July. This leaves markets contemplating a deeply divided MPC, and Bailey's appearance at Jackson Hole next week, as well as UK CPI is scheduled for next Wednesday, will be carefully watched.
- JPY outperformed throughout the trading day, with recent weakness putting the price through support drawn off the early August lows as well as 146.71, a key retracement. Price action this week marks a full reversal of the previously overbought condition, keeping the downside argument in focus.
- Just ahead of the Friday close, Presidents Trump and Putin are set to meet in Alaska. The meeting is set to continue for an indeterminate period of time before, reportedly, the Presidents will hold a joint press conference (however Trump stated that a joint appearance would be contingent on results of the meeting itself). Any appearance is likely to be well after the market close, leaving any reaction to Monday trade.
- On data, Friday focus shifts to the Japanese GDP print for Q2, Chinese retail sales and industrial production stats for July, rounded off with US retail sales, industrial production and prelim UMich sentiment data. There are no central bank speakers of note.
DATA/EVENTS CALENDAR
| Date | GMT/Local | Impact | Country | Event |
| 15/08/2025 | 0430/1330 | ** | Industrial Production | |
| 15/08/2025 | 0700/0900 | * | CH Flash GDP | |
| 15/08/2025 | 1230/0830 | ** | Monthly Survey of Manufacturing | |
| 15/08/2025 | 1230/0830 | ** | Wholesale Trade | |
| 15/08/2025 | 1230/0830 | *** | Retail Sales | |
| 15/08/2025 | 1230/0830 | ** | Import/Export Price Index | |
| 15/08/2025 | 1230/0830 | ** | Empire State Manufacturing Survey | |
| 15/08/2025 | 1230/0830 | *** | Retail Sales | |
| 15/08/2025 | 1300/0900 | * | CREA Existing Home Sales | |
| 15/08/2025 | 1315/0915 | *** | Industrial Production | |
| 15/08/2025 | 1400/1000 | * | Business Inventories | |
| 15/08/2025 | 1400/1000 | *** | U. Mich. Survey of Consumers | |
| 15/08/2025 | 1400/1000 | ** | University of Michigan Surveys of Consumers Inflation Expectation | |
| 15/08/2025 | 1400/1000 | * | Business Inventories | |
| 15/08/2025 | 1700/1300 | ** | Baker Hughes Rig Count Overview - Weekly | |
| 15/08/2025 | 1700/1300 | ** | Baker Hughes Rig Count Overview - Weekly | |
| 15/08/2025 | 2000/1600 | ** | TICS |