US DATA: Another Low Fire Low Hire Jobless Claims Report
Jobless claims were as expected in latest weekly data at a still historically low level whilst continuing claims dipped after a slightly lower than first thought recent high in the previous week. The data continue to paint a picture of low levels of layoffs but also some continued pressure on those without a job.
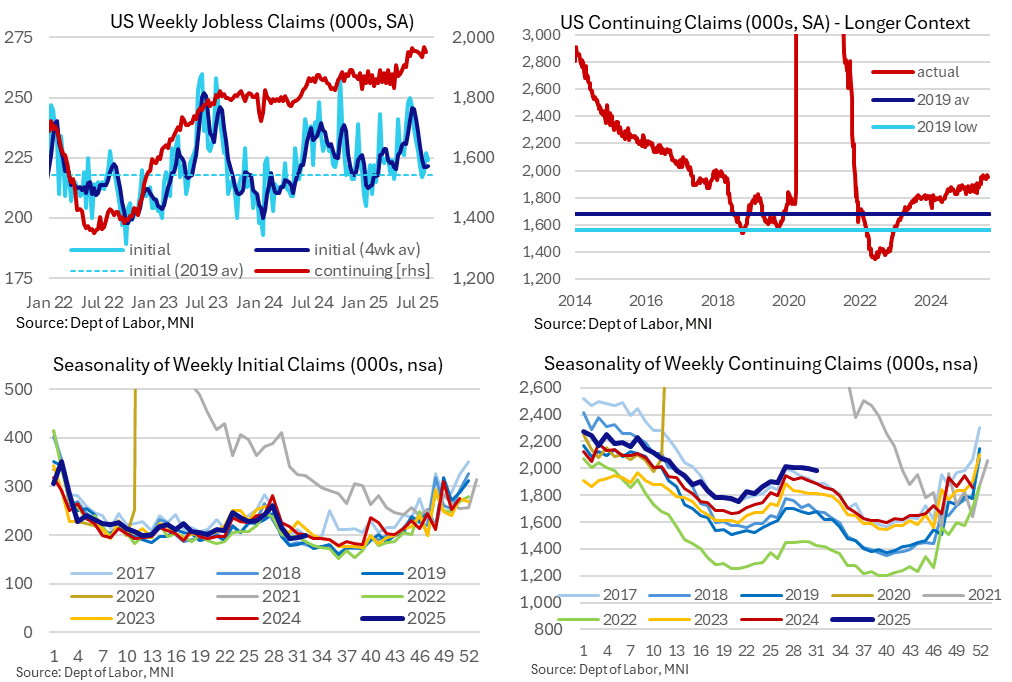
- Initial jobless claims nudged down to 224k (sa, cons 225k) in the week to Aug 9 after a marginally upward revised 227k (initial 226k) in the week prior.
- The four-week average ticked up 1k to 222k and has broadly stabilized here since mid-July at levels close to the 218k averaged in 2019.
- Continuing claims meanwhile were lower than expected as they eased to 1953k (cons 1967k) in the week to Aug 2 after yet another downward revision to 1968k (initial 1974k).
- That still leaves the previous week for continuing claims at a fresh high since late 2021 but it’s a little closer to the previous high of 1964k in June. We wrote last week that continuing claims had been revised lower in at least the fifteen previous weekly reports.
- Somewhat more notably though, the NSA level of continuing claims is settling at a level more clearly above the typical range for non-pandemic years having previously been right at the high end.
- That suggests the SA process might be a little more favorable. However, it's also worth noting that due to the recent rise in covered employment as part of its quarterly adjustment, the claim rate dipping a tenth to 1.28% left it at a level that it has seen in most weeks since late May (covered employment the denominator for this rate).
- Taking a step back with a historical comparison, initial claims are close to the 2019 average of 218k when the unemployment rate averaged 3.67% whilst continuing claims are close to the 2017 average of 1957k when the u/e rate averaged 4.36%. The latest u/e rate stood at 4.25% in July but remains close to the 4.15% averaged for over a year now.
Want to read more?
Find more articles and bullets on these widgets:
Historical bullets
US DATA: Restaurant Prices, Energy Services Boost Headline CPI
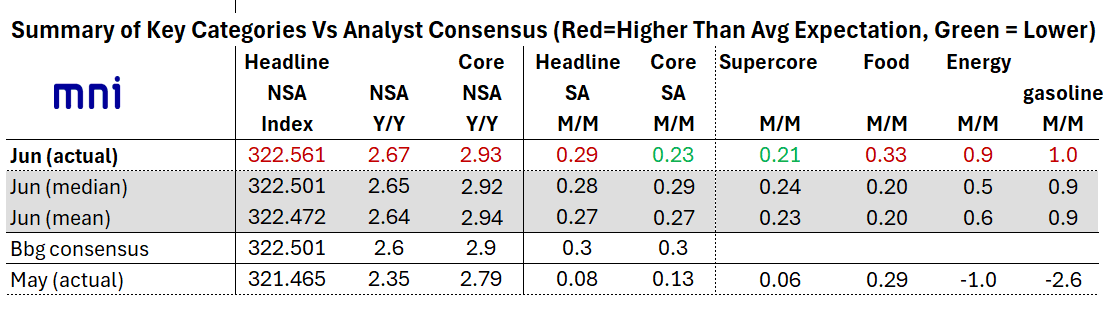
In contrast to core CPI, headline inflation was stronger in June than expected, rising 0.29% M/M (0.28% MNI median, 0.08% prior), for a 2.93% Y/Y rate (2.92% MNI median, 2.79% prior). Both food and energy came in above-expected.
- Energy had been expected to re-accelerate from -1.0% M/M in May, and duly delivered with a rise to a 5-month high 0.9% (0.946% unrounded, very close to a 1.0% unrounded figure) vs 0.5% MNI median. Gasoline was largely in-line with a 1.0% rise (0.9% MNI median, -2.6% prior), with the overall energy "beat" appearing to stem from energy services which rose 0.9% after 0.4%: gas service prices were up 0.5% after -1.0%, with electricity ticking up to 1.0% from 0.9%.
- The bigger surprise was in food prices, which rose to a 3-month high 0.33% M/M - an unexpected acceleration from 0.29% prior (0.24% MNI median expected).
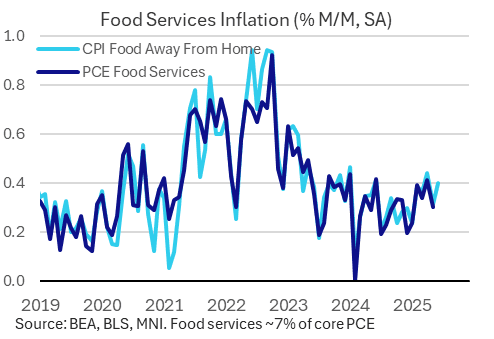
- Food at home prices were steady at 0.28% M/M (0.27% prior) on a mixed performance across categories (BLS: "Three of the six major grocery store food group indexes increased in June, while the other three declined"), but food away from home inflation picked up to 0.40% (0.31% prior). The latter may provide a bit of a boost for core PCE expectations vs the initial CPI readthrough, as it feeds into the food services PCE category.'
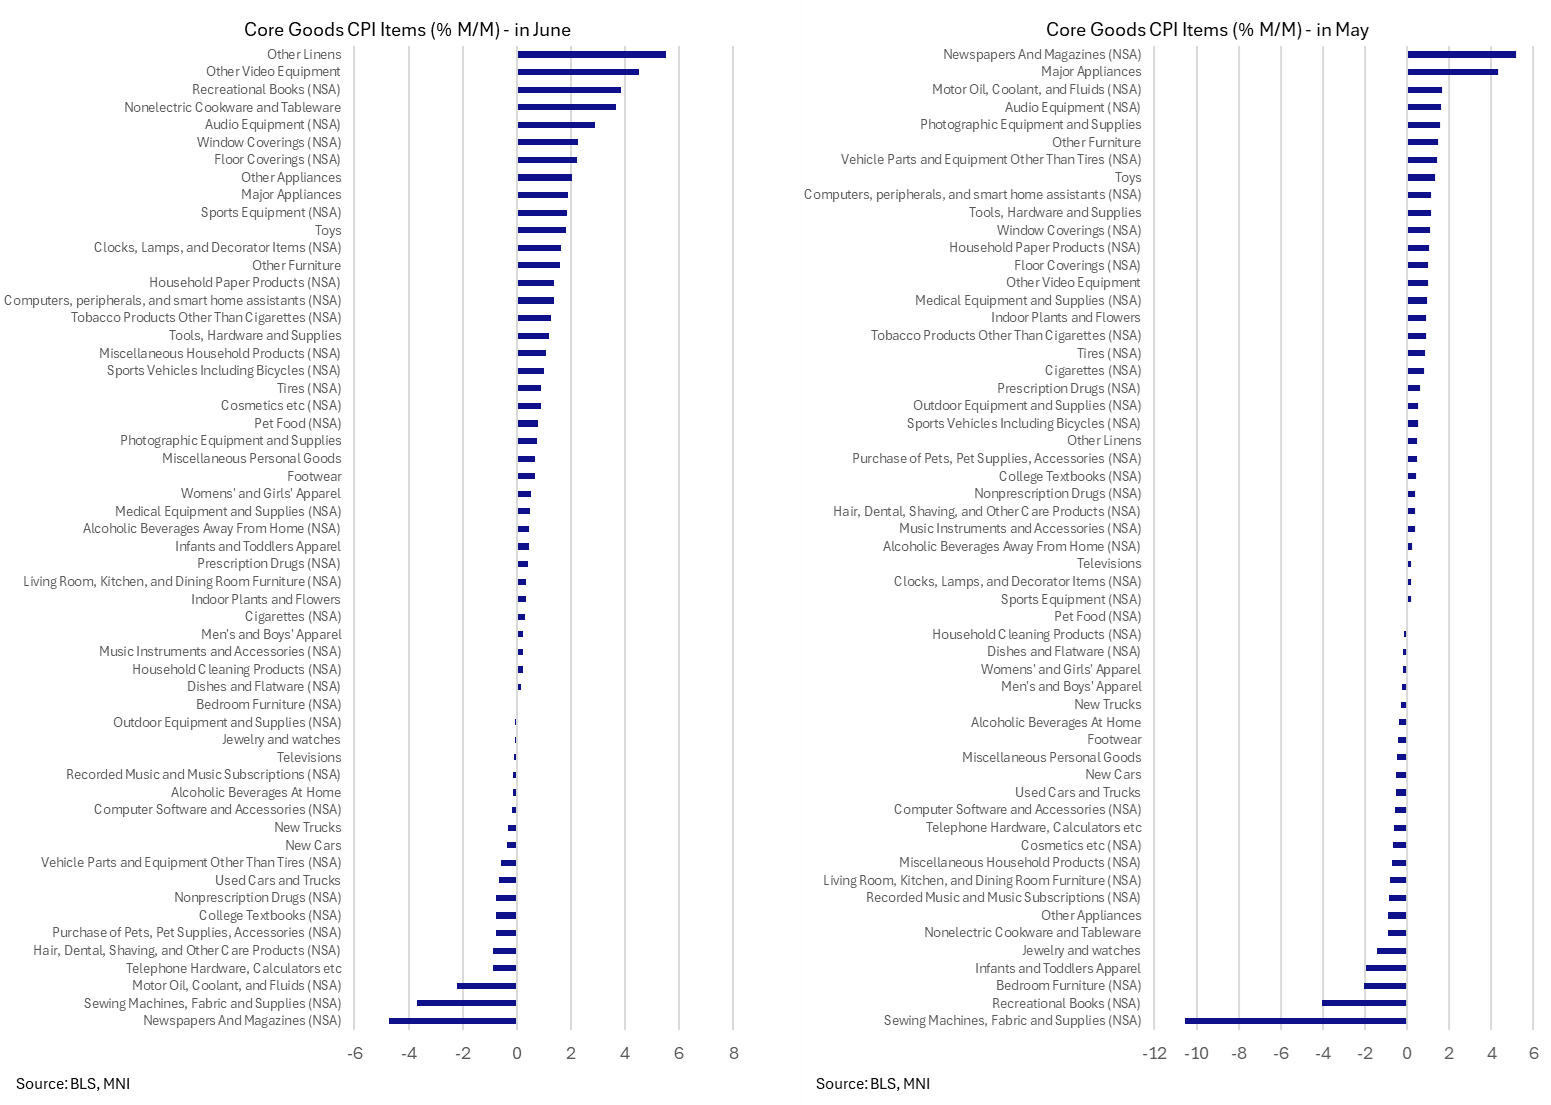
US DATA: A Wide Range Of CPI Core Goods Items See M/M Acceleration In June
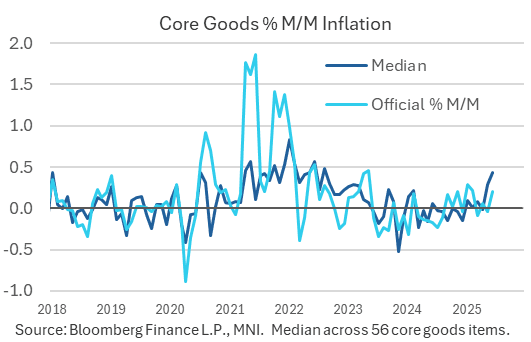
- Core goods inflation of 0.20% M/M was close to expectations in June (average of 0.18% M/M across seven analyst estimates) after -0.04% M/M in May and 0.06% in April.
- It came despite a slightly larger than expected decline in used car prices (-0.67% M/M vs median estimate of -0.50% or mean of -0.15%) along with new cars also falling -0.3% M/M.
- These large ticket items masked a broader increase in core goods across 56 items for a second month, with a median increase of 0.44% M/M in June after 0.29% in May and -0.01% in April.
- This 0.44% M/M doesn’t materially change anything from a "largest since x" point (now since Aug and not Sep 2022) but is another marked acceleration – see chart.
- For context, this median averaged 0.32% in 2021 and 0.39% in 2022 and peaked at 0.84% in Jan 2022.
- One point of caution: you can see in the second chart below just how many of these series that feed into core goods are NSA.
STIR: Fed Pricing A Little More Dovish After CPI Took Edge Off Bessent's Comment
Fed pricing sees a modest dovish reaction to the CPI data, although the readings provided little differentiation vs. headline BBG survey expectations on net (but did include a 0.1ppt downside surprise for unrounded M/M core CPI & a 0.1ppt upside surprise for unrounded headline CPI).
- Unrounded supercore was pretty close to the average of a limited survey sample, with our macro team noting that it was core services that limited inflation, while core goods provided a slightly hawkish surprise (see previous bullets for greater details on the release)
- A reminder that hawkish adjustments were seen ahead of the data, after Treasury secretary Bessent’s left some feeling that there may have been a more hawkish surprise in the offing.
- We suggested that he may have just been referring to a roughly in-line print given consensus expectations for a move higher across the major CPI metrics vs. May levels. This seems to have been proven true.
- FOMC-dated OIS shows 1bp of easing for this month’s decision, 16bp through September, 31bp through October and 47bp through year-end.
- That compares to 1bp, 15bp, 29bp and 46bp ahead of the data and 1bp, 17bp, 31bp and 49bp before Bessent spoke.
- SOFR-implied terminal rate pricing at 3.22% vs. 3.25% ahead of the data and 3.23% pre-Bessent (corrected from 3.33% when previously published).