MNI ASIA OPEN: Markets Discount Soft CPI Inflation, Caveats
EXECUTIVE SUMMARY
- MNI BOE WATCH: Narrow Vote For Cut, Close Calls Ahead
- MNI BRIEF: ECB On Hold, Inflation At Target in 2028
- MNI US DATA: Initial Claims Remain Tame In Payrolls Reference Week
- MNI US DATA: Tame Headline CPI Belies Core Distortions, Food/Energy Divergence
- MNI US DATA: Regional Fed Metrics Call BLS CPI Signals Into Further Question
US
MNI US DATA: Regional Fed Metrics Call BLS CPI Signals Into Further Question
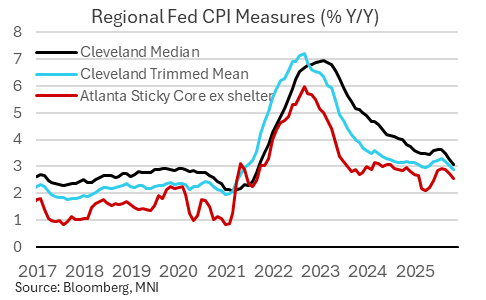
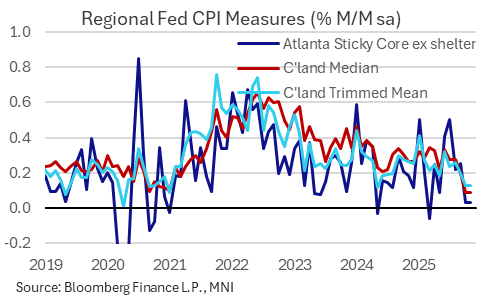
The Cleveland and Atlanta Feds have published their usual measures of underlying inflation following the delayed/abbreviated Oct/Nov CPI report. As with the latter, the measures of October and November inflation were soft but carried significant methodological issues, and should be interpreted with caution.
- Starting with the Cleveland Fed's median CPI measures: they interpolated October data from the November CPI figures, leading them to post 0.09% M/M median increases in both October and November vs 0.20% in September.
- That's extremely low: we haven't seen back to back figures that low since 2010 (the 16% trimmed mean measures of 0.13% for both months was a post-pandemic low). It's suggestive of the BLS having underestimated several November indices. The Y/Y figures printed 3.1% for median and 2.9% for trimmed mean, rates not seen since 2021 though these had more clearly been trending lower over recent months.
- The Atlanta Fed's "sticky" CPI measures showed similar outcomes, with core ex-shelter printing a miniscule 0.03% M/M for each of October and November - like Cleveland, the October figure was interpolated. Those are levels seen only rarely since 2020 and not in consecutive months. The Y/Y rate fell to 2.6% from 2.7% for a 5-month low.
- We're a little surprised the regional Feds published these data at more or less face value; they appear to have interpreted the BLS's November ex-housing indices as many (including us) did: as reflecting a 2-month change, as opposed to a "zero" percent change in the October column.
- However, the extremely soft readings across all of the relevant underlying metrics suggest that downward biases to the BLS's latest inflation indices, whether via collection or via methodological choices, heavily distorted the latest report.
NEWS
MNI BOE WATCH: Narrow Vote For Cut, Close Calls Ahead
The Bank of England cut its policy rate by 25 basis points in December by the narrowest possible margin, with a five-to-four vote in the Monetary Policy Committee, and said that the case for further easing was becoming more finely balanced. Governor Andrew Bailey, as widely expected, was the key swing voter, switching from the no-change camp in November to support December's cut.
MNI BRIEF: ECB On Hold, Inflation At Target in 2028
The European Central Bank left its three key interest rates unchanged on Thursday and confirmed in an updated economic assessment that inflation should stabilise at the 2% target in the medium term. The interest rates on the deposit facility, the main refinancing operations and the marginal lending facility will remain unchanged at 2.00%, 2.15% and 2.40% respectively.
US TSYS
MNI US TSYS: Early Volatility on Noisy CPI Inflation Data, New Methodologies
- Treasuries look to finish higher - but well off this morning's post-data knee-jerk highs after softer than expected CPI inflation data as markets dug deeper into the BLS release. Headline inflation came in softer than expected across monthly average and Y/Y measures in the November (and partial October) report, but caveats abound.
- Currently, TYH6 trades +8 at 112-24 vs. 112-31 high, the move higher has exposed 113-00+, a Fibonacci retracement. Clearance of this level would open 113-07, the Dec 3 high. It is possible that recent gains are corrective.
- It appears that the November aggregate indices were downwardly biased by distortionary housing CPI readings for November (even if, as we note, it will never be known whether the bias was to the upside or the downside given October's data will never be collected).
- The Cleveland and Atlanta Feds have published their usual measures of underlying inflation following the delayed/abbreviated Oct/Nov CPI report. As with the latter, the measures of October and November inflation were soft but carried significant methodological issues, and should be interpreted with caution.
- No substantive reaction in Tsys to the BoE cutting 25bp with a five-to-four vote in the Monetary Policy Committee, the ECB left its three key interest rates unchanged and confirmed in an updated economic assessment that inflation should stabilise at the 2% target in the medium term.
- Friday data calendar: Home Sales, Michigan Sentiment, and NY Fed Williams will be interviewed on CNBC at 0830ET.
OVERNIGHT DATA
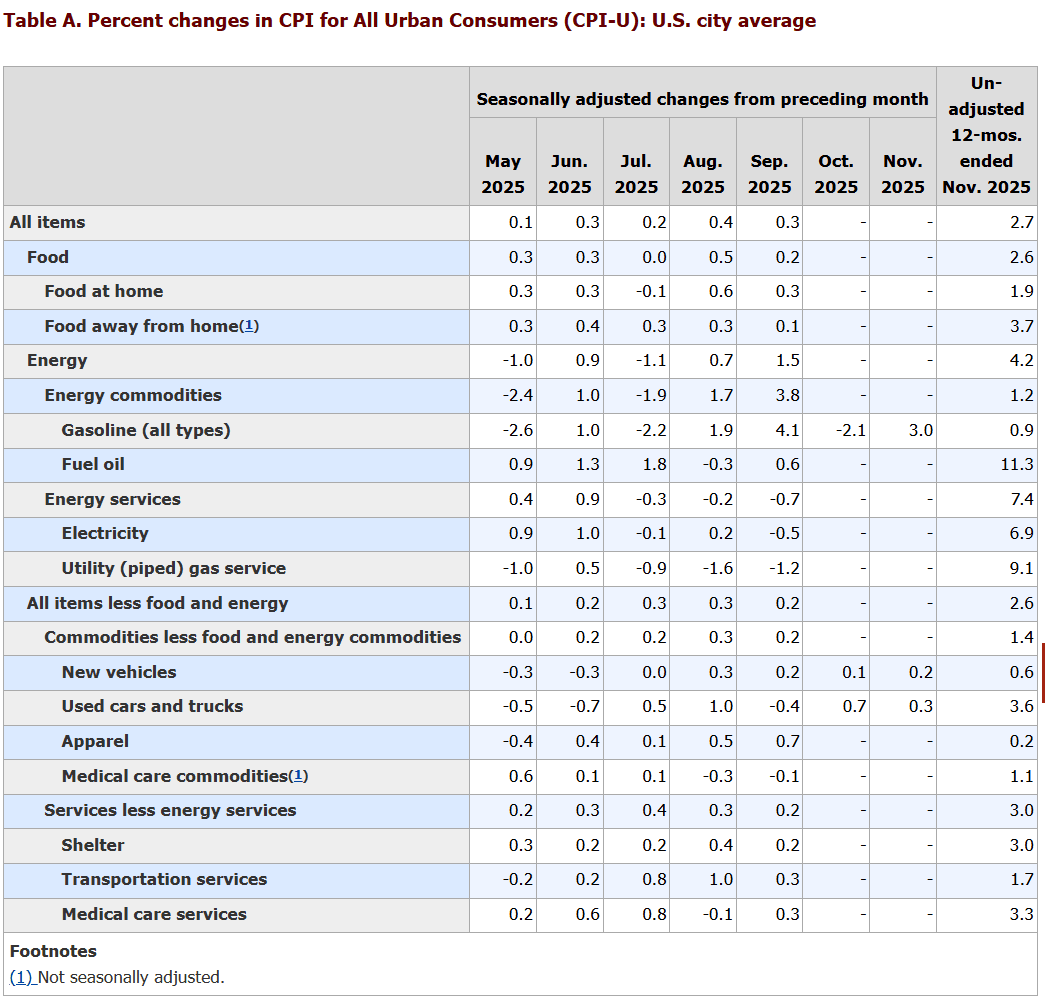
MNI US DATA: Tame Headline CPI Belies Core Distortions, Food/Energy Divergence
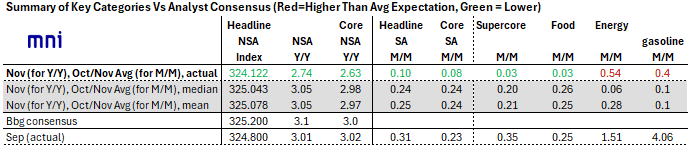
Headline inflation came in softer than expected across monthly average and Y/Y measures in the November (and partial October) report, but caveats abound. As noted it appears that the November aggregate indices were downwardly biased by distortionary housing CPI readings for November (even if, as we note, it will never be known whether the bias was to the upside or the downside given October's data will never be collected).
- That being said, the 2.74% Y/Y reading for November was well below the 3.05% expected, with the downside being driven by the downside miss to core (2.63% vs 3.05%) which in turn will have incorporated the questionably soft housing figures.
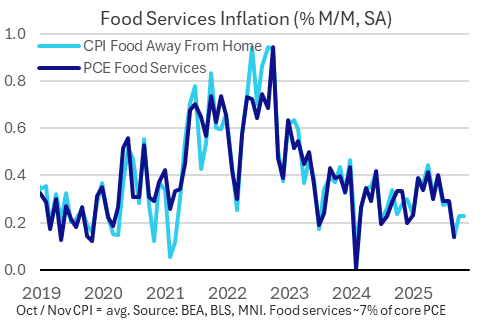
- Headline CPI came in around 0.10% M/M on average in Oct and Nov (2-month rise was 0.20%). Both food and energy inflation softened on an average M/M pace compared with September though dynamics vs expectations varied.
MNI US DATA: Core Services Drive Surprisingly Soft Y/Y Inflation In November
- Headline CPI was far softer than expected in November at 2.74% Y/Y (we had seen a median estimate of 3.05) after 3.01% in Sep. It was led by core CPI at 2.63% Y/Y (median estimate of 2.98) after 3.02% in Sep.
- Core services drove the moderation on the month to 3.02% Y/Y after 3.47%, whilst core goods saw a smaller moderation to 1.39% Y/Y from 1.54% in September.
- Rent components played a sizeable role in this core services moderation, with OER at 3.36% Y/Y vs 3.76% in Sept and primary rents at 2.96% Y/Y vs 3.40% in Sept.
MNI US DATA: Core CPI Averages Soft 0.08% In Nov and Oct; Subcategories Very Limited
The two-month change in core CPI (Nov vs Sept) comes in at 0.159% SA, which roughly speaking translates into an 0.08% M/M average for each of Nov and Oct - well below the 0.24% M/M average expected for those two months (and 0.23% M/M in September).
- The number of M/M categories included for October is very limited: Gasoline, New and Used vehicles are on the list but not much else (items such as Postage and Wireless telephone services and leased cars and trucks).
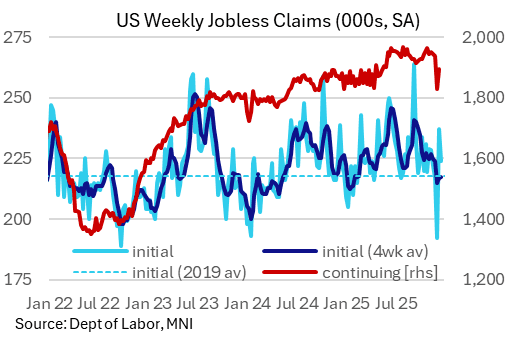
MNI US DATA: Initial Claims Remain Tame In Payrolls Reference Week
Initial jobless claims 224k (sa, cons 225k) in the week to Dec 13, covering a payrolls reference period, after 237k (initial 236k). This latest value compares with 222k from the November payrolls reference period, 231k in Oct, 232k in Sep and 234k in Aug. More concerning perhaps were continuing claims which printed 1,897k (sa) in the week to Dec 6 after a downward revised 1830k (initial 1838k), although this was below the expected 1920k and still below the 1900k handle for a second consecutive week (first time since May). NSA claims dropped 75k in the week.
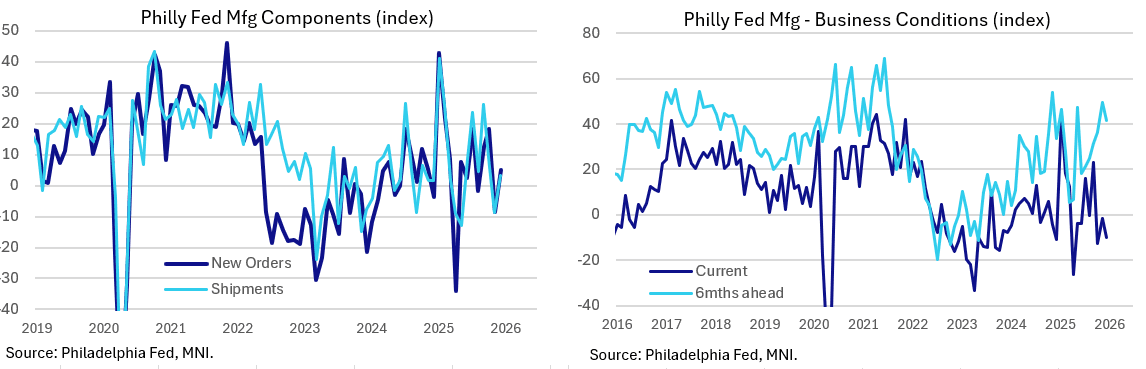
MNI US DATA: Philly Fed Manufacturing Underperforms In December
Philly Fed dropped in December but remained within recent ranges, to -10.2 from -1.7 (a rise to 2.7 had been expected).
- Perhaps counterintuitively, current activity indicators were up: shipments rose after November's 6-month low, to 3.2 (-8.7 prior) with new orders also rising, to 5.0 (-8.6 prior). Employment ticked up to 12.9 from 6.0 prior for the highest since May. As such the Philly Fed report showed some deterioration in December, in similar vein to the Empire survey which tapered off after a strong November.
MARKETS SNAPSHOT
Key market levels of markets in late NY trade:
DJIA up 65.88 points (0.14%) at 47951.85
S&P E-Mini Future up 46.25 points (0.68%) at 6824.75
Nasdaq up 313 points (1.4%) at 23006.36
US 10-Yr yield is down 3.7 bps at 4.1158%
US Mar 10-Yr futures are up 7.5/32 at 112-23.5
EURUSD down 0.0017 (-0.14%) at 1.1724
USDJPY down 0.08 (-0.05%) at 155.61
WTI Crude Oil (front-month) up $0.15 (0.27%) at $56.09
Gold is down $6.29 (-0.15%) at $4332.14
European bourses closing levels:
EuroStoxx 50 up 60.04 points (1.06%) at 5741.71
FTSE 100 up 63.45 points (0.65%) at 9837.77
German DAX up 238.91 points (1%) at 24199.5
French CAC 40 up 64.59 points (0.8%) at 8150.64
US TRASURY FUTURES CLOSE
Curve update:
3M10Y -2.119, 50.234 (L: 47.645 / H: 52.699)
2Y10Y -1.203, 65.58 (L: 64.427 / H: 67.71)
2Y30Y -0.234, 133.886 (L: 131.995 / H: 136.525)
5Y30Y +1.281, 113.906 (L: 112.064 / H: 115.956)
Current futures levels:
Mar 2-Yr futures up 1.5/32 at 104-14.125 (L: 104-12.5 / H: 104-17.5)
Mar 5-Yr futures up 5/32 at 109-15.75 (L: 109-10.25 / H: 109-23)
Mar 10-Yr futures up 8/32 at 112-24 (L: 112-15 / H: 112-31)
Mar 30-Yr futures up 14/32 at 115-22 (L: 115-07 / H: 115-30)
Mar Ultra futures up 17/32 at 118-17 (L: 117-31 / H: 118-29)
MNI US 10YR FUTURE TECHS: (H6) Bull Cycle Extends
- RES 4: 113-22+ High Nov 25 and a key resistance
- RES 3: 113-09 76.4% retracement of the Nov 25 - Dec 10 bear leg
- RES 2: 113-07 High Dec 3
- RES 1: 113-00+ 61.8% retracement of the Nov 25 - Dec 10 bear leg
- PRICE: 112-23 @ 1225 ET Dec 18
- SUP 1: 112-06/111-29 Low Dec 16 / 10 and the bear trigger
- SUP 2: 111-19 1.236 proj of the Oct 17 - Nov 5 - 25 price swing
- SUP 3: 111-11 1.382 proj of the Oct 17 - Nov 5 - 25 price swing
- SUP 4: 111-00 Round number support
The spike higher in Treasuries today highlights a stronger short-term bullish condition and signals scope for a continued retracement of the recent Nov 25 - Dec 10 bear leg. The move higher has exposed 113-00+, a Fibonacci retracement. Clearance of this level would open 113-07, the Dec 3 high. It is possible that recent gains are corrective. A reversal lower would refocus attention on 111-29, the Dec 10 low and a key short-term support.
SOFR FUTURES CLOSE
Current White pack (Mar 26-Dec 26):
Mar 26 +0.025 at 96.510
Jun 26 +0.025 at 96.725
Sep 26 +0.020 at 96.875
Dec 26 +0.025 at 96.930
Red Pack (Mar 27-Dec 27) +0.030 to +0.035
Green Pack (Mar 28-Dec 28) +0.030 to +0.035
Blue Pack (Mar 29-Dec 29) +0.035 to +0.035
Gold Pack (Mar 30-Dec 30) +0.035 to +0.035
REFERENCE RATES
US TSYS: Repo Reference Rates
- Secured Overnight Financing Rate (SOFR): 3.69% (+0.00), volume: $3.289T
- Broad General Collateral Rate (BGCR): 3.66% (+0.02), volume: $1.343T
- Tri-Party General Collateral Rate (TCR): 3.66% (+0.02), volume: $1.312T
- (rate, volume levels reflect prior session)
STIR: FRBNY EFFR for prior session:
- Daily Effective Fed Funds Rate: 3.64% (+0.00), volume: $94B
- Daily Overnight Bank Funding Rate: 3.64% (+0.00), volume: $170B
FED Reverse Repo Operation
RRP usage inches up to $11.708B with 7 counterparties this afternoon vs. Wednesday's $10.361B. Compares to last Thursday's $0.838B (lowest level since mid-March 2021); this years highest excess liquidity measure: $460.731B on June 30.
MNI BONDS: EGBs-GILTS CASH CLOSE: Gilts Underperform As BOE Out-Hawks ECB
EGB yields fell but Gilt yields rose in a busy session Thursday.
- The first major flashpoint of the day was the BOE, which despite delivering the fully-priced 25bp cut triggered a Gilt sell-off led by the front-end amid an expression of a "closer call" on future cuts as well as lack of dovish surprise in the vote split (5-4 as expected).
- While EGBs saw some modest weakness post-BOE compared to Gilts, they would see a notable rise in yields to session highs on the ECB decision which included higher-than-expected growth forecasts. (MNI's review of the ECB meeting is here.)
- However, yields would ultimately pare back from the highs, with ECB's Lagarde noting that rate hike talk was premature, and US CPI showed softer-than-anticipated price pressures (albeit in a messy, delayed report).
- The UK curve twist flattened, with Germany's bull flattening. Periphery/semi-core EGB spreads closed tighter, narrowing alongside equity gains in the European afternoon.
- Friday's schedule includes UK public finances and retail sales data as well as various eurozone confidence surveys, along with a slew of ECB speakers (at least 9 on the docket including Chief Econ Lane).
Closing Yields / 10-Yr EGB Spreads To Germany
- Germany: The 2-Yr yield is unchanged at 2.137%, 5-Yr is down 1.6bps at 2.45%, 10-Yr is down 1.4bps at 2.85%, and 30-Yr is unchanged at 3.485%.
- UK: The 2-Yr yield is up 3.7bps at 3.745%, 5-Yr is up 2.4bps at 3.937%, 10-Yr is up 0.6bps at 4.481%, and 30-Yr is down 1.5bps at 5.208%.
- Italian BTP spread down 1.6bps at 68.9bps / French OAT down 0.4bps at 70.6bps
MNI FOREX: GBP Rallies Post-BOE, But Momentum Dissipates
- In line with this week’s theme of waning appetite across G10 currency markets, pockets of intra-day momentum quickly stalled, prompting very moderate adjustments for the major pairs overall. GBP had an impressive rally following a tweak to the BOE’s guidance, however, only sits marginally firmer on the session as we approach the APAC crossover.
- GBPUSD popped from 1.3350 as the BOE signalled the MPC are approaching the neutral rate and gained further traction following the below-expectation US CI data. However, prior highs around the 1.3450 did a good job at capping the price action. Spot has subsequently fallen back to 1.3380, just above unchanged levels on Thursday.
- The front-end of the EURGBP vol curve has fallen sharply today: 1m implied is below 3.4% for the first time since 2024, which was itself a life-time low on the series going back to 1998. As a result, EURGBP front-end vols are now the lowest they've been for this time of year, ever.
- Elsewhere, higher-than-expected growth forecasts from the ECB also prompted a moderate push higher for the Euro, although optimism was dampened as an ECB sources report underscores Lagarde's ultimate message today: that "Any talk of rate increases was seen as premature". EURUSD held a 50 pip range over all of today’s event risk, perhaps paving the way for contained ranges heading into year-end.
- The Norwegian Krone remains the strongest in G10 after Norges Bank remained on hold as expected but revisions to the rate path pushed back on significant easing expectations ahead. EURNOK fell 0.6% to 11.91, erasing a solid chunk of this week’s advance.
- All the focus now turns to the BOJ, where markets expect a 25bp rate hike to 0.75%. USDJPY has kept a tight 155.29-155.97 range ahead of the decision, while short-term technical parameters appear well defined at 154-158.
- UK and Canadian retail sales are also scheduled Friday, alongside US existing home sales data.
FRIDAY DATA CALENDAR
| Date | GMT/Local | Impact | Country | Event |
| 19/12/2025 | 0700/0700 | *** | Public Sector Finances | |
| 19/12/2025 | 0700/0800 | ** | PPI | |
| 19/12/2025 | 0700/0800 | * | GFK Consumer Climate | |
| 19/12/2025 | 0700/0800 | ** | Retail Sales | |
| 19/12/2025 | 0700/0700 | *** | Retail Sales | |
| 19/12/2025 | 0745/0845 | ** | PPI | |
| 19/12/2025 | 0800/0900 | ** | Economic Tendency Indicator | |
| 19/12/2025 | 0830/0930 | ECB Wage Tracker | ||
| 19/12/2025 | 0900/1000 | ** | EZ Current Account | |
| 19/12/2025 | 0900/1000 | ** | ISTAT Consumer Confidence | |
| 19/12/2025 | 0900/1000 | ** | ISTAT Business Confidence | |
| 19/12/2025 | 1100/1100 | ** | CBI Distributive Trades | |
| 19/12/2025 | 1200/1300 | ECB Cipollone Remarks, Roundtable at Aspen Institute | ||
| 19/12/2025 | 1200/1200 | BOE Market Participants Survey | ||
| 19/12/2025 | 1330/0830 | ** | Retail Trade | |
| 19/12/2025 | 1400/1500 | ** | BNB Business Confidence | |
| 19/12/2025 | 1500/1000 | *** | NAR existing home sales | |
| 19/12/2025 | 1500/1000 | *** | U. Mich. Survey of Consumers | |
| 19/12/2025 | 1500/1000 | ** | University of Michigan Surveys of Consumers Inflation Expectation | |
| 19/12/2025 | 1500/1600 | ** | Consumer Confidence Indicator (p) | |
| 19/12/2025 | 1510/1610 | ECB Lane Lecture at Central Bank of Ireland | ||
| 19/12/2025 | 1630/1630 | BOE to announce APF Q4 Sales Schedule | ||
| 19/12/2025 | 1800/1300 | ** | Baker Hughes Rig Count Overview - Weekly | |
| 19/12/2025 | 1800/1300 | ** | Baker Hughes Rig Count Overview - Weekly | |
| 19/12/2025 | 1800/1300 | ** | Baker Hughes Rig Count Overview - Weekly |