US DATA: Regional Fed Metrics Call BLS CPI Signals Into Further Question
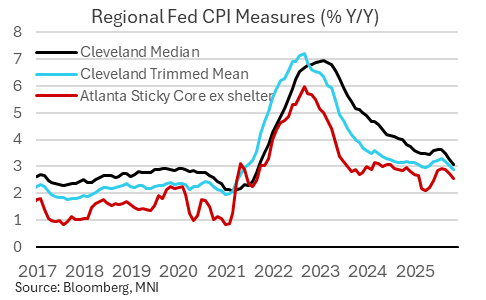
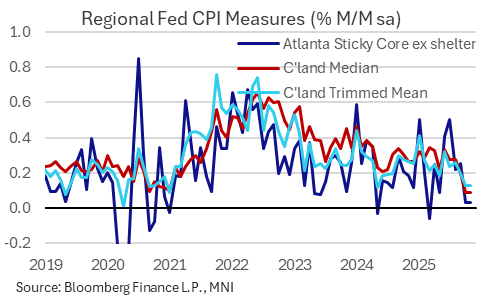
The Cleveland and Atlanta Feds have published their usual measures of underlying inflation following the delayed/abbreviated Oct/Nov CPI report. As with the latter, the measures of October and November inflation were soft but carried significant methodological issues, and should be interpreted with caution.
- Starting with the Cleveland Fed's median CPI measures: they interpolated October data from the November CPI figures, leading them to post 0.09% M/M median increases in both October and November vs 0.20% in September.
- That's extremely low: we haven't seen back to back figures that low since 2010 (the 16% trimmed mean measures of 0.13% for both months was a post-pandemic low). It's suggestive of the BLS having underestimated several November indices. The Y/Y figures printed 3.1% for median and 2.9% for trimmed mean, rates not seen since 2021 though these had more clearly been trending lower over recent months.
- The Atlanta Fed's "sticky" CPI measures showed similar outcomes, with core ex-shelter printing a miniscule 0.03% M/M for each of October and November - like Cleveland, the October figure was interpolated. Those are levels seen only rarely since 2020 and not in consecutive months. The Y/Y rate fell to 2.6% from 2.7% for a 5-month low.
- We're a little surprised the regional Feds published these data at more or less face value; they appear to have interpreted the BLS's November ex-housing indices as many (including us) did: as reflecting a 2-month change, as opposed to a "zero" percent change in the October column.
- However, the extremely soft readings across all of the relevant underlying metrics suggest that downward biases to the BLS's latest inflation indices, whether via collection or via methodological choices, heavily distorted the latest report.
Want to read more?
Find more articles and bullets on these widgets:
Historical bullets
COMMODITIES: Crude Rallies, Precious Metals Rebound
- Crude has rallied in US hours on Tuesday, as ongoing concerns over the impact of sanctions against Russian have offset oversupply fears.
- WTI Dec 25 is up by 1.4% at $60.8/bbl.
- The grace period before the introduction of sanctions on Russia’s Rosneft and Lukoil ends Nov 21 as the market weighs the impact on global flows. The discount on Russia’s Urals benchmark is the highest since June 2023, according to Bloomberg.
- For WTI futures, resistance to watch is $62.59, the Oct 24 high. Clearance of this hurdle would signal scope for a stronger correction.
- On the downside, key support and the bear trigger remains at $55.96, the Oct 20 low.
- Meanwhile, previous metals have rebounded today, with spot gold currently up by 0.9% at $4,080/oz and silver 1.8% higher at $51.1/oz.
- Goldman Sachs said this week that gold could hit $4,900 by the end of 2026, driven by further heavy buying from central banks and private investors. Price could potentially go even higher if the private investors diversification theme gains more traction.
- Meanwhile, UBS said recently that gold could hit $5,000 in 2026 or 2027.
- For gold, recent gains suggest that the correction between Oct 20 and 28 was a correction that allowed an overbought condition to unwind.
- The short-term bull trigger has been defined at $4,245.23, the Nov 13 high. Key support to watch lies at the 50-day EMA, at $3,937.8.
FOREX: USD Index Awaiting Tier-One Data, CAD Notably Outperforms
- Initially, the US dollar was under pressure following the release of a weaker-than-expected US ADP jobs release. However, given the uncertainty surrounding further US data this week, the greenback subsequently recovered, as market participants assess whether data surprises might be viewed through a policy or growth lens.
- The Japanese yen remained immune to the recent weakness for major equity benchmarks and the more forceful verbal warnings from Japanese officials on one-sided adjustments for the currency.
- Additionally, the ongoing tensions between Japan/China, disappointing Q3 GDP data and fiscal related uncertainty continues to provide a pessimistic domestic backdrop, helping USDJPY reach fresh cycle highs above 155.50.
- In similar vein, the Swiss Franc underperforms today, assisting EURCHF further away from the recent false break below medium-term support at 0.9200.
- The Canadian dollar is notably outperforming today, allowing USDCAD to gather downside momentum below the 1.40 mark and breach last week’s lows. Spot has tested the 50-day EMA, intersecting around 1.3970, of which the pair has not closed below since September.
- Price action bolsters the short-term bearish outlook, as the pair continues to trade inside a bull channel drawn from the Jul 23 low. The respect of the channel top on Nov 11, and the subsequent move south highlights scope for a bear extension towards the base of the channel at 1.3893.
- Australian wage price index data will cross Wednesday, before UK CPI for October. Later in the session, the FOMC minutes are due.
USDJPY TECHS: Fresh Cycle High
- RES 4: 156.75 High Jan 23
- RES 3: 155.89 High Feb 3
- RES 2: 155.53 2.00 projection of the Sep 17 - 26 - Oct 1 price swing
- RES 1: 155.50 High Nov 18
- PRICE: 155.06 @ 16:41 GMT Nov 18
- SUP 1: 153.49 20-day EMA
- SUP 2: 152.82 Low Nov 7
- SUP 3: 151.58 50-day EMA
- SUP 4: 150.47 Low Oct 21
USDJPY traded higher again Tuesday, confirming a resumption of the uptrend and an extension of recent gains. The 155.00 handle has been cleared and sights are on 155.53 next, a Fibonacci projection. Note that moving average studies are in a bull-mode position, this continues to highlight a dominant uptrend. Initial firm support to watch is 153.49, the 20-day EMA. A clear breach of the average would signal scope for a corrective pullback.