MNI EUROPEAN MARKETS ANALYSIS: JPY FX Jawboning Continues
- Tokyo Oct CPI was stronger than forecast, but USD/JPY and JGB futures downside had no follow through. The FinMin also jawboned FX markets but intervention risks don't appear imminent.
- NZD and local yields underperformed, with some RBNZ comments helping.
- The China manufacturing PMI fell to a six-month low, weighing on China/HK equities.
- Further Eurozone inflation data highlights the Friday calendar, while Canadian GDP is due later. In the US, the MNI Chicago PMI prints.
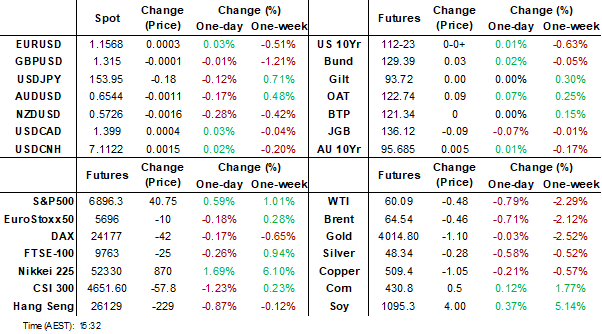
MARKETS
US TSYS: Futures Caught in Technical Range, 10-Yr Back Above 4.10%
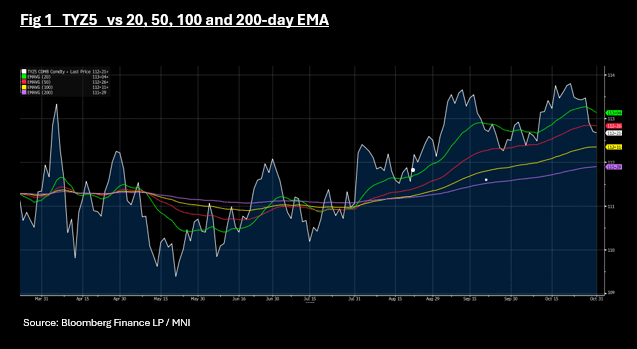
Month end flows were not evident in Asia today with futures doing very little. TYZ5 barely troubled the scorers down just -01 at 112-21+. TYZ5 is currently at the mid-point below the 50-day EMA of 112-26+ and the 100-day EMA of 112-11+.
Cash was quiet also with many maturities failing to hold earlier gains, remaining unchanged Friday.
- The US 2-Yr is at 3.61 (-0.2bps today)
- The US 5-Yr is unchanged at 3.72%
- The US 10-Yr has edged back below the 4.10% earlier but is back to unchanged on the day at 4.101%
- The US 30-Yr is up is unchanged at 4.657%.
With PCE not set to be released tonight due to the government shutdown, focus is on MNI Chicago PMI (40.6 prior, 42.0 estimate) and speeches from Cleveland Fed Hammack & Atlanta Fed Bostic.
Auction wise focus tonight is US$110bn 4-week bills and US$95bn 8-week bills.
JGBS: 2yr JGB Yield Weaker Post Solid Auction, Futures Supported Post Tokyo CPI Dip
JGB futures are up from earlier lows, last 136.13, -.08 versus settlement levels. There was an early dip, aided by the firmer Tokyo CPI print, but there was no follow through. Recent ranges still hold for JGB futures. In the cash JGB space, yield losses have been move evident at the front end, aided by a solid 2yr debt auction (bid to cover of 4.35 versus 2.814 prior). The 2yr yield is down close to 2bps to 0.915%. The broader uptrend in the yield since April of this year remains intact (the 2/30s curve is a touch steeper at +213bps). The 10yr JGB is steady at 1.65%.
- The Tokyo CPI print showed strong m/m momentum across most key categories and a pick up in the y/y to 2.8%. Still, the central bank is likely to want to see further m/m gains before shifting its broader inflation expectations (i.e. its confidence in achieving its inflation target).
- Wages is also the other key focus point, with earlier data some softening in the labour market via a higher unemployment rate, but we remain with recent ranges. IP growth was stronger than forecast but a government official noted that there remains caution around the outlook.
- Looking ahead to next week, the main focus will be on the Sep labour cash earnings data, out on Thursday. This data was softer in recent months and remains a key watch point for the BOJ.
- Market pricing for the Dec meeting, per OIS, is around a 0.59% implied rate, little changed since the end of last week. A full 25bps hike is close to fully priced for the March meeting (using an effective rate of 0.476%).
- The FinMin maintained FX jawboning, but FX intervention risks don't look imminent (based off past language used by officials relative to today's comments).
- In the debt auction space, we have the 10yr, next Wednesday as the next major focus point.
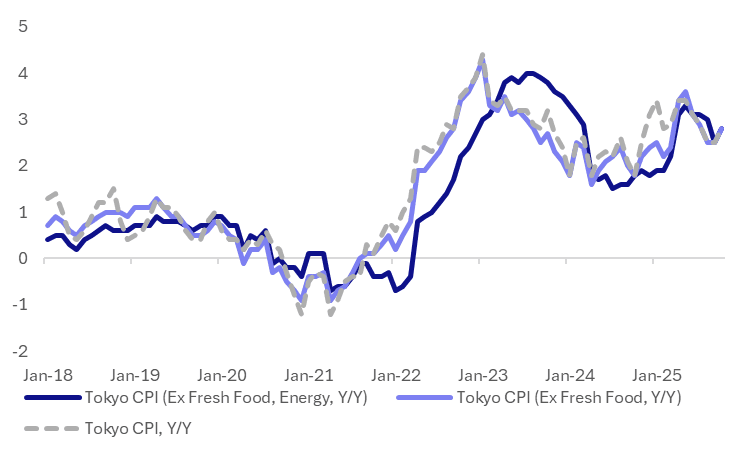
JAPAN DATA: Tokyo CPI Bounces, Strong M/M Detail, Firms Inflation Outlook
Tokyo Oct CPI was stronger than forecast, all the measures at 2.8%y/y, versus 2.4%y/y forecast for headline and 2.6% for the core ex fresh food and core ex fresh food, energy measures. The trends are presented in the chart below. We remain off 2025 highs, but are elevated from an historical standpoint. This data should add incrementally to the BoJ's confidence around achieving its inflation target (in the second half of its forecast horizon to March), but it is only one data print and would likely need to see further m/m evidence before bringing forward when it expects to hits inflation target (and therefore feel confident it can raise rates again). Note that retail and selling prices rose in October amid corporate price revisions typically implemented in April and October. Hence focus will be on follow up Nov/Dec trends.
- The m/m prints were firm across the board. The headline up 0.6%, while ex fresh food was 0.6% higher, and ex fresh food, energy gained 0.75. Goods prices rose 0.9%, while services were up 0.4%, after a 0.4% fall in Sep.
- The utilities 4.8%m/m rise helped the headline rebound, ending a four month run of declines. Subsidies impacted recent trends in this space.
- Gains were solid elsewhere though, with entertainment rebounding +1.9%m/m (after falling 2.6% in Sep). Transport was up 0.9% and household goods rose 0.6%. Food was also firmer at +1.2%m/m. Only clothing was down in m/m terms.
- In y/y terms, trends were relatively steady, with food to 5.9% from 6.1%. Entertainment rose to 2.7% from 1.9% prior. Only 4 out of the 10 sub categories have y/y rates above the 2% level.
Fig 1: Japan Tokyo CPI Y/Y Rebounded In Oct
Source: Bloomberg Finance L.P./MNI
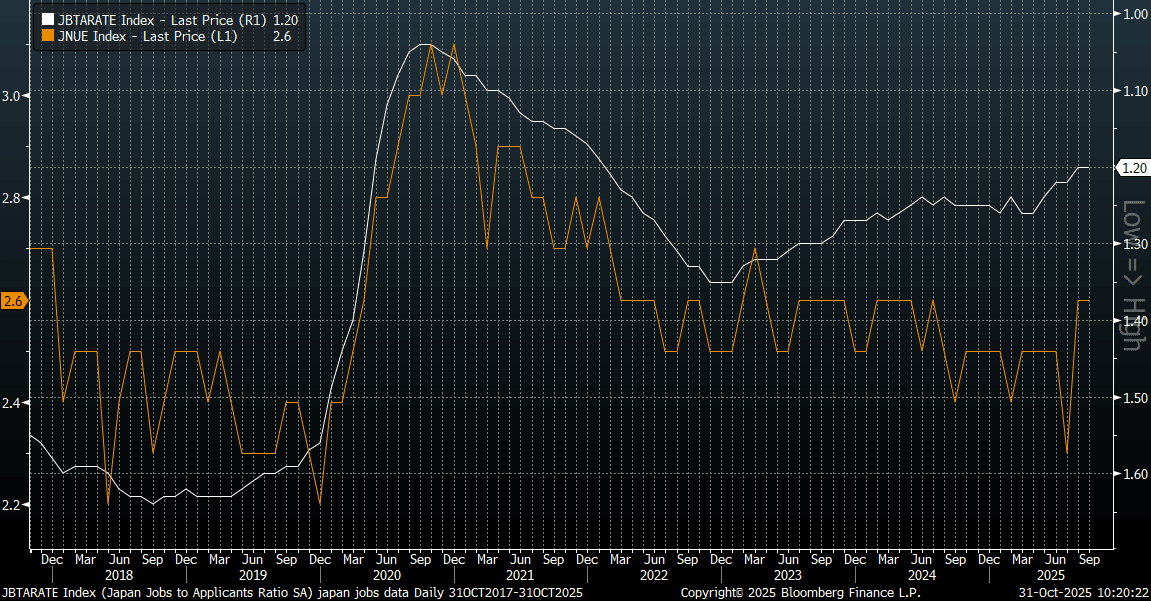
JAPAN DATA: Jobless Rate Edges Up, Job-To-Applicant Ratio At Recent Lows
Other Japan data showed the unemployment rate edged up to 2.6% (above the 2.5% forecast and 2.5% prior outcome). The job to applicant ratio was steady at 1.20, in line with forecasts. The chart below plots this ratio, which is inverted on the chart (and the white line), against the jobless rate (the orange line). The jobless rate is back to recent highs, with the softer job to applicant still pointing to some upside risks. The new job to applicant ratio also continued to move lower to 2.14 from 2.15.
- This data will be a watch point for the authorities and the BoJ, given the wages backdrop remains a key policy focus point. BoJ Governor Ueda stated yesterday that it was still too early to judge the extent of wage hikes in fiscal 2026, though it seems that these would only be slightly higher or lower than last year’s.
Fig 1: Japan Unemployment Rate & Job To Applicant Ratio (Inverted)
Source: Bloomberg Finance L.P./MNI
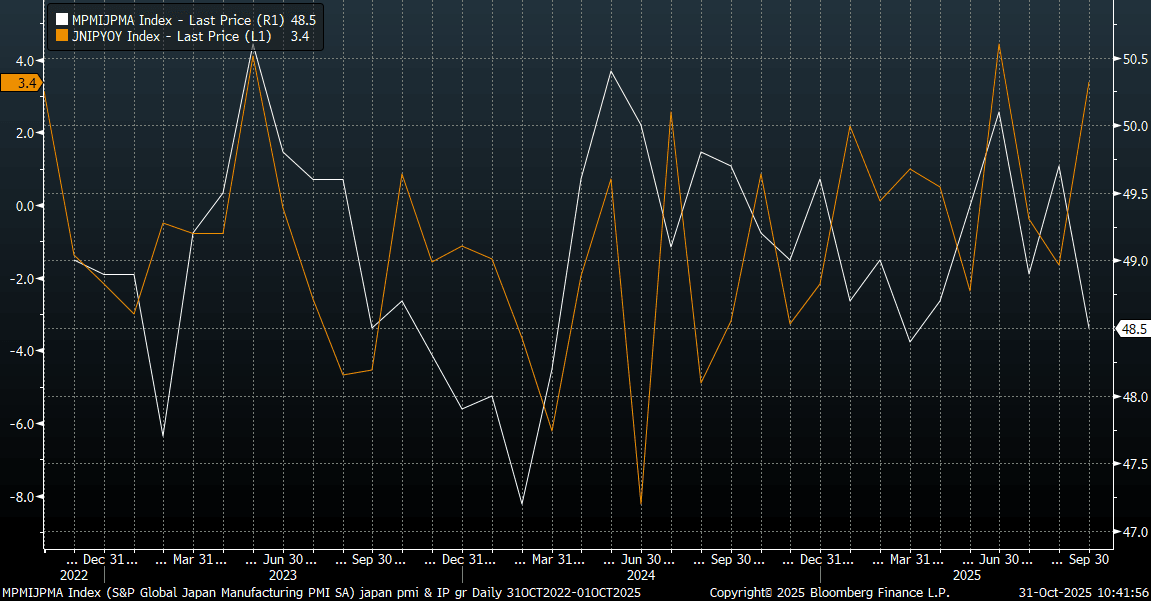
JAPAN DATA: IP Beats Forecasts But Government Cautious On Outlook
Japan Sep (preliminary) industrial production was stronger than forecast. We were up 2.2%m/m, versus a 1.5% forecast and 1.5% fall in Aug). The y/y outcome was 3.4% against a 1.8% forecast and -1.6% Aug outcome. The y/y outcome is just short of mid year highs, but the authorities are not confident this is start of a resurgent trend. A government official noted after the print, that they still can't be optimistic about the production situation and it needs close monitoring (via RTRS).
- The chart below shows IP growth Y/Y (the orange line) versus the Japan manufacturing PMI (white line), with the PMI painting a softer backdrop relative to IP.
- Our policy team noted, the Sep result was led by higher output of production machinery, though automobile production growth slowed. It adds, assuming flat output in December, industrial production would contract 0.1% q/q in Q4, marking a second consecutive quarterly decline following a 0.1% drop in Q3. This assumes METIs forecast of a 1.9%m/m Oct rise, but Nov fall of 0.9% unfolds.
Fig 1: Japan IP Y/Y & Manufacturing PMI
Source: Bloomberg Finance L.P./MNI
JPY: FinMin Delivers FX Jawboning, But Still Appears Short Of Taking Action
Headlines have crossed from the Japan FinMin, with the latest round of verbal jawboning on FX. USD/JPY is drifting a little lower in response, last in the 153.70/75 region. At this stage the level of concern around FX weakness is edging up (as spot yen continues to weaken), but we appear to remain short of rhetoric that suggests intervention risks are a lot stronger.
- Notably: "JAPAN FINMIN KATAYAMA: CLOSELY WATCHING FX MOVES WITH A HIGH SENSE OF URGENCY - [RTRS], along with
- "JAPAN FINMIN KATAYAMA: RECENTLY SEEING ONE-SIDED, RAPID MOVES, JAPAN FINMIN KATAYAMA: IMPORTANT FOR CURRENCIES TO MOVE IN STABLE MANNER REFLECTING FUNDAMENTALS" RTRS"
- These comments are still broadly in line with recent rhetoric around FX.
- There appear short of previous commentary which has suggested heightened intervention risks: Examples include, “We can’t tolerate speculative moves.”
- “We will take appropriate action if needed.” or “We won’t rule out any options/means to combat excessive movements.” (via BBG).
- Recent highs in the pair rest at 154.45, which came yesterday in the aftermath of the indifferent BoJ hold (with no fresh guidance on hike timing).
AUSSIE BONDS: 3yr Yield Near Cash Rate, +25bps Firmer This Week, RBA Next Tues
Aussie bond futures have traded a tight range so far today, the 3yr (YM) at 96.37 currently and 10yr (XM) 95.675. These levels are largely holding losses seen this week, as the Q3 CPI beat saw easing risks for this year significantly curtailed. The 3yr ACGB yield is up close to 25bps so far this week, the biggest weekly rise since 2024. We were last near 3.61% so around the RBA cash rate, while the 10yr is a little higher above 4.30%.
- Focus going forward will be around easing risks into 2026. Our policy team interviewed a senior ex RBA Economist this week who stated: "Stronger-than-expected Q3 inflation data has almost eliminated any chance of further easing by the Reserve Bank of Australia this year and could even force rate hikes in H1 2026 if Q4 and Q1 CPI results come in hot, a former RBA senior economist told MNI."
- Market pricing for the Nov meeting is close to flat, while only 5bps of easing risk is priced for Dec. A full cut next year is priced by around the August meeting, although for May we have 23bps of easing priced in.
- The AU-US 10yr spread is around +21bps, little changed, but the moved higher has slowed since the hawkish Fed cut earlier this week.
- The AU 3/10s curve is slightly steeper at +70bps, but holding the bulk of this week's down move from +77bps.
- On the data front today we just had Q3 PPI, which rose to 3.5%y/y, from 3.4%, while the Sep credit figures were +0.6%m/m, in line with market forecasts.
- Next week, we have the RBA meeting outcome on Tuesday with no change expected, but focus will be on the updated forecast projections and how that shapes the outlook into 2026.
BONDS: NZGBS: A False Break Higher For Yields? Next Week Q3 Jobs Data
NZGB yields are finishing the weak on a softer note, down around 2-4bps across the curve, with the back end leading. The 2yr and the 10yr benchmarks are back under 20-day EMA resistance points, which were tested earlier this week. In yield terms, this is underperforming the US and Australian market trends. The NZ-US spread is back close to -4bps, near recent lows. Obviously catalysts today haven't that apparent for the yield losses seen. Still, we did have a softer ANZ NZ consumer sentiment print earlier, while RBNZ Monetary Policy Committee (MPC) external member Prasanna Gai noted the negative demand impact of tariffs, which has offset some the easing the central bank has done.
- The 2yr swap rate is also drifting lower, last down close to 2bps and near 2.38% (which is also back under the 20-day EMA resistance area).
- The implication from this is potentially more work for the RBNZ to do (this is our bias, not Gai's). We already have close to 25bps priced for the Nov meeting. Terminal rate pricing is around 2.14/15% for mid 2026, little changed.
- The consumer sentiment reading suggested that the recovery backdrop still remains challenging.
- Note next week we get the Q3 jobs report on Wednesday.
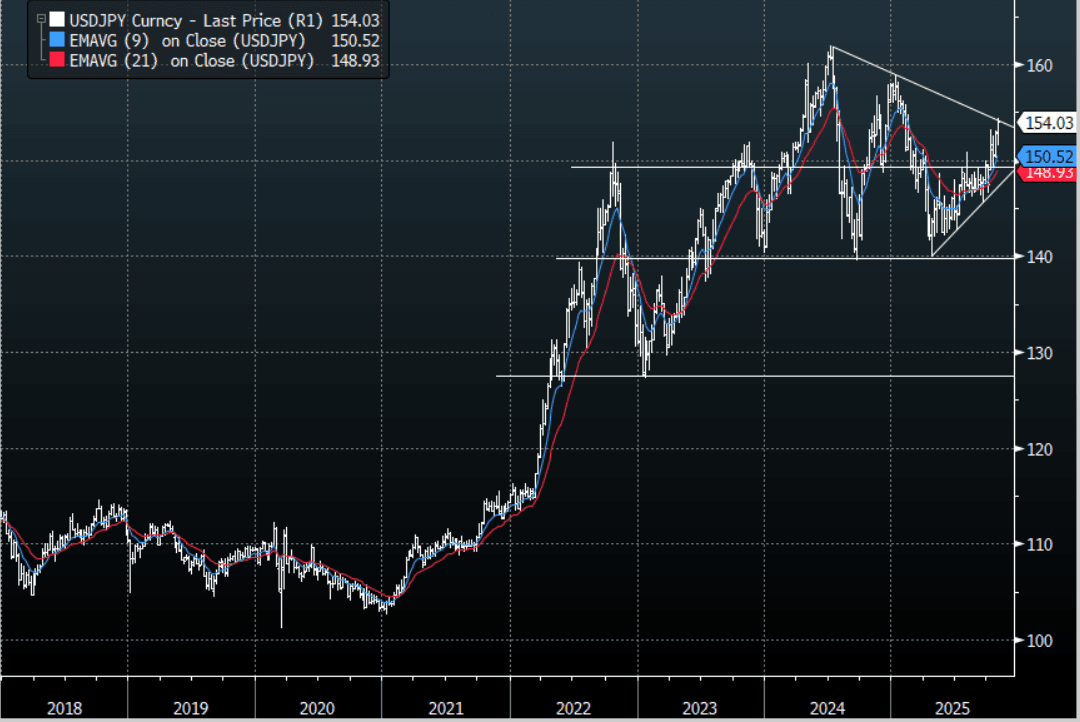
JPY: Asia-Pac: USD/JPY Tries Lower On CPI And MOF Jaw-Boning
The USD/JPY range has been 153.65 - 154.17 in the Asia-Pac session, it is currently trading around 154.00, -0.10%. The pair fell away thanks to a combination of a strong CPI print and some jaw-boning from the MOF. The pair remains a buy on dips though thanks to a combination of a hawkish FED and a BOJ that is still unsure about when it will raise rates. We are approaching some tough resistance back toward the 154/155 area and I would expect we might to do some work around here initially before moving higher. A break back above 155 could potentially see the move begin to accelerate and with that the potential for further intervention, though personally I think they will wait for levels closer to 160 to get involved.
- MNI BRIEF: Japan Oct Tokyo Core CPI Rises 2.8% Vs. Sept 2.5%. The year-on-year rise in Tokyo’s core consumer price index accelerated to 2.8% in October from 2.5% in September. The BOJ expects underlying CPI inflation to remain subdued temporarily as economic momentum weakens, before moving toward the 2% target. Officials are watching closely whether food prices excluding fresh items (+6.7% vs +6.9%) continue to moderate as projected.
- "JAPAN FINMIN KATAYAMA: CLOSELY WATCHING FX MOVES WITH A HIGH SENSE OF URGENCY RECENTLY SEEING ONE-SIDED, RAPID MOVES, IMPORTANT FOR CURRENCIES TO MOVE IN STABLE MANNER REFLECTING FUNDAMENTALS" RTRS"
- “KATAYAMA: CURRENCY MOVED PARTLY DUE TO MARKET VIEW ON BOJ, FED. BOJ'S DECISION WAS VERY REASONABLE" - BBG
- Bloomberg is reporting that Hedge funds are betting the yen will weaken to as low as 160 per dollar by the end of the year.
- Options : Close significant option expiries for NY cut, based on DTCC data: 152.50($1.42b). Upcoming Close Strikes : 150.00($1.13b Nov 3) - BBG.
Fig 1 : USD/JPY Spot Weekly Chart
Source: MNI - Market News/Bloomberg Finance L.P
FOREX: Asia-Pac FX: The USD Consolidates Overnight Gains, BBDXY Eyes 1220-1230
The BBDXY has had a range of 1217.20 - 1218.39 in the Asia-Pac session; it is currently trading around 1218, -0.05%. The USD accelerated higher overnight helped by the move in US yields which had a significant bounce. The 1220-30 area remains tough resistance, only a sustained close back above 1230 would start to challenge the conviction of the USD shorts. The price action though is starting to look more constructive as higher lows are being made on the Daily chart through October. A move back above 1230 would potentially signal a medium term low is in place and deeper pullback is on the cards. We do have month-end tonight so there could be some further portfolio adjustments to get through.
- EUR/USD - Asian range 1.1565 - 1.1577, Asia is currently trading 1.1570. The pair has moved back toward its support just above 1.1500. A break under this support could signal a deeper correction.
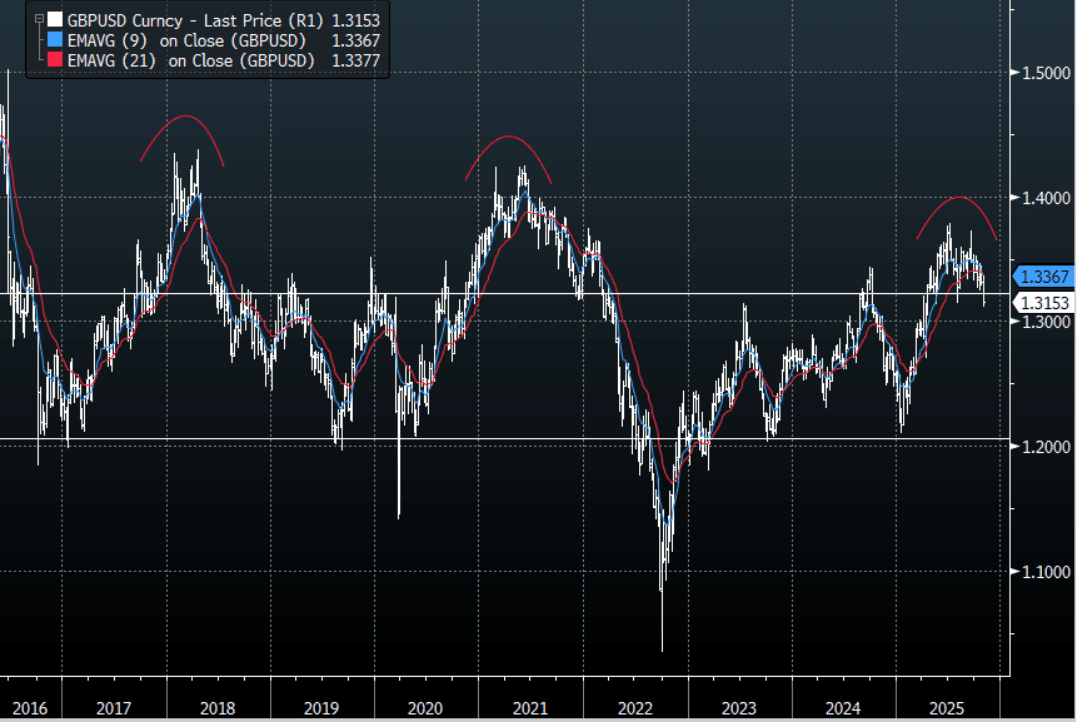
- GBP/USD - Asian range 1.3150 - 1.3165, Asia is currently dealing around 1.3155. The pair looks to be building some downward momentum. This 1.3150 area has proved to be supportive on more than 1 occasion this year so some work around this level could be expected. I continue to favor fading rallies though as GBP attempts to put in a medium term top.
- USD/CNH - Asian range 7.1082 - 7.1130, the USD/CNY fix printed at 7.0880, Asia is currently dealing around 7.1100. The support below 7.1000 looks to be pretty solid for now as USD/Asia moves in sympathy with a higher USD/JPY. The range of 7.08-7.16 looks set to continue for now.
- Cross asset : SPX +0.65%, Gold $3990, US 10-Year 4.0970%, BBDXY 1218, Crude Oil $60.14
- Data/Events : Italy CPI, Germany Retail Sales, EZ ECB Survey of Professional Forecasters/CPI, France Bloomberg Oct. France CPI, Spain Bloomberg Oct. Spain Current Account Balance
Fig 1: GBP/USD Spot Weekly Chart
Source: MNI - Market News/Bloomberg Finance L.P
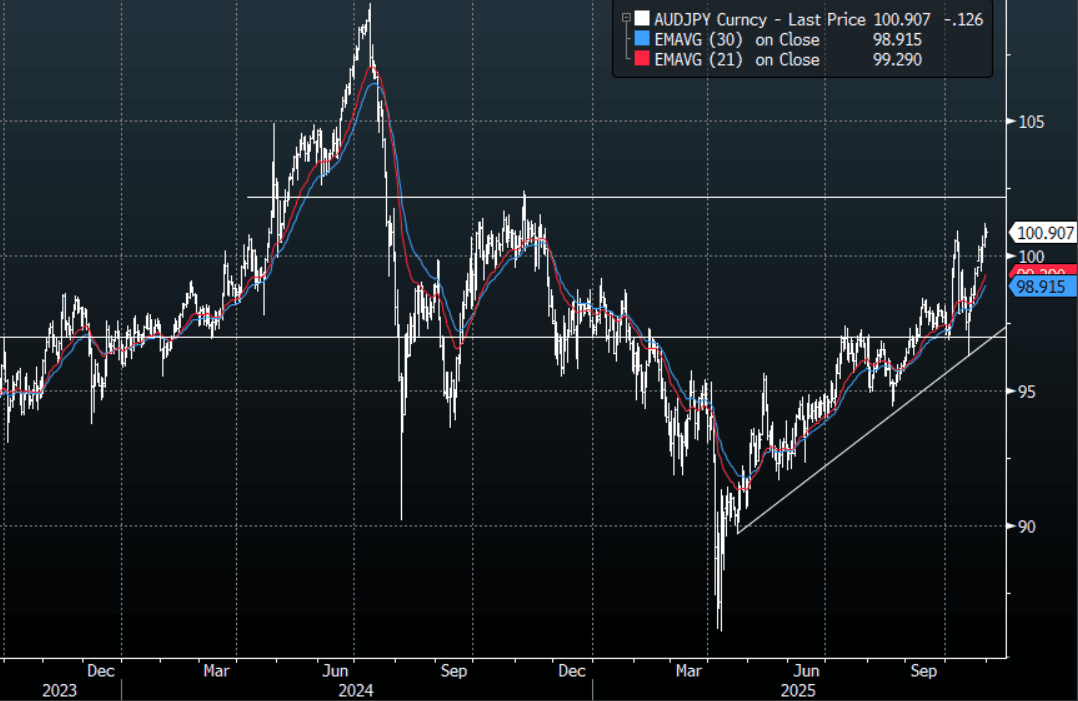
AUD: Asia-Pac: AUD/USD Quiet Session, Ignores Bounce In US Stocks
The AUD/USD has had a range of 0.6547 - 0.6560 in the Asia- Pac session, it is currently trading around 0.6550, -0.10%. The AUD is consolidating around 0.6550, having shrugged off the bounce in US stocks. The AUD failed to extend above the 0.6600 area and has slipped lower as the USD continues its attempt to build a base from which to move higher. The AUD/USD is back within its recent 0.6400-0.6600 range with the pivot being around its current level around 0.6550.
- "AUSTRALIA 3Q PRODUCER PRICES RISE 1.0% Q/Q, AUSTRALIA 3Q PRODUCER PRICES RISE 3.5% Y/Y” - BBG (note there is no forecast for PPI, the Q2 rise was 0.7%q/q)
- “AUSTRALIA SEPT. PRIVATE CREDIT RISES 0.6% M/M; EST. +0.6%, AUSTRALIA SEPT. PRIVATE CREDIT RISES 7.3% Y/Y" - BBG
- Options : Closest significant option expiries for NY cut, based on DTCC data: 0.6600(AUD 888m). Upcoming Close Strikes : 0.6625(AUD944m Nov 4), 0.6300(AUD600m Nov 4) - BBG
- AUD/JPY - Asia-Pac range 100.67 - 101.03, Asia is trading around 100.80. The pair is consolidating around 101.00 at the moment as it looks to build on its recent move back above 100.00. Suspect dips will continue to be supported for now with the first target 102.50 and then beyond.
Fig 1: AUD/JPY spot Daily Chart
Source: MNI - Market News/Bloomberg Finance L.P
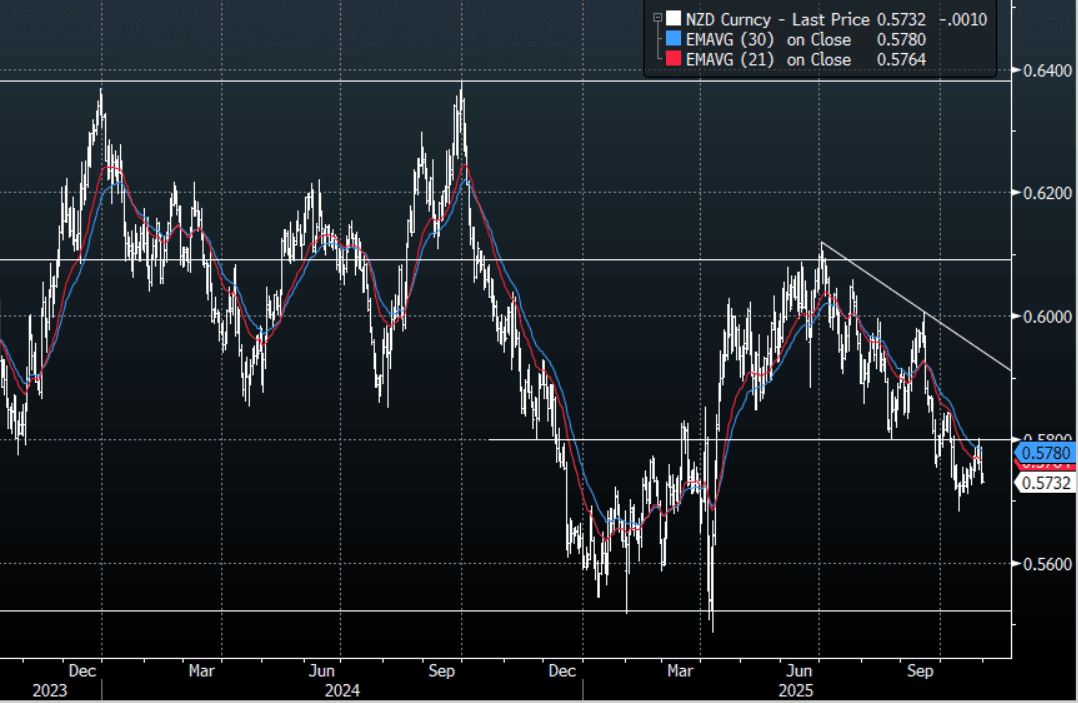
NZD: Asia-Pac: NZD/USD Moves Back To Overnight Lows On Gai Comments
The NZD/USD had a range of 0.5728 - 0.5745 in the Asia-Pac session, going into the London open trading around 0.5730, -0.20%. RBNZ committee member Prassanna Gai made some comments that saw the NZD move back to its overnight lows in our session. The NZD has run into solid resistance towards the 0.5800 area, this is the kind of price action the shorts would appreciate. While price remains below the 0.5800/50 area I suspect rallies will continue to be faded looking for a potential move back towards the 0.5500/0.5600 area. NZD continues to stand out as a short against a resurgent USD but it is worth noting that because of the size of the market traders can very quickly become all positioned the same way, so I think the USD will need to build on its challenge higher for the NZD to test those lows.
- Bloomberg reported on the comments made by Prassana Gai in her speech today: RBNZ’s Gai Says Global Shocks Have Offset Some Policy Easing. “For a small open economy like New Zealand, the US tariffs have acted as a negative demand shock. Compounding this has been a much broader uncertainty shock as the weaponization of trade and finance have profoundly changed widely accepted norms and international rules of the game. Together, these shocks appear to have offset some of the monetary easing that has taken place since August 2024.”
- "New Zealand Job Ads See First Annual Gain in 3 Years: Ministry, Job ads index rises 3.5% y/y" - BBG
- Options : Closest significant option expiries for NY cut, based on DTCC data: none. Upcoming Close Strikes : 0.5650(NZD1.05b Nov 4), 0.5675(NZD1b Nov 5), 0.5750(NZD604m Nov 5) - BBG
- AUD/NZD range for the session has been 1.1409 - 1.1434, currently trading around 1.1430. The Cross has bounced hard after finding solid demand back toward 1.1300. This 1.1400/1.1500 remains tough resistance but the price action suggests it might be tested. Above 1.15/16 and the markets focus will start to turn toward 1.2000 and beyond.
Fig 1: NZD/USD Spot Daily Chart
Source: MNI - Market News/Bloomberg Finance L.P
ASIA STOCKS: KOSPI + NIKKEI Lead Whilst China's Bourses Stumble into Month End
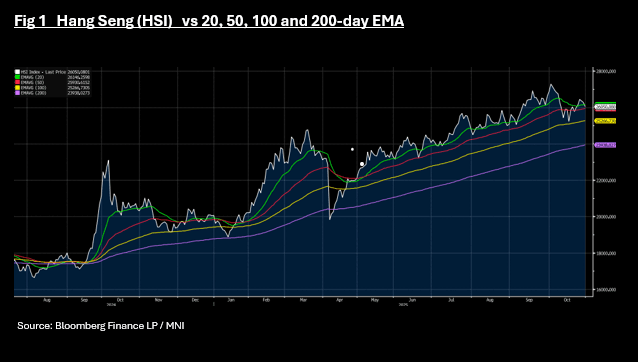
Weaker than expected Official PMIs may have been the catalyst for significant falls in the HSI today, dragging China's major bourses with it. Opening the trading day with modest gains, the falls in Hong Kong began just after the release that showed that state owned enterprises remain in contraction. Elsewhere the post Trump / XI meeting response continues to be broadly positive with the NIKKEI and the KOSPI continuing to lead the gainers in the region. Despite solid Apple Inc results at the start of the Asia trading day, tech stocks weren't the key driver for China, whilst in Korea and Taiwan, Samsung and TSMC reached yet new highs.
- The NIIKKEI's good run continued today with gains of +1.6% and weekly gains of +5.8%. The NIKKEI is at new highs of 52,206, up over 66% from the 2025 lows in April.
- The KOSPI is up +0.52% today and +4.2% for the week. Since the depths of trade war worries in April, the KOSPI has now risen over 78% year to date.
- The HSI in Hong Kong fell by -0.88% today and is barely holding on to a weekly gain. The CSI 300 is down by over 1% and back to flat on the week whilst the Shanghai and Shenzhen bourses are down, whilst retaining their slightly positive gains for the week. For the month of October, the divergence in onshore offshore is evident with the Hang Seng down -3.00% whilst the CSI 300 is up +0.45% and Shanghai +2%. The HSI has broken below the 20-day EMA again and is at 26,050 with the 50-day EMA below at 25,930.
- In Malaysia, the market awaits the decision from the Central Bank next week and continued it's lackluster period remaining where it started the week.
- In Jakarta, volatility returned after a period of strength and with further falls again the JCI is on track for a weekly loss of over 1%.
- The FTSE Straits Times in Singapore is flat on the week, whilst the PSEi in the Philippines is down over 2%, despite much stronger than expected export numbers for September being released.
India's NIFTY 50 hit new highs Wednesday of 26,053 but fell yesterday into the close on profit taking. Opening up +0.20% Friday sees week to date gains of 0.50%
ASIA STOCKS: Indian Flows Recovering, Modest Outflows For SK & Taiwan Past Week
The past week has seen offshore India inflows firm, whilst we have seen modest outflows from South Korea and Taiwan, despite mostly positive local stock sentiment.
- For India, this has largely reflected an over $1bn inflow day on Tuesday. Local equities remain elevated, albeit struggling for fresh upside, with the NIFTY near 26000, with moves above this level unable to be sustained so far in Oct. Markets are likely waiting on fresh news around US-India trade talks. YTD outflows have been curbed back to -$15bn, so any fresh positive news could drive a further recovery.
- For South Korea, the Kospi remains well supported on dips, last just above 4100. There may be some concern given the pace of the run higher, but Thursday results for Apple and Amazon in the US should keep broader tech equity sentiment supported. For Taiwan it is a similar backdrop.
- In South East Asia, Indonesian inflow momentum remains reasonable, with the JCI supported sub 8000. Outflow trends have been evident elsewhere though.
Table 1: Asian Markets Net Equity Flows
| Yesterday | Past 5 Trading Days | 2025 To Date | |
| South Korea (USDmn) | 47 | -213 | 2341 |
| Taiwan (USDmn) | 75 | -244 | 5633 |
| India (USDmn)* | -88 | 1024 | -15056 |
| Indonesia (USDmn) | 47 | 335 | -2593 |
| Thailand (USDmn) | 15 | -70 | -3000 |
| Malaysia (USDmn) | -15 | -138 | -4179 |
| Philippines (USDmn) | -6 | -38 | -752 |
| Total (USDmn) | 74 | 656 | -17606 |
| * Data Up To Oct 29 |
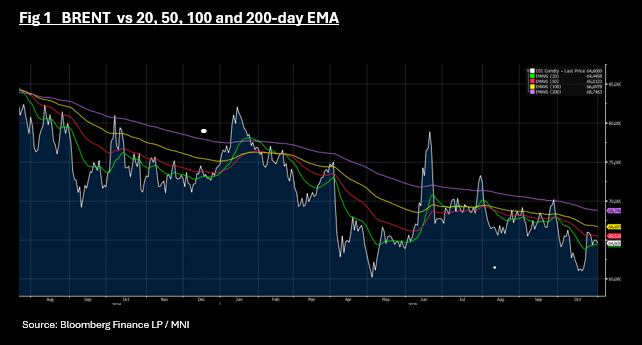
Oil in Weekly Decline as Brent Challenges Key Technical
- If current trends remain, oil will register it's fourth week in October of declines, locking in over -2% this week.
- WTI has weakened further Friday paring back the modest gains of Wednesday and Thursday, to be down -0.70% in the Asia trading day.
- Mid week gains had pushed WTI above the 20-day EMA of US$60.36 bbl, which it has given back today as it falls back to US$60.14.
- Brent is lower by -0.62% today at US$64.60 bbl, and down just over 2% for the week. Brent has fallen back near to the 20-day EMA of $64.44 and further falls tonight could see it consolidate below with near term lows of US$61.10 below.
- With no new news on further Russian sanctions or discussions with India on their Russian purchases although earlier in the week India Oil Corp stated clearly of their intent to stop buying oil under the sanctions. Other refiners have followed suit pausing all purchases.
- Similarly the mid week change in tact from the FED weighed heavy on oil just as the International Energy Agency has warned that the surplus in 2026 will be a record, though Saudi Aramco has struck a more positive tone. Oversupply in 2026 is a "highly credible scenario," Shell Plc CEO Wael Sawan said in an earnings call Thursday. (per BBG)
- The CEO of Europe's largest refiner TotalEnergies said overnight that " am more bullish than what we wrote a few days ago because I begin to realize that these sanctions will have a real impact in this market and that markets are underestimate what that mean."
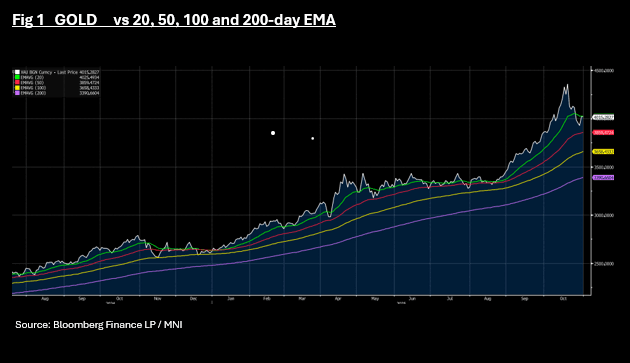
Gold Fails to Break 20-day EMA, Moves Lower
- After four days of strong losses, gold rebounded overnight to finish higher in the US trading session by +2.40%. Starting the Asia trading day near to the 20-day EMA of US$4,025.33, gold opened strongly from $4,024. However it was unable to break above the 20-day EMA, giving back early gains to lower at $4,014.78.
- For the week, gold remains lower by -2.3%, with successive weeks of losses to finish October.
- Overnight a report from the World Gold Council showed that Central Bank buying continues to underpin gold's rally with the July to September period seeing 220 tons of gold purchased by them, an increase of 28%.
- In China commercial bank's have been forced to raise their minimum purchase amount of gold from CNY900 to CNY1,100 as accumulation plans by investors are up 20% according to Ping An (source BBG).
- Moves in gold in the coming weeks will be watched eagerly, assuming trade tensions ease. Investors will watch closely to assess whether the more than 50% rise in gold was due to the 'safe haven bid' or the material change in markets, driven by Central Bank investment behaviour.
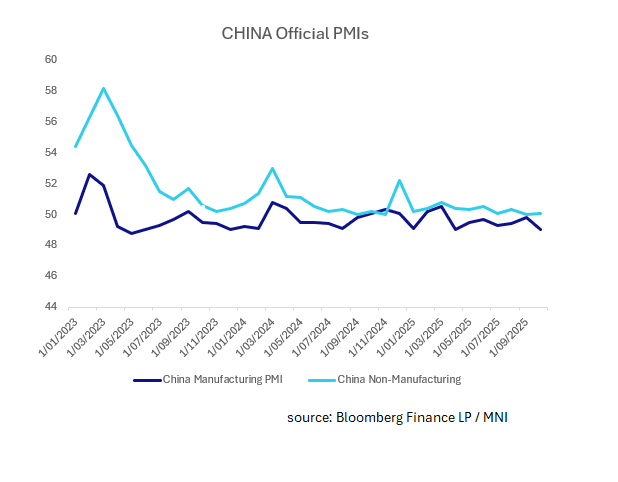
CHINA: Official PMIs Continue to Lag Non-SOE's PMIs
- Official Mfg PMIs slipped further into contraction in October, with the gap widening to non-SOE PMIs (via RatingDog services).
- Official PMI manufacturing slipped to +49 from +49.8, below expectations of +49.6 and the worst result since April.
- Official PMI non-manufacturing was marginally up at +50.1 from +50.0 prior.
- The decline in PMI manufacturing for SOEs is the worst this decade as trade tensions with the US have been escalating, prior to yesterday's meeting between Trump and Xi.
- Key points for the Manufacturing PMIs was a decline in output, new orders and employment whilst for non-Manufacturing the key was a modest rise in input prices
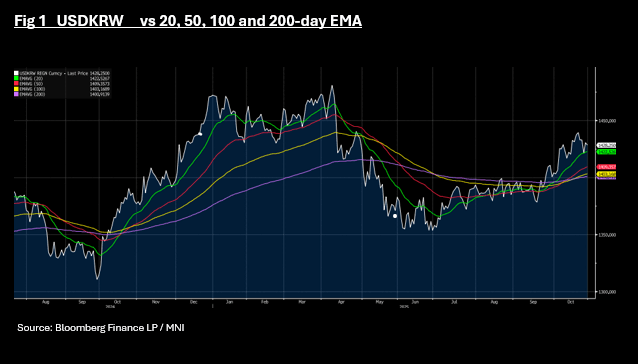
KRW: USDKRW Set For Best Week Since June on Trade Optimism
- If the uncertainty around a trade deal with the US was most obvious anywhere in Korea, it has been the Won. This week's announcement that the outstanding matters had been agreed between Korea and the US and the trade deal finalized, sees the Won having it's best week since June.
- Whilst the gains are only 0.75%, it is an important step in the stabilization of the currency, so battered by the uncertainty.
- USDKRW had sold off late into the close yesterday, finishing weaker by +0.65% only to rally -0.15% in morning trade.
- Strong gains Wednesday saw the Won bounce off the 20-day EMA of 1,422.54 before retreating. It has failed to hold below the 20-day EMA for more than a month.
- The KOSPI is continuing its rally, with gains of 0.70% today whilst bonds are tracking US yields higher from 5-Yr maturities out.
- Looking ahead over the weekend will see the release of October trade data before PMIs and CPI next week. With the strength of industrial production released this morning, observers will be looking for further signs of strength in data as potentially extending a BOK hold.
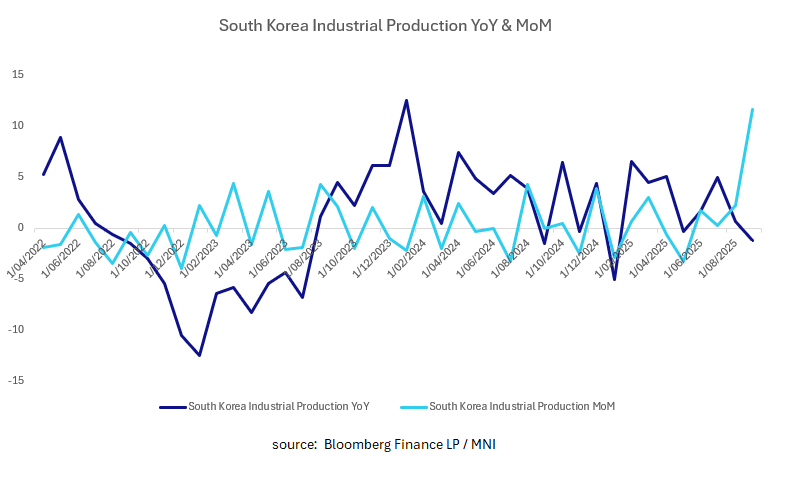
SOUTH KOREA: Industrial Production Surges in September
- September's industrial production surged higher, continuing the trend of better than expected data.
- Following last week's better than expected 3Q GDP result, the improvement in industrial production will be a welcome sign for the BOK, on hold due to the surging house prices in Seoul.
- Industrial production beat already strong expectations. At +11.6%, it was a material beat on forecasts of 5.9% and the strongest result since June 2024.
- However Industrial output fell -1.2% MoM (estimate +0.1%) versus revised +2.2% in August.
- The industrial production data re-enforces the picture of growing resilience in Korea, this comes after the PMI Manufacturing rose to +50.7 from 48.3 in August.
- Semi conductors are a key factor with chip exports up over 20% in September, no doubt contributing heavily to the I/P beat.
- Should the data continue to improve in line with the recent trend, the BOK could be hold for some time. The bond market and and swaps market thinks so with cuts that were priced in earlier in the year, now priced out.
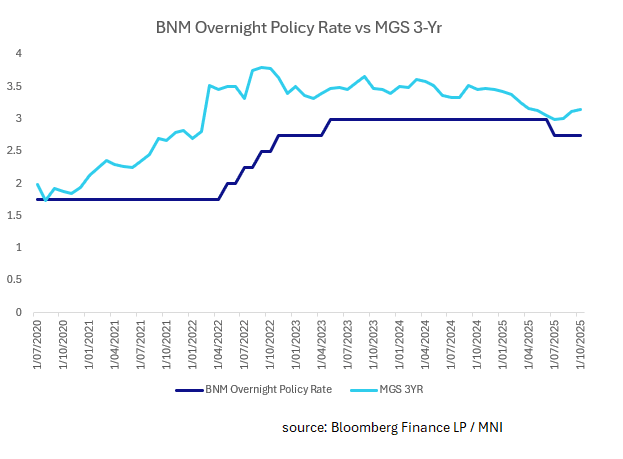
MALAYSIA: BNM Preview November 06
- Next week on the 6th of November, the Bank Negara Malaysia holds its monetary policy committee meeting to decide on interest rates, with little expectation of a cut from markets.
- Advanced third quarter GPD estimates topped expectations and beating 2Q at 5.2% as the South East Asian nation's economy continues to power ahead.
- CPI remains at the bottom end of the BNM target range yet the September result inched up moderately, thereby reducing the deflationary concerns of some.
- Industrial production jumped in August and the September exports was one of the strongest results this year, rising +12.2%
- In the mid part of the year, the 3-Yr government bond yield had converged on the BNM policy rate, but since the cut in July, has moved in opposite directions. In recent weeks, the 3-Yr MGS has edged higher in yields, widening the gap to the base rate, suggesting that bond markets have little expectations for rate cuts.
- We see the BNM on hold next week, with a neutral forward looking stance suggesting that rates could be on hold for some time.
UP TODAY (TIMES GMT/LOCAL)
| Date | GMT/Local | Impact | Country | Event |
| 31/10/2025 | 0700/0800 | ** | Import/Export Prices | |
| 31/10/2025 | 0700/0800 | ** | Retail Sales | |
| 31/10/2025 | 0730/0830 | ** | Retail Sales | |
| 31/10/2025 | 0745/0845 | *** | HICP (p) | |
| 31/10/2025 | 0745/0845 | ** | PPI | |
| 31/10/2025 | 0930/0930 | Blue Book / Pink Book | ||
| 31/10/2025 | 1000/1100 | *** | EZ HICP Flash | |
| 31/10/2025 | 1000/1100 | *** | EZ HICP Flash | |
| 31/10/2025 | 1000/1100 | *** | Italy Flash Inflation | |
| 31/10/2025 | 1000/1100 | *** | EZ HICP Flash | |
| 31/10/2025 | 1230/0830 | *** | Gross Domestic Product by Industry | |
| 31/10/2025 | 1230/0830 | *** | Personal Income and Consumption | |
| 31/10/2025 | 1230/0830 | *** | Employment Cost Index | |
| 31/10/2025 | 1230/0830 | *** | Gross Domestic Product by Industry | |
| 31/10/2025 | 1330/0930 | Dallas Fed's Lorie Logan | ||
| 31/10/2025 | 1342/0942 | *** | MNI Chicago PMI | |
| 31/10/2025 | 1500/1100 | Finance Dept monthly Fiscal Monitor (expected) | ||
| 31/10/2025 | 1600/1200 | Fed's Beth Hammack, Raphael Bostic | ||
| 31/10/2025 | 1700/1300 | ** | Baker Hughes Rig Count Overview - Weekly | |
| 31/10/2025 | 1700/1300 | ** | Baker Hughes Rig Count Overview - Weekly | |
| 31/10/2025 | 1700/1300 | ** | Baker Hughes Rig Count Overview - Weekly |