MNI EUROPEAN MARKETS ANALYSIS: AUD/NZD Uptrend At Risk
- The A$ is back under 0.6500 and RBA easing odds firmer post a stronger than expected rise in the Australian unemployment rate. The AUD/NZD cross is back under its 20 day EMA.
- JGB futures are weaker, -23 compared to settlement levels, and at session lows after today’s speech by BOJ Tamura. USD/JPY got close to 150.50, but has since rebounded.
- Asian equity sentiment has mostly been positive, aided by the tech sector. Gold made another fresh record high.
- Later the Fed’s Waller, Barr, Miran, Bowman and Kashkari appear. ECB President Lagarde participates in an IMF debate and Board members Lane, Machado and Donnery speak, and BoE’s Mann and Greene. Data continue to be delayed in the US but Philly Fed October business outlook, NY Fed October services and October NAHB housing are released. There are also UK August GDP, IP, services and trade and euro area August trade.
MARKETS
US TSYS: Yields Grind Lower, Watching 10-Yr for Potential Break Lower
TYZ5 is up at 113-12 in morning trade after US close of 113-07+ and opening at 113-10+. Volumes are moderate with some signs of a slight up tick in the afternoon session.
- The US 2-Yr yield has edged lower again at 3.493% as some traders suggest that a 50bps cut could be the risk at the next meeting.
- The 5-Yr is trying to rally with the yield -0.5bp lower at 3.61%
- The US 10-Yr had tried overnight to break the recent bottom of the range of 4.00% but bounced on that level back to 4.04%, before settling at 4.03% into the US close and is now lower again at 4.025%. The 4.00 -4.20% range remains in place for now and looking at data out tonight, it seems likely that the releases may not be enough of a catalyst to alter this range.
- The 30-Yr is marginally lower at 4.621%
- In the calendar tonight is Retail Sales, PPI, Initial Jobless Claims, Continuing Claims, the NY services business activity and the Philly Fed.
- The trend seems to be for a gradual grinding tighter in yield from here with data showing that via options linked to the Secured Overnight Financing Rate, traders are now wagering that a 50bps cut could be the outlier for the next Fed meeting. This would be against recent trends and represent a potential catalyst for yields to break current trends and potentially gap lower.
JAPAN DATA: Core Machine Orders Below Forecast, Hinting At Softer Capex Y/Y
Japan Aug core machine orders were below forecast and lost y/y momentum, implying some downside capex momentum risks (which has been a resilient source of Japan's GDP growth). We were -0.9%m/m versus +0.5% forecast, whole July fell 4.6%. This dragged the y/y outcome down to 1.6%, with the market consensus looking for an unchanged 4.9% outcome in Aug. The chart below plots core machine orders y/y versus Japan capex, ex software, also in y/y terms (this series is the orange line on the chart).
- Weakness was evident for both manufacturing (-2.4%m/m) and non-manufacturing segments (-17.5%).
- Capex has been a solid contributor to GDP growth in the past 3 quarters, up 0.6%q/q Q4, then 0.7% in Q1 and 0.6% in Q2 of this year. Some downside risks and/or loss of momentum in this space could be a headwind for GDP growth momentum. Note though the Tankan survey for Q3 (released at the start of this month) pointed to a healthy capex outlook (+12.5%y/y for the current FY).
- At the margin this data adds some caution around assessing current economic trends from a BoJ standpoint. The next meeting is at the end of the month.
Fig 1: Core Machine Orders (White Line) & Capex Y/Y
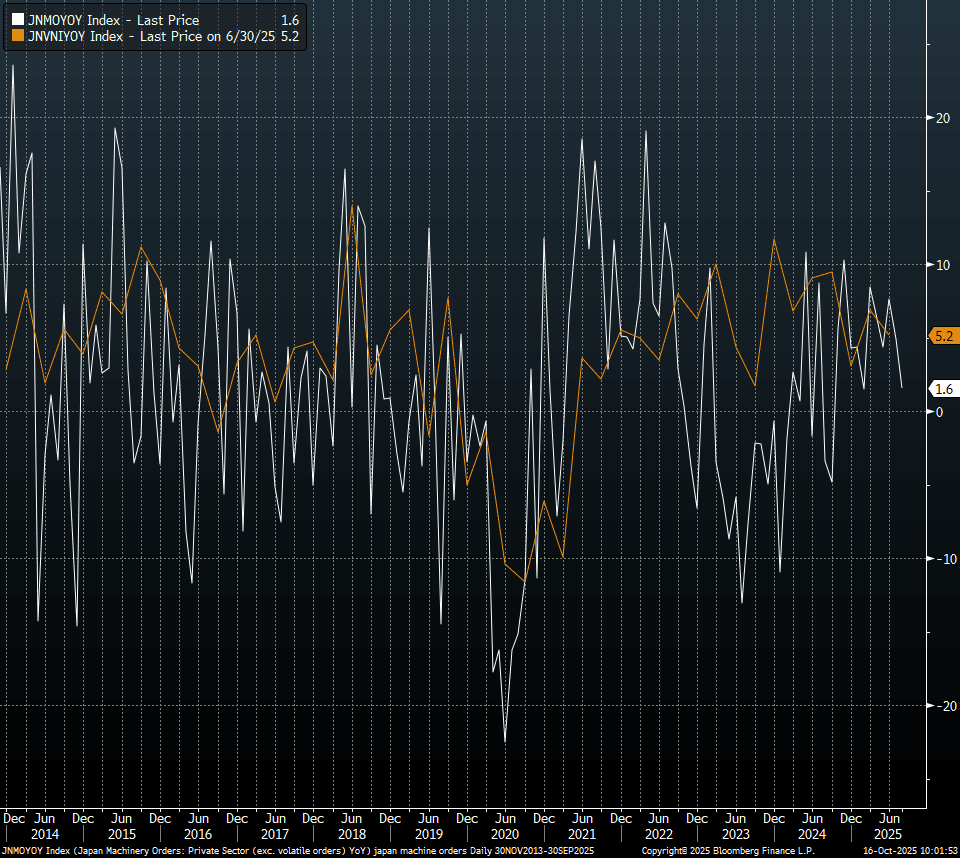
Source: Bloomberg Finance L.P./MNI
JGBS: Hawkish BOJ Tamura Fuels Twist-Flattener, BOJ Dep Gov Speech Tomorrow
JGB futures are weaker, -23 compared to settlement levels, and at session lows after today’s speech by BOJ Tamura.
- (MNI) Bank of Japan board member Naoki Tamura said Thursday that the central bank needs to raise its policy interest rate to around 1%, the lower end of what he sees as the neutral range, as the current 0.5% rate remains well below that level.
- Tamura, one of the board’s more hawkish members, argued that the impact of recent hikes on Japan’s economy has been “extremely limited” and that the only way to determine the true level of the neutral rate is to assess economic and price responses as rates rise.
- Cash US tsys are ~1bp richer in today's Asia-Pac session.
- Cash JGBs have twist-flattened across benchmarks, pivoting at the 20-year, with yields 2ps higher to 5bps lower.
- Today's move leaves the 2/30 yield curve at 222bps, within its recent trading range, but approaching the lower bound around 220bps.
- Swap rates are 3bp higher to 4bps lower.
- Tomorrow, the local calendar will see Weekly International Investment Flow data alongside a speech by BOJ Deputy Governor Uchida.
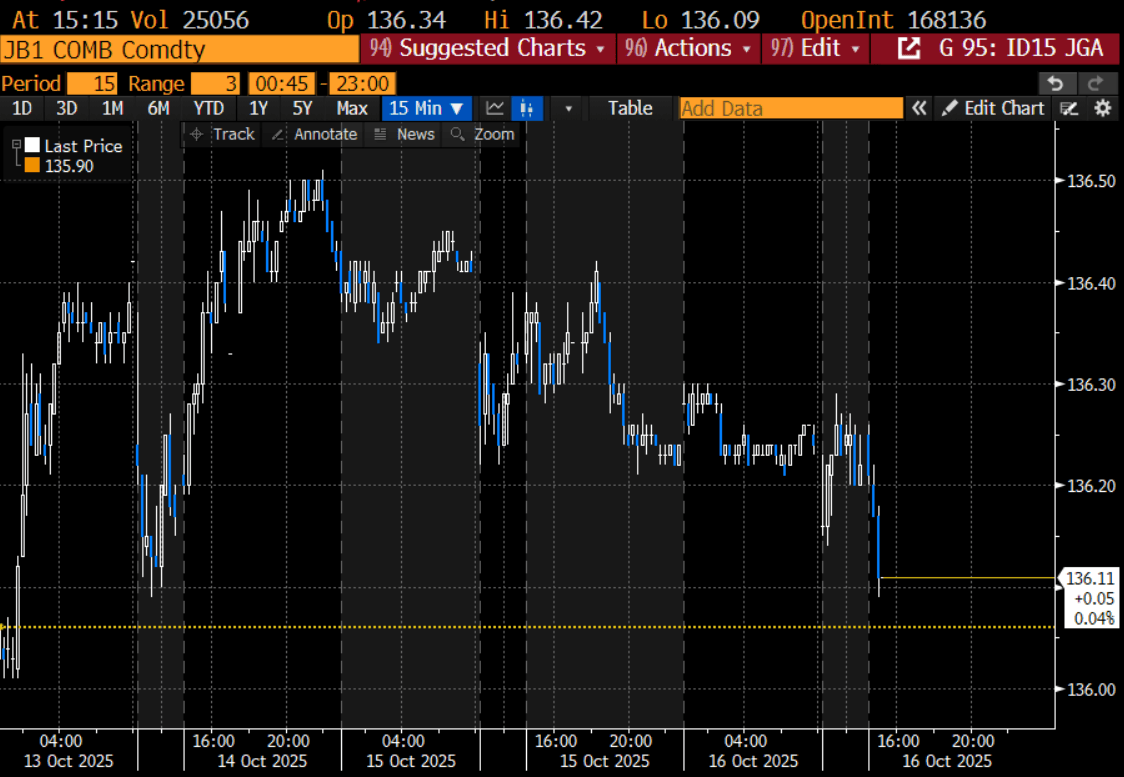
Bloomberg Finance LP
AUSTRALIA DATA: Easier Q3 Labour Market Increases Rate Cut Chance, Q3 CPI Key
Labour market conditions eased in September. The generally softer Q3 is likely to drive RBA revisions in the near-term but it may want to see further developments before changing its medium-term view. There are now signs that job growth can’t keep up with increases in the labour force resulting in higher unemployment and that any additional demand is being met by increasing hours. This makes a November rate cut more likely but given the RBA’s inflation concerns, Q3 CPI on 29 October remains the key input.
Australia employment vs labour force y/y%
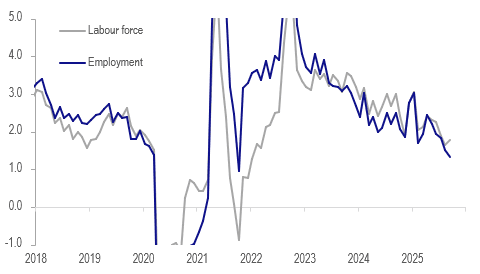
- The RBA forecast 1.6% y/y Q4 employment growth in August and September’s 14.9k increase resulted in it rising 1.3% y/y and Q3 1.5% y/y down from Q2’s 2.2%. The average Q3 monthly job gain was 12.3k down from 30.8k but above Q1’s 4.3k decline.
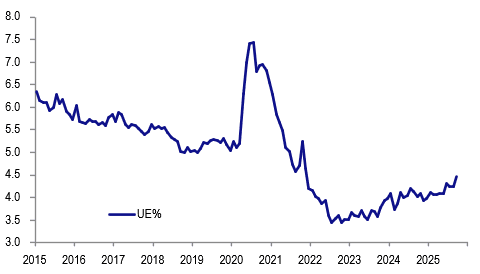
- The unemployment rate rose 0.2pp to 4.5% in September, highest in almost four years, with the participation rate +0.1pp to 67%. Through the volatility it has been rising 0.1pp/qtr through 2025 with Q3 at 4.3%, the RBA’s Q4 forecast. This could now be revised higher with the question being if it remains unchanged over 2026.
- The labour force rose 49k in September growing at 1.8% y/y up from 1.6% outpacing employment at 1.3% y/y down from 1.5% - the two are now diverging. Q3 labour force growth slowed to 1.8% y/y but exceeded employment’s 1.5% over the quarter.
- Both full-time (FT) and part-time (PT) employment grew in September. While FT hours were flat on the quarter, employment grew, whereas PT was the opposite. Total hours worked rose 0.5% m/m & 1.4% y/y in September but Q3 slowed to 1.5% y/y from 2.2% y/y.
- Underemployment was the main indicator that improved over Q3 declining 0.2pp to 5.8%.
Australia unemployment rate %
Source: MNI - Market News/ABS
AUSSIE BONDS: Weak Jobs Data Allows AU-US10Y To Move From Range's Upper Bound
ACGBs (YM +9.5 & XM +6.0) are sharply stronger, but well off session bests, after the release of today’s September labour force data.
- Labour market conditions eased in September. The generally softer Q3 is likely to drive RBA revisions in the near-term, but it may want to see further developments before changing its medium-term view. There are now signs that job growth can’t keep up with increases in the labour force, resulting in higher unemployment and that any additional demand is being met by increasing hours. This makes a November rate cut more likel,y but given the RBA’s inflation concerns, Q3 CPI on 29 October remains the key input.
- Cash US tsys are ~1bp richer in today's Asia-Pac session.
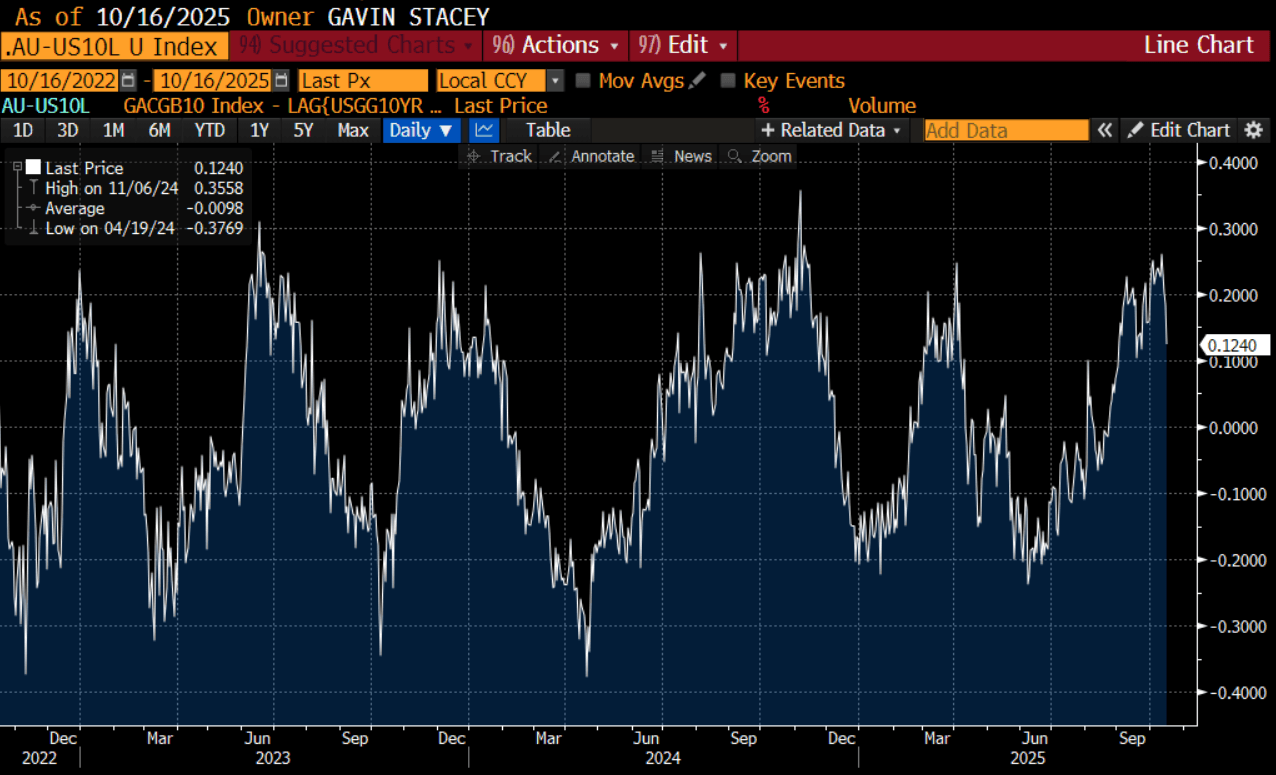
- Cash ACGBs are 6-9bps richer on the day with the AU-US 10-year yield differential at +14bps, the lowest since mid-September. (see chart)
- The bills strip has bull-steepened, with ricing +8 to +11bp.
- RBA-dated OIS pricing shunts 8-11bps softer across meetings versus pre-data levels. A 25bp rate cut in November is now given a 74% probability (38% pre-data), with a cumulative 24bps of easing (13bps pre-data) priced by year-end.
- Tomorrow, the local calendar will be empty apart from the AOFM's planned sale of A$800mn of the Dec-30 bond.
Bloomberg Finance LP
NEW ZEALAND: 3% Q3 CPI Unlikely To Derail Easing As Core To Remain In Band
Q3 CPI and the RBNZ’s sector factor model measure of core are released on Monday 20 October. The RBNZ has been expecting it to reach the top of its 1-3% band since its August forecast update and 3% seems to be where economists project it to print. Underlying CPIs are expected to remain within the top half of the band though. A 25bp rate cut is expected in November but if inflation prints materially below consensus then 50bp may be considered. The easing outlook may become clouded if inflation appears more persistent though.
- The Q3 CPI pickup from 2.7% in Q2 and away from the band mid-point is assumed to be temporary given significant excess capacity in the economy and the influence of administered and food prices on Q3. September food inflation turned down to 4.1% y/y from 5.0%.
- The RBNZ has said the focus is medium-term inflation, which it can influence and expects to moderate towards 2% in 2026. Chief Economist Conway said this month that inflation around 3% is “nerve-racking” though, suggesting the MPC won’t want Q3 to be materially above that point.
- The RBNZ forecast Q3 domestically-driven non-tradeables inflation to rise 1.0% q/q and 3.5% y/y down from Q2’s 3.7%. There is a risk it could be higher with ANZ and Westpac forecasting a 1.2% q/q rise and ASB 1.1%. Rental inflation though continues to trend lower with it averaging 2.1% y/y in Q3 down from Q2’s 2.8%.
- ANZ and Westpac expect Q3 tradeables CPI to rise 0.8% q/q in line with the RBNZ while ASB is higher at 0.9%. Either way annual growth is likely to continue rising after troughing at -1.6% y/y in Q3 2024 and increasing 1.2% y/y in Q2 2025.
BONDS: NZGBS: Bull-Flattener, Strong Demand At Auction, NZ-US 10Y Tighter
NZGBs closed showing a bull-flattener, with benchmark yields 1-4bps lower, despite mixed signals from today’s monthly price series.
- The series for September accounts for around 46% of the quarterly CPI (to be released on 20 October). There was an easing in food and rental inflation, but power price, petrol and air travel inflation picked up. Q3 average annual inflation saw upward pressure from food, electricity and accommodation, with petrol making less of a negative contribution. RBNZ’s Conway said that he’s nervous that inflation is around 3% but significant spare capacity should bring it towards 2%.
- The weekly auctions showed very strong demand metrics, with cover ranging from 4.02x (May-32) to 5.84x (May-54).
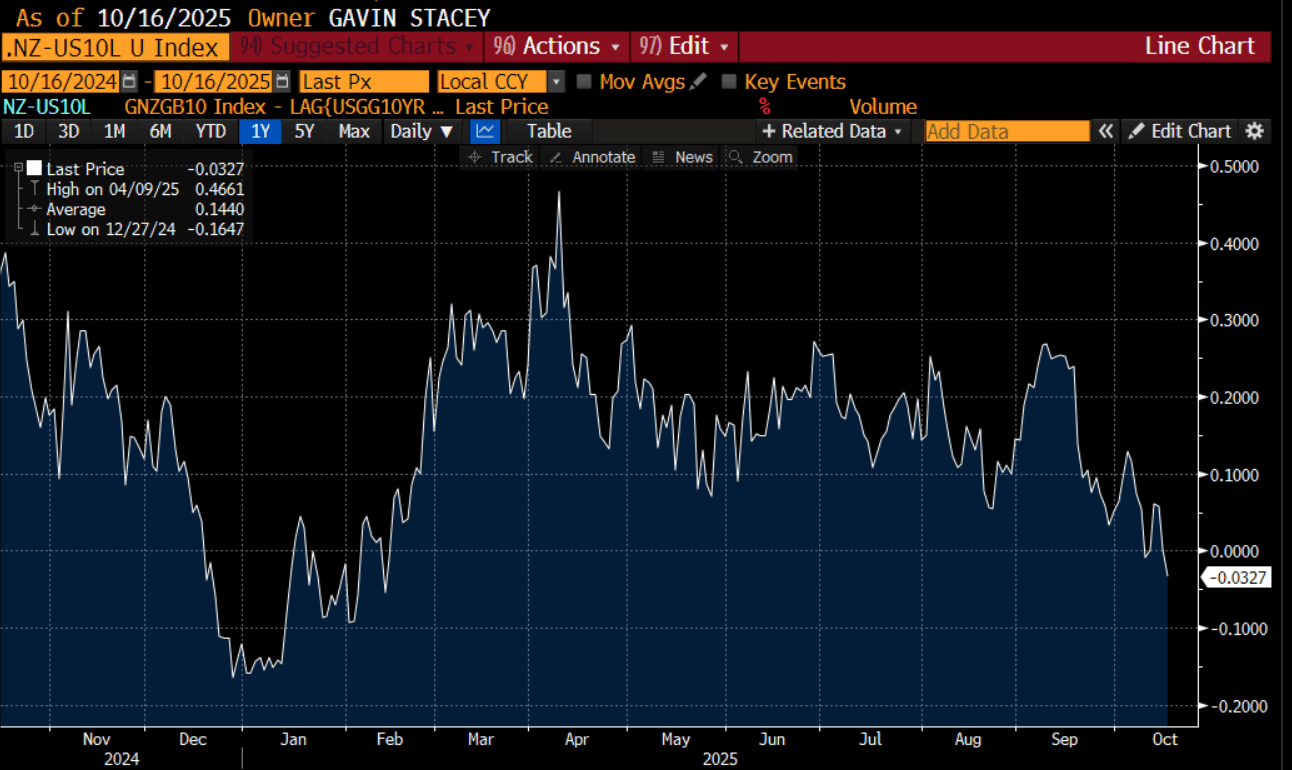
- NZGBs delivered a mixed performance versus the $-bloc. The NZ-US 10-year differential closed 3bps lower at -3bps, the lowest level since February (see chart). However, the NZ-AU differential closed 7bps higher after Australia’s September employment data showed a much larger than expected jump in the unemployment rate.
- RBNZ dated OIS pricing closed little changed across meetings. 26bps of easing is priced for November, with a cumulative 356bps by February 2026.
- Tomorrow, the local calendar will be empty, ahead of Q3 CPI on Monday.
Bloomberg Finance LP
FOREX: AUD/NZD Uptrend Stalls Post AU Jobs Data, Dollar Down But Up From Lows
The USD has stayed on the backfoot, albeit away from worst levels. The BBDXY is down a further 0.10% to 1209/10, fresh lows in around a week for the index. Carry over USD weakness following Powell rhetoric (labor market softening concerns) remains a theme, although the 4.00% level continues to hold for the US 10yr. The USD/CNY fix was also set lower again but USD/CNH has struggled to break lower. The AUD has been the exception to these broader softer USD trends, with a rise in the Sep unemployment rate (more than forecast) pushing us back under 0.6500 and underperforming on key crosses.
- AUD/USD got lows of 0.6480 (last near 0.6490), off 0.35%. Recent lows at 0.6440 remain intact for now. Labour market conditions eased in September. with the jobless rate now at 4.5%, fresh highs back to 2021. This makes a November rate cut more likely but given the RBA's inflation concerns, Q3 CPI on 29 October remains the key input.
- The AUD/NZD cross has tested back under 1.1300, fresh lows for Oct and sub 20-day EMA support. We get Q3 CPI for NZ next Monday. AU-NZ 2yr swap rates sit around 8bps off recent highs, last +97bps, which is not implying further sharp AUD/NZD downside.
- NZD/USD couldn't test above recent highs near 0.5760 (last 0.5740, still +0.30% higher).
- USD/JPY got to lows of 150.51, before support emerged. We were last 150.90/95 only down marginally versus end Wednesday levels. The following option expiries may be influencing spot: Y150.50($729mln), Y151.00($511mln).
- BoJ hawk Tamura reiterated his hawkish outlook, which may have benefited the yen at the margins. We do hear from the Deputy Governor tomorrow. US Tsy Bessent stated that USD/JPY will settle at the appropriate level if BoJ conducts the right policy (via BBG). FinMin Kato also noted they were seeing rapid FX moves in a weak yen direction, leaving intervention risks on the table.
- Japan core machine orders were weaker, implying some downside capex risks. It was also reported that Ishin leaders will make a decision on the coalition with the LDP. Takaichi PM odds sit near 92 per Polymarket.
Asia Stocks Buoyed by Tech Sector Ahead of TSMC Later
- The NIKKEI's gains of +0.75%, adds to yesterday's close +1.76% higher taking Japan's major bourse back towards the recent all time high of 45,580 a the tech sector was a key driver in the region today.
- The KOSPI is up at new highs today with positive tech sector results and the comments by Treasury Secretary Bessent that he is expecting an outcome of negotiations between Korea and the US in the coming days.
- The TAIEX in Taiwan is up 1.00% today ahead of TSMC's results due later. Wednesday saw strong regional gains for semi-conductor stocks after ASML reported better than expected orders, driving by soaring AI demand. This gave Nvidia and AMD a boost in the US and the tailwinds for Asia's sector today.
- China's major bourses were mixed as the Hang Seng's fall of -0.50% came as it was unable to hold above the 50-day EMA of 25,871. The falls in recent days took the HSI south of the 20-day and 50-day EMA. Below the 100-day EMA is at 25,096
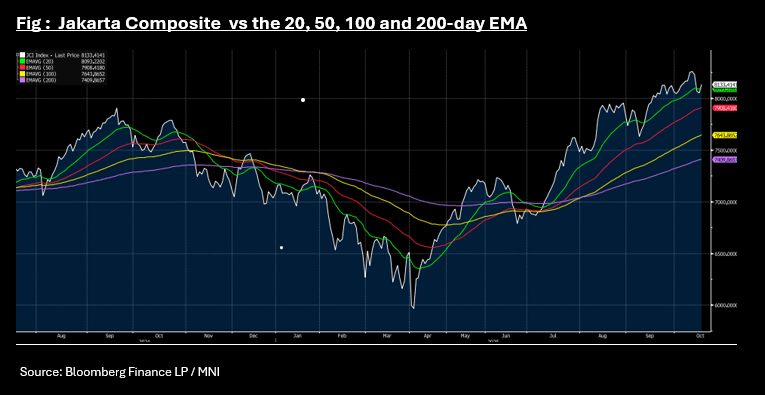
- The rally in Jakarta by the JCI sees the index back above the 20-day EMA of 8,092, which it had broken below briefly. After closing at a new all time high last Friday, the Jakarta Comp fell for three successive days as markets reacted to the US China threats.
OIL: Crude Higher, India Yet To Confirm End To Russian Oil Purchases
Oil prices are off their intraday highs but still up on the day supported by comments from US President Trump that India’s PM Modi assented to stop buying Russian oil, which would increase demand for non-Russian supplies, but it will take time for India to switch. It will remain to be seen if this can be achieved and India is yet to confirm. The US imposed a 25% punitive tariff on imports from India in August due to its Russian fuel consumption.
- China was the largest buyers of Russian crude in August, according to CREA, followed by India, Turkey and the EU. Trump has said he will now work to persuade China to stop its Russian oil purchases. The fuel is attractive as it trades at a discount following Russia’s invasion of Ukraine.
- WTI fell to $58.55/bbl before the report on the back of the excess supply outlook which was exacerbated by data showing a US crude stock build. It then rose to $59.01. It is currently 0.9% higher at $58.78. Brent reached a peak of $62.68 and is now up 0.8% to $62.40.
- Bloomberg reported a US crude inventory build of 7.4mn barrels last week, according to people familiar with the API data. Gasoline stocks rose 3.0mn while distillate fell 4.8mn. The official EIA figures are out today.
- Later the Fed’s Waller, Barr, Miran, Bowman and Kashkari appear. ECB President Lagarde participates in an IMF debate and Board members Lane, Machado and Donnery speak, and BoE’s Mann and Greene. Data continue to be delayed in the US but Philly Fed October business outlook, NY Fed October services and October NAHB housing are released. There are also UK August GDP, IP, services and trade and euro area August trade.
Gold Rallies Further On Fed Easing Prospects, Flashing Overbought
Gold continues to rally unhindered reaching another new high at $4242.12/oz and is up 0.6% to $4234.2 moving further into overbought territory and breaking above resistance at $4239.7 opening $4317.7. It has been supported by a number of factors including Fed Chair Powell’s comments this week regarding labour market concerns and associated rate cut expectations. The slightly lower US dollar (BBDXY -0.1%) and yields have been supportive.
- The USD OIS market has a full 25bp cut priced in for 29 October with around 22bp for 12 December. ANZ has lifted its gold forecast to $4600/oz by June 2026 with $4400 by end-2025 as it expects the Fed to cut four more times by March, according to Bloomberg.
- Gold prices continue to be driven by ongoing US-China trade risks, the continued US government shutdown and persistent uncertainty over Fed independence, while central bank buying should remain a medium-term support. ETF flows also continue.
- Silver reached a high of $53.278 today, short of Tuesday’s record $53.546. It is currently up 0.2% to $53.12. Very tight liquidity in London has been a driver of its 13.9% October rise. ANZ expects it to top out at $57.50 by mid-2026 (Bloomberg).
- Later the Fed’s Waller, Barr, Miran, Bowman and Kashkari appear. ECB President Lagarde participates in an IMF debate and Board members Lane, Machado and Donnery speak, and BoE’s Mann and Greene. Data continue to be delayed in the US but Philly Fed October business outlook, NY Fed October services and October NAHB housing are released. There are also UK August GDP, IP, services and trade and euro area August trade.
SOUTH KOREA: Mortgages Increase in September
- Given the government's focus on cooling the housing market, particularly in Seoul, today's release of the September Loans to households was worth considering to see if the focus on housing is having an effect.
- However with mortgage loans increasing 2.5t won MoM to KRW932.7 tn at end of September, markets may have to wait awhile longer before the impact shows up in the data.
- South Korea has announced further measures at cooling the sector including tighter loan limits specifically in Seoul, higher risk weights on banks' home loan portfolios and reducing loan to value ratios for purchases.
- "The recent instability in housing markets is spreading on global rate-cut expectations and persistent supply-demand imbalances that are driving concerns over excess capital inflows into real estate," said the Minister of Land, Infrastructure and Transport Kim Yun-duk said in a briefing Wednesday. “In response, we’re going to take preemptive measures to curb instability in the housing market early and to ensure that capital is directed toward more productive sectors of the economy,” he added. (as per BBG)
- Since October the Bank of Korea has cut rate four times but in April went on hold, following the release of the initial policy changes by the then new government. The BOK then cut rats in May and as next meeting approaches, markets remains uncertain with no rate cuts priced in over a one month time horizon and just -6bps over the next three months.
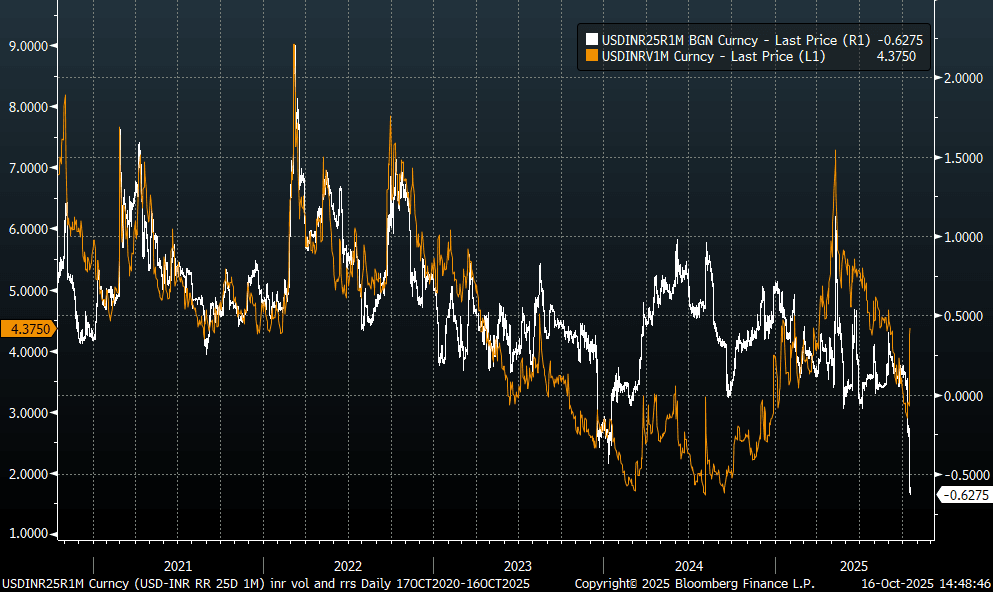
INR: USD/INR Holding Sub 50-day EMA, 1mth Risk Reversal Plunging
USD/INR is largely holding onto its opening losses, with a number of rupee positives in play, while risk reversals are sharply lower. We were last near 87.80/25, down around 0.3% versus end Wednesday levels (earlier lows were at 87.70). We are sub both the 20-day and 50-day (88.03) support points. We haven't been sub the 50 day since July of this year. Further south is the 100-day at 87.39 in terms of potential further downside targets. Recent record highs are around 88.80.
- A number of positives are in play for INR. Earlier remarks from US President Trump that India will stop Russian oil purchases is raising hopes of improved trade relations with the US.
- Indian equities are back close to mid Sep highs, while there is ample scope for further offshore investor inflows. YTD outflows are over $16.5bn.
- RBI intervention risks are also a headwind to USD/INR rebounding. Yesterday's sharp move lower may have caught the market off guard. Indeed, the USD/INR 1 mth risk reversal has plunged into negative territory, see the chart below (where it is overlaid against 1 month implied vol).
Fig 1: USD/INR 1month Risk Reversal Sharply Lower
Source: Bloomberg Finance L.P./MNI
UP TODAY (TIMES GMT/LOCAL)
| Date | GMT/Local | Impact | Country | Event |
| 16/10/2025 | 0600/0700 | *** | UK Monthly GDP | |
| 16/10/2025 | 0600/0700 | ** | Trade Balance | |
| 16/10/2025 | 0600/0700 | ** | Index of Services | |
| 16/10/2025 | 0600/0700 | ** | Index of Production | |
| 16/10/2025 | 0600/0700 | ** | Output in the Construction Industry | |
| 16/10/2025 | 0800/1000 | *** | HICP (f) | |
| 16/10/2025 | 0830/0930 | BOE Credit Conditions Survey | ||
| 16/10/2025 | 0900/1100 | * | Trade Balance | |
| 16/10/2025 | 0900/0500 | * | CREA Existing Home Sales | |
| 16/10/2025 | 0900/1100 | Foreign Trade | ||
| 16/10/2025 | 1200/0800 | Richmond Fed's Tom Barkin | ||
| 16/10/2025 | 1215/0815 | ** | CMHC Housing Starts | |
| 16/10/2025 | 1230/0830 | *** | Jobless Claims | |
| 16/10/2025 | 1230/0830 | *** | Retail Sales | |
| 16/10/2025 | 1230/0830 | *** | PPI | |
| 16/10/2025 | 1230/0830 | ** | Philadelphia Fed Manufacturing Index | |
| 16/10/2025 | 1230/0830 | *** | PPI | |
| 16/10/2025 | 1230/0830 | *** | Retail Sales | |
| 16/10/2025 | 1300/1400 | BOE Mann in Panel on MonPol and Trade Shocks | ||
| 16/10/2025 | 1300/0900 | Fed Governor Christopher Waller | ||
| 16/10/2025 | 1300/0900 | Fed Governor Michael Barr | ||
| 16/10/2025 | 1300/0900 | Fed Governor Stephen Miran | ||
| 16/10/2025 | 1400/1000 | * | Business Inventories | |
| 16/10/2025 | 1400/1000 | ** | NAHB Home Builder Index | |
| 16/10/2025 | 1400/1000 | * | Business Inventories | |
| 16/10/2025 | 1400/1000 | Fed Governor Michelle Bowman | ||
| 16/10/2025 | 1430/1030 | ** | Natural Gas Stocks | |
| 16/10/2025 | 1445/1545 | BOE Mann in MonPol Panel at IMF/World Bank Meetings | ||
| 16/10/2025 | 1530/1130 | * | US Bill 08 Week Treasury Auction Result | |
| 16/10/2025 | 1530/1130 | ** | US Bill 04 Week Treasury Auction Result | |
| 16/10/2025 | 1545/1745 | ECB Lane in Policy Panel at IIF Annual Meeting | ||
| 16/10/2025 | 1600/1200 | ** | DOE Weekly Crude Oil Stocks | |
| 16/10/2025 | 1600/1200 | ** | US DOE Petroleum Supply | |
| 16/10/2025 | 1600/1800 | ECB Lagarde in IMF Policy Debate | ||
| 16/10/2025 | 1645/1245 | Richmond Fed's Tom Barkin | ||
| 16/10/2025 | 1730/1330 | BOC Governor Macklem speaks at Peterson Institute event in Washington. | ||
| 16/10/2025 | 1830/1930 | BOE Greene in Panel on UK/EU Relations | ||
| 16/10/2025 | 2015/1615 | Fed Governor Stephen Miran | ||
| 16/10/2025 | 2030/1630 | Richmond Fed's Tom Barkin | ||
| 16/10/2025 | 2200/1800 | Minneapolis Fed's Neel Kashkari | ||
| 17/10/2025 | 0600/0800 | ** | Unemployment | |
| 17/10/2025 | 0900/1100 | *** | EZ HICP Final | |
| 17/10/2025 | 0935/1035 | BOE Pill Speech at Institute of Chartered Accountants Conference | ||
| 17/10/2025 | 1100/1200 | BOE Greene Roundtable at Atlantic Council | ||
| 17/10/2025 | 1230/0830 | * | International Canadian Transaction in Securities | |
| 17/10/2025 | 1230/0830 | ** | WASDE Weekly Import/Export | |
| 17/10/2025 | 1230/0830 | *** | Housing Starts | |
| 17/10/2025 | 1230/0830 | ** | Import/Export Price Index | |
| 17/10/2025 | 1230/0830 | *** | Housing Starts | |
| 17/10/2025 | 1315/0915 | *** | Industrial Production |