JAPAN DATA: Core Machine Orders Below Forecast, Hinting At Softer Capex Y/Y
Japan Aug core machine orders were below forecast and lost y/y momentum, implying some downside capex momentum risks (which has been a resilient source of Japan's GDP growth). We were -0.9%m/m versus +0.5% forecast, whole July fell 4.6%. This dragged the y/y outcome down to 1.6%, with the market consensus looking for an unchanged 4.9% outcome in Aug. The chart below plots core machine orders y/y versus Japan capex, ex software, also in y/y terms (this series is the orange line on the chart).
- Weakness was evident for both manufacturing (-2.4%m/m) and non-manufacturing segments (-17.5%).
- Capex has been a solid contributor to GDP growth in the past 3 quarters, up 0.6%q/q Q4, then 0.7% in Q1 and 0.6% in Q2 of this year. Some downside risks and/or loss of momentum in this space could be a headwind for GDP growth momentum. Note though the Tankan survey for Q3 (released at the start of this month) pointed to a healthy capex outlook (+12.5%y/y for the current FY).
- At the margin this data adds some caution around assessing current economic trends from a BoJ standpoint. The next meeting is at the end of the month.
Fig 1: Core Machine Orders (White Line) & Capex Y/Y
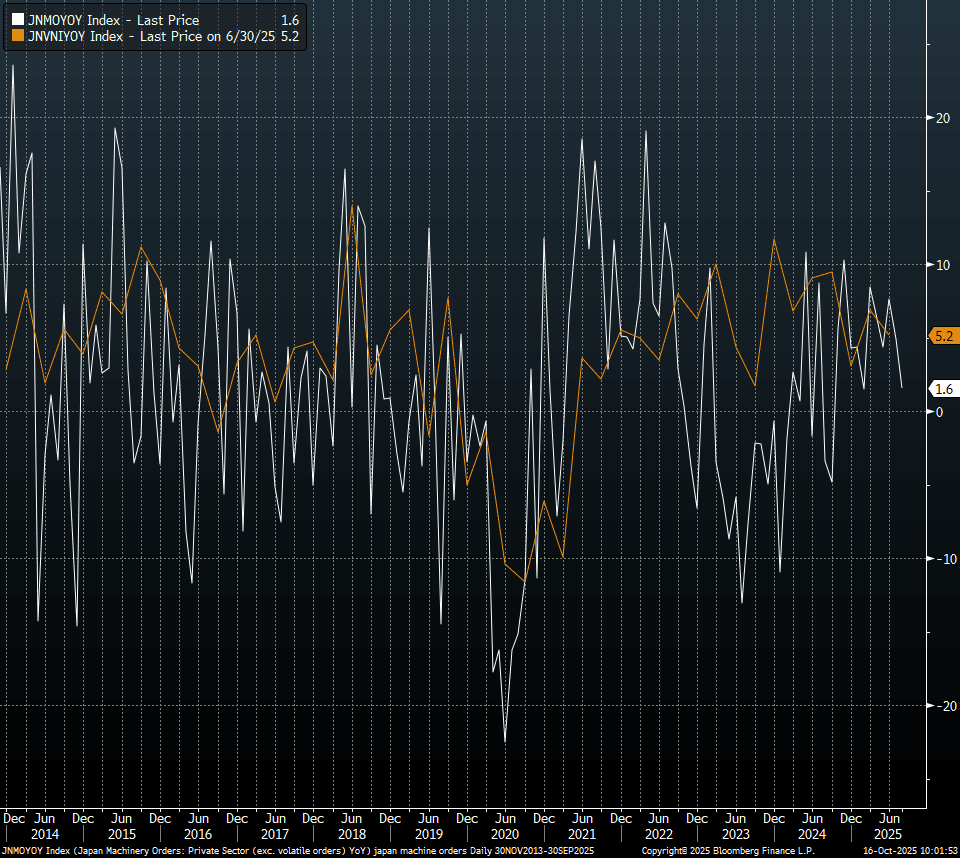
Source: Bloomberg Finance L.P./MNI
Want to read more?
Find more articles and bullets on these widgets:
Historical bullets
ASIA STOCKS: Inflows Mostly Positive, Some Slowing For South Korea & Taiwan
Most EM Asia markets saw positive inflows to start the week (although Malaysia remained closed, returning tomorrow). The pace of inflows was positive for both South Korea and Taiwan, albeit down from recent highs. The 5-day sums for both markets remains quite healthy and some slowdown in inflows is not that surprising given the recent surge into these markets from a flow standpoint. Taiwan for September to date has already seen +$7.45bn in net inflows, which is close to 2025 highs, and we only around halfway through the month.
- We also have key event risk this week in terms of the Fed decision. Declining US yields, amid rising Fed easing expectations, has no doubt been a factor in tech equity rally. Overnight the SOX index was up for the 8th straight session.
- Elsewhere, Indian inflows ended last week on a more positive, helping to drag the 5-day sum of net inflows into positive territory. Indian markets have recovered some ground since the start of the month but remain sub late Aug highs.
- Indonesian inflows were positive yesterday as sentiment continued to recover following the FinMin replacement.
Table 1: Asian Markets Net Equity Flows
| Yesterday | Past 5 Trading Days | 2025 To Date | |
| South Korea (USDmn) | 147 | 3040 | -2152 |
| Taiwan (USDmn) | 144 | 5059 | 7549 |
| India (USDmn)** | 116 | 304 | -15408 |
| Indonesia (USDmn) | 64 | -305 | -3664 |
| Thailand (USDmn) | 10 | -12 | -2543 |
| Malaysia (USDmn)* | 25 | -2 | -3808 |
| Philippines (USDmn) | -8 | -5 | -736 |
| Total (USDmn) | 497 | 8079 | -20762 |
| * Data Up To Sep 11 | |||
| * Data Up To Sep 12 |
Source: Bloomberg Finance L.P./MNI
US TSYS: Cash Open
TYZ5 is trading 113-13+=, down 0-02 from its close.
- The US 2-year yield opens around 3.537%.
- The US 10-year yield opens around 4.0375%.
- MNI INTERVIEW: Cook Could Face Long Odds Before Supreme Court. Federal Reserve Governor Lisa Cook is unlikely to win her case against President Donald Trump at the Supreme Court, whose 6-3 conservative majority has repeatedly sided with the president, George Washington University Law professor and administrative law expert Richard Pierce told MNI.
- MNI INTERVIEW: Fed Easing Constrained By High Inflation-Sahm. The Federal Reserve is limited in how much it can cut interest rates given a lack of progress in bringing inflation down, former central bank economist Claudia Sahm told MNI.
- 10-Year Yields continue to do work just above 4.00% as the market looks towards the FOMC this week. The first buy-zone is now back towards the 4.20% area where I suspect decent demand should return initially. A sustained break through 4.00% is needed for the focus to then turn towards the 3.80% area. The market does seem confident of a dovish outcome, the risk is Powell does not deliver.
- Data/Events: Retail Sales, New York Fed Services Business Activity, Industrial Production, NAHB Housing Market Index
JGBS: Trading To Resume After Long W/E
In post-Tokyo trade on Friday, JGB futures closed weaker, -2 compared to settlement levels.
- US tsys were in rally mode with weaker-than-expected Empire State PMI supporting easing bets. Yields closed -2 bps to -3 bps richer.
- MNI FED PREVIEW: A Reluctant Return to Easing. The Federal Reserve is set to resume its easing cycle at the September 16-17 meeting with a 25bp cut to the funds rate range to 4.00-4.25%. The decision to cut after a 5-meeting pause was well-telegraphed by Chair Powell, whose Jackson Hole speech described a "shifting balance of risks" toward a weaker labor market that "may warrant adjusting our policy stance". The updated quarterly projections aren't likely to bring many changes to the macroeconomic variables, but as usual the signal sent from the Fed rate "Dot Plot" will garner attention. A Committee split between expecting one or two further cuts this year is likely, keeping each of the remaining meetings of 2025 "live".
- MNI BOJ WATCH: Board To Hold, Focus On CPI, Trade. The Bank of Japan board is likely to keep its policy rate unchanged at 0.50% at the two-day meeting ending Friday as it assesses the impact of tariffs on the U.S. and Japanese economies.
- Today, the local calendar will see the Tertiary Industry Index.