MNI US MARKETS ANALYSIS - Payrolls in Focus in Tariff Month
Highlights:
- US seen adding 138k jobs over April, keeping U/E unchanged at 4.2%
- Risk sees some support as China seen 'evaluating' trade talks with the US
- AUD/USD consolidation phase extends, historically resolves with move lower
US TSYS: Retracement Of Prior Gains Consolidated Ahead Of Payrolls
- Treasuries have pulled back off overnight lows but still broadly consolidate yesterday’s post-ISM mfg retracement of the week’s prior gains, aided by some trade talk traction.
- Focus is firmly on today's nonfarm payrolls report for April (MNI Preview) plus no doubt further trade-related headlines ahead of the weekend.
- Cash yields are 0.5-1.5bp lower on the day.
- 10Y yields sit at 4.206% after failing to test 4.25% overnight with 4.2465%, although it was last above 4.25% only as recently as Apr 28.
- Curves are off yesterday’s steeps that included a particularly notable 100bp for 5s30s (currently at 91bp) that marked fresh highs since Oct 2021.
- TYM5 trades at 112-00 (+ 04+), close to narrow overnight ranges on modest cumulative volumes of 300k.
- It holds a sharp pullback from yesterday’s latest high of 112-20+, which pierced latest resistance at 112-18 (1.0% 10-dma envelope) after which lies 113-04 (76.4% retrace of Apr 7-11 bear leg).
- An overnight low of 111-23+ marginally extended yesterday’s reversal but hasn’t troubled support at 111-07+ (20-day EMA).
- Data: Nonfarm payrolls Apr (0830ET), Factory orders Mar (1000ET)
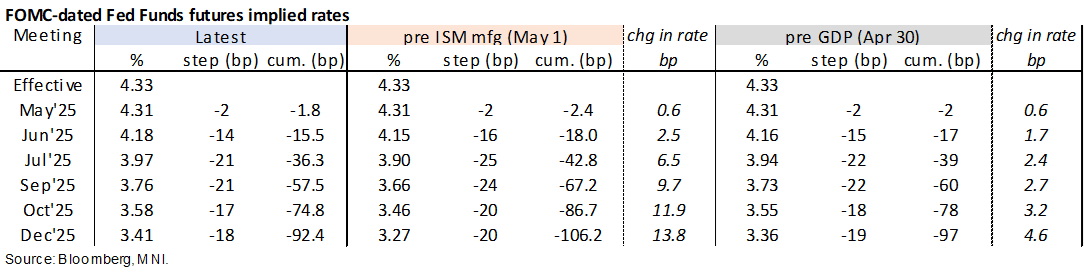
STIR: Holding Post-ISM Mfg Retracement Of Week’s Rally Ahead Of Payrolls
- Fed Funds implied rates broadly consolidate yesterday’s shunt higher. Trade talk traction helps hold the moves, primarily on China earlier today saying it’s assessing US trade talks, prompting risk on, plus Japan seeing US trade talks speeding up later this month with hopes for a June agreement.
- Cumulative cuts from 4.33% effective: 2bp on Wed, 15.5bp Jun, 36.5bp Jul, 57.5bp Sep and 92.5bp Dec.
- SOFR futures are near unchanged on the day, with an implied terminal yield at 3.04% (SFRU6) having been sub-2.9% prior to ISM mfg yesterday.
- SFRU6 trades at 96.96 after yesterday’s 97.125 had sparked a fresh high since Apr 7 (i.e. back to levels comfortably before the Apr 9 partial backtracking on tariffs).
- That ISM mfg report, which was stronger than expected but still included multiple contractionary signs, helped spark a sizeable sell-off in rates that was arguably boosted by a reversal of previous possible month-end buying on Wed.
- It suggests there could more sensitivity to a surprisingly strong payrolls print than we had first thought but we still see greater sensitivity in the event of a large downside surprise. As we write in the preview, a small increase in the unemployment rate is unlikely to change the narrative as , currently one of the more dovish FOMC members, has alluded to.
- MNI NFP Preview: https://media.marketnews.com/USNFP_May2025_Preview_4f6765878b.pdf
US TSY FUTURES: Bias Towards Short Setting Seen On Thursday
OI data points to a mix of net short setting (TU, FV, TY & WN) and long cover (UXY & US) during Thursday's sell off.
- The curve-wide bias was tilted firmly towards net short setting, with just over $4mn DV01 equivalent of fresh net shorts added curve-wide.
- Firmer crude oil prices and a less-stagflationary-than-expected ISM manufacturing reading more than reversed the pre-ISM rally.
| 01-May-25 | 30-Apr-25 | Daily OI Change | OI DV01 Equivalent Change ($) |
TU | 4,177,720 | 4,135,112 | +42,608 | +1,574,520 |
FV | 6,956,466 | 6,895,202 | +61,264 | +2,644,013 |
TY | 4,921,290 | 4,910,246 | +11,044 | +708,131 |
UXY | 2,287,455 | 2,296,685 | -9,230 | -821,114 |
US | 1,781,213 | 1,781,493 | -280 | -36,097 |
WN | 1,883,133 | 1,881,515 | +1,618 | +304,002 |
|
| Total | +107,024 | +4,373,454 |
STIR: Mix Of Short Setting & Long Cover Seen In SOFR Futures On Thursday
OI data points to a mix of net short setting and long cover in SOFR futures during Thursday’s eventual sell off.
- Net long cover was more prominent in the whites and reds (albeit with pockets of net short setting seen), before net short setting came to the fore further out the strip.
| 01-May-25 | 30-Apr-25 | Daily OI Change | Daily OI Change In Packs | ||
| SFRH5 | 1,103,975 | 1,093,512 | +10,463 | Whites | -39,085 |
| SFRM5 | 1,231,058 | 1,229,787 | +1,271 | Reds | -18,846 |
| SFRU5 | 980,440 | 1,007,147 | -26,707 | Greens | +8,852 |
| SFRZ5 | 1,058,532 | 1,082,644 | -24,112 | Blues | +22,521 |
| SFRH6 | 725,420 | 734,082 | -8,662 | ||
| SFRM6 | 706,973 | 717,141 | -10,168 | ||
| SFRU6 | 698,066 | 696,496 | +1,570 | ||
| SFRZ6 | 849,782 | 851,368 | -1,586 | ||
| SFRH7 | 651,768 | 648,457 | +3,311 | ||
| SFRM7 | 563,070 | 561,560 | +1,510 | ||
| SFRU7 | 365,875 | 365,112 | +763 | ||
| SFRZ7 | 402,186 | 398,918 | +3,268 | ||
| SFRH8 | 279,685 | 270,440 | +9,245 | ||
| SFRM8 | 196,537 | 189,689 | +6,848 | ||
| SFRU8 | 153,729 | 149,295 | +4,434 | ||
| SFRZ8 | 164,241 | 162,247 | +1,994 |
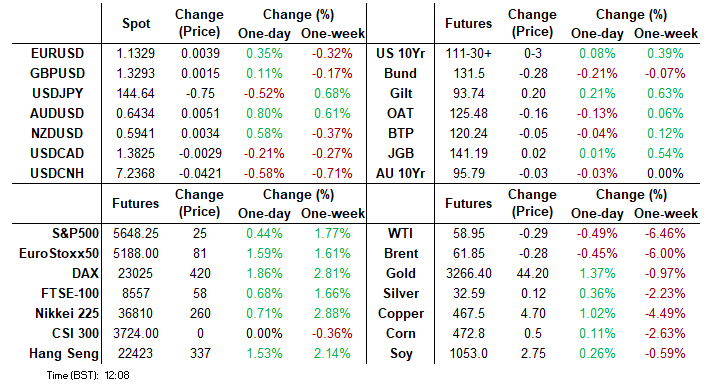
FOREX: Greenback Fades with Yields Headed into April Payrolls
- The greenback is weaker against all others early Friday, with the USD Index reversing off yesterday's recovery high at 100.375. GBP is similarly weak, helping EUR/GBP snap the weakness posted through support earlier this week.
- Potential trade talks remain a focus for markets - with deals made between the US and Japan, US and India seen as particularly advanced. The Japanese finance minister Kato noted that currency management has not been a feature of talks so far, nor has any Plaza Accord 2.0 concept come up - meaning any potential agreements are likely to be highly trade oriented - conversations which have helped allow USD/JPY to hold the majority of the rally posted on yesterday's dovish turn from the BoJ on Thursday.
- We noted yesterday the extended consolidation phase for AUD/USD, which has now stretched to 10 consecutive sessions of the price trading either side of $0.64. This is a relatively uncommon pattern that rarely extends beyond this streak, and historically resolves with a weaker AUD/USD and a break lower. Weakness from here would heighten focus on the 50-day EMA support at 0.6316.
- Focus shifts to the upcoming US jobs report. Nonfarm payrolls growth is expected at 135k, although potential weather distortions have made it harder to get a sense of underlying trends in recent months. Central bank speak is quiet - with no notable appearances due. The Fed remain inside their pre-decision media blackout period.
AUD: Rare Extension of Consolidation, Which Usually Resolves in Weaker AUD
We noted yesterday the extended consolidation phase for AUD/USD, which has now stretched to 10 consecutive sessions of the price trading either side of $0.64.
- This is a relatively uncommon pattern that rarely extends beyond this streak, and historically resolves with a weaker AUD/USD and a break lower. Weakness from here would heighten focus on the 50-day EMA support at 0.6316.
Since the onset of COVID, price has only hugged a handle this closely on four other occasions - before breaking the pattern and moving lower:
- January 2024: 9 sessions either side of $0.6600 before moving lower
- April 2023: 10 sessions either side of $0.6700 before moving lower
- September 2022: 9 sessions either side of $0.6500 before moving lower
- June 2020: 10 sessions either side of $0.6900 before moving lower
OPTIONS: Expiries for May02 NY cut 1000ET (Source DTCC)
- EUR/USD: $1.1150(E897mln), $1.1290-00(E1.0bln), $1.1370-85(E1.2bln)
- USD/JPY: Y144.63-65($629mln), Y145.00($609mln), Y146.00($778mln)
- AUD/USD: $0.6450(A$729mln), $0.6550(A$803mln)
- NZD/USD: $0.5970-80(N$665mln)
- USD/CAD: C$1.3825($598mln), C$1.3895-00($1.1bln)
EQUITIES: Eurostoxx 50 Futures Build on Recent Gains, Above 20-, 50-Day EMAs
- Eurostoxx 50 futures maintain a positive tone and are building on recent gains. The contract has cleared the 20-day EMA and the 50-day EMA, at 5102.56. A clear break of this average would strengthen the current bull cycle and signal scope for a continuation of the corrective uptrend. This would open 5165.00 next, the Apr 3 high. Support to watch lies at 4812.00, the Apr 16 low. Clearance of this level would highlight a reversal.
- The recovery in the e-mini S&P continues, with a tenth consecutive session of higher highs - the longest winning streak of the year so far, underpinning the short-term positive momentum for stocks. The bull cycle that started on Apr 7, remains in play and has breached a number of important short-term resistances. The index has topped 5618.25, the 50-day EMA, opening layered resistance at 5773.25-5774.43.
COMMODITIES: Gold Remains Within Range of Recent Lows
- A medium-term bearish trend in WTI futures strengthened this week and the latest move down reinforces this theme, signalling the end of the correction between Apr 9 - 23. The correction allowed an oversold trend condition to unwind. A clear resumption of the bear cycle would open $53.72, a Fibonacci projection. Initial support has broken at $58.29, the Apr 29 low. Resistance to watch is $64.87, the 50-day EMA.
- Gold is off lows early Friday, but remains within range of recent lows after markets pressuring prices toward multi-week lows and opening a sizeable gap with the recent high. The S/T weakness has pressured support at the 20-day EMA at $3243.7, which could begin to signal a short-term top should the price stay fragile. $3167.8 marks the next key downside level, the April 3 high and recent breakout. For now, moving average studies are in a bull-mode position highlighting a dominant uptrend. The next objective is $3547.9, a Fibonacci projection.
| Date | GMT/Local | Impact | Country | Event |
| 02/05/2025 | 1230/0830 | *** | Employment Report | |
| 02/05/2025 | 1400/1000 | ** | Factory New Orders | |
| 02/05/2025 | 1700/1300 | ** | Baker Hughes Rig Count Overview - Weekly | |
| 02/05/2025 | 1700/1300 | ** | Baker Hughes Rig Count Overview - Weekly |