MNI US MARKETS ANALYSIS - AUD Posting Rare Consolidation Phase
Highlights:
- Market muted as Europe have day off, keeping UK trade thin
- AUD posting rare extended consolidation phase, which historically resolves in weakness
- ISM Manufacturing in focus after yesterday's weak MNI Chicago PMI
US TSYS: TYA Probes Resistance, 5s30s Close To Cycle Highs
- Treasuries have pushed to session highs across 2-10Y tenors with an added boost from GM cutting its outlook and noting tariff exposure currently up to $5bn.
- It extends modest gains across the curve, building on the BoJ holding its policy rate and lowering economic forecasts plus sizeable declines in crude oil futures (WTI -2.7%).
- Today sees further labor market data and manufacturing surveys before tomorrow’s NFP report (MNI preview here) along with continued focus on earnings (McDonalds and Mastercard still to come pre-market before Air BnB, Amazon and Apple after the close).
- Cash yields are between 1.5-2.5bp lower.
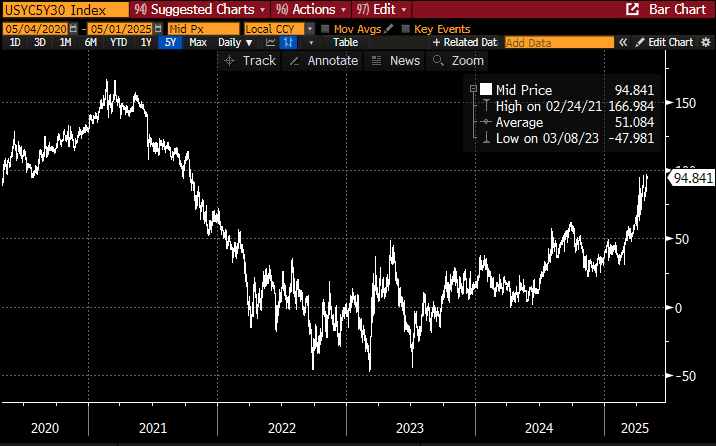
- It consolidates yesterday’s large steepening with 2s10s at 55bps and 5s30s at 95bps after hitting 97.5bp yesterday.
- 5s30s in particular is notable, at a level that it has struggled to push above for any sustained period of time including with deleveraging pressure after Apr 2 Liberation Day tariff announcements – see chart.
- TYM5 has recently pushed to session highs of 112-16 (+09) to match yesterday’s 112-16, on particularly low volumes of 215k that aren’t helped by holidays across Europe and Asia.
- It helps extend the bull cycle, testing resistance at the same 112-16 (1.0% 10-dma envelope) after which lies 113-04 (76.4% retrace of Apr 7-11 bear leg). To the downside, 111-07+ 20-day EMA).
- Data: Challenger job cuts Apr (0730ET), Weekly jobless claims (0830ET), S&P Global US mfg PMI Apr final (0945ET), ISM mfg Apr (1000ET), Construction spending Mar (1000ET)
- Bill issuance: US Tsy $85B 4W, $75B 8W bill auctions (1130ET)
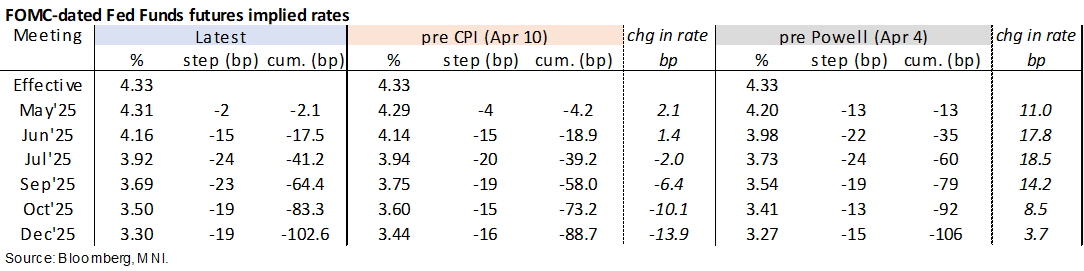
STIR: US Front Rates Await US Session Whilst Terminal Yield Pushes Lower Still
- Fed Funds implied rates for 2025 meetings have more than reversed a small lift in Asia hours with downward pressure from crude oil futures.
- Looking more broadly though, they continue a pattern seen throughout this week whereby Asia/London hours see flat to slightly higher rates before sharper declines through NY hours.
- Whilst off yesterday’s lows, implied rates still point to over 100bp of cuts for the rest of the year having reversed a shift to ~75bp of cuts seen after the 90-day tariff pause on Apr 9.
- Cumulative cuts from 4.33% effective: 2bp for next week, 17.5bp Jun, 41bp Jul, 64bp Sep and 103bp Dec.
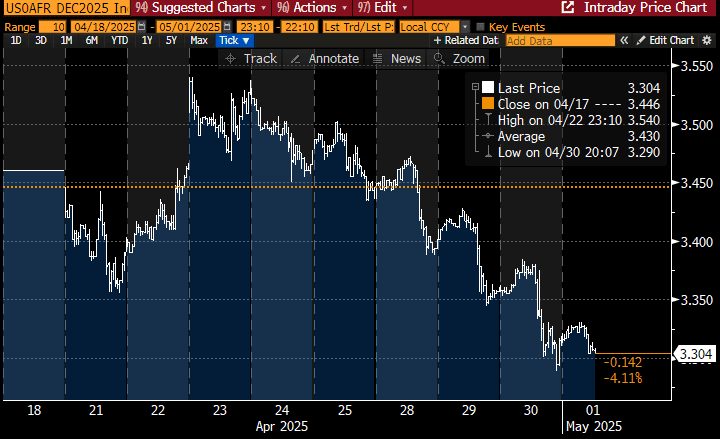
- SOFR futures meanwhile continue to extend gains further out the curve, translating to another 2.5bp dip in the terminal implied yield to 2.915% (SFRU6, last closed lower in Sept) and 3.5bp declines out in 2H27 contracts.
- Today’s data includes Challenger job cut announcements, weekly jobless claims, the final manufacturing PMI and ISM manufacturing, all before tomorrow’s NFP report.
US TSY FUTURES: Exposure Added In Most Contracts On Wednesday
OI data points to a mix of positioning swings during Wednesday’s twist steepening of the curve.
- Net long setting was apparent across the front end and intermediates (TU, FV & TY), before net short setting (UXY & WN) and net long cover (US futures) became more prominent further out the curve.
- The curve-wide bias was skewed towards fresh position setting, with just under $6mn DV01 equivalent of fresh net exposure added.
| 30-Apr-25 | 29-Apr-25 | Daily OI Change | OI DV01 Equivalent Change ($) |
TU | 4,129,618 | 4,086,092 | +43,526 | +1,618,543 |
FV | 6,881,550 | 6,831,873 | +49,677 | +2,155,933 |
TY | 4,907,095 | 4,863,354 | +43,741 | +2,820,607 |
UXY | 2,297,645 | 2,284,840 | +12,805 | +1,146,276 |
US | 1,782,348 | 1,799,129 | -16,781 | -2,182,234 |
WN | 1,881,582 | 1,879,842 | +1,740 | +330,484 |
|
| Total | +134,708 | +5,889,609 |
STIR: Mix Of Positioning Swings Seen In SOFR Futures On Wednesday
OI data points to a mix of net long cover, long setting and short cover in the SOFR whites on Wednesday, with net long setting then dominating in the reds and greens.
- Swings in wider risk appetite amid a data-driven intensification of stagflationary worry dictated price action for much of the day.
| 30-Apr-25 | 29-Apr-25 | Daily OI Change |
| Daily OI Change In Packs |
SFRH5 | 1,093,644 | 1,103,977 | -10,333 | Whites | -43,553 |
SFRM5 | 1,229,946 | 1,269,822 | -39,876 | Reds | +49,366 |
SFRU5 | 1,007,151 | 981,404 | +25,747 | Greens | +46,906 |
SFRZ5 | 1,080,565 | 1,099,656 | -19,091 | Blues | -1,238 |
SFRH6 | 733,938 | 723,293 | +10,645 |
|
|
SFRM6 | 717,141 | 689,143 | +27,998 |
|
|
SFRU6 | 696,516 | 692,978 | +3,538 |
|
|
SFRZ6 | 853,405 | 846,220 | +7,185 |
|
|
SFRH7 | 648,477 | 625,220 | +23,257 |
|
|
SFRM7 | 561,580 | 545,070 | +16,510 |
|
|
SFRU7 | 365,112 | 359,039 | +6,073 |
|
|
SFRZ7 | 398,918 | 397,852 | +1,066 |
|
|
SFRH8 | 270,440 | 267,903 | +2,537 |
|
|
SFRM8 | 189,722 | 188,797 | +925 |
|
|
SFRU8 | 149,328 | 150,450 | -1,122 |
|
|
SFRZ8 | 162,280 | 165,858 | -3,578 |
|
|
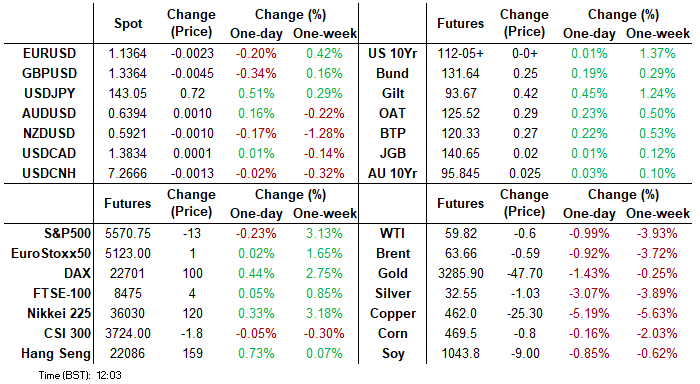
FOREX: JPY Falters as BoJ Kick the Can on Rate Hikes
- A dovish turn from the BoJ board has contained the JPY, pressuring the currency against all others in G10 headed into the NY crossover. USD/JPY rallied comfortably through the Y144.00 handle to touch Y144.74 - thereby pressuring the next major topside level at 145.55 - the 50% retracement of the downleg posted off the late March high.
- Moves follow the BoJ not only stressing the uncertainty surrounding current monetary policy, but also cutting their growth outlook over the short- and medium-term as well as pushing back their forecast for when they will achieve their domestic price target. The dovish turn pressured BoJ rate hike pricing, with only 10bps now priced for the rest of the year.
- GBP/USD slipped across the Asia-Pac session, pressuring GBP/USD to a new weekly low at 1.3275 as the bearish tweezer top candle pattern formed on Monday & Tuesday played out. The rate appears to have bottomed out into the crossover, as the USD Index drifts off the overnight high.
- ISM Manufacturing data is the calendar highlight Thursday, and follows the lower-than-expected MNI Chicago PMI print yesterday. The Fed remain inside their pre-meeting media blackout, keeping central bank communications very light.
AUD: Rare Extended Consolidation Phase, Historically Resolves With Weakness
- Having posted the highest levels of short-end realised vol in over two years, AUD/USD has now entered a consolidation phase - with spot trading either side of the $0.6400 handle for nine consecutive sessions, a relatively uncommon pattern that rarely extends beyond this streak. A break lower would heighten focus on the 50-day EMA support at 0.6314.
Since the onset of COVID, price has only hugged a handle this closely on four other occasions - two of which extended to one more session, before breaking the pattern and moving lower:
- January 2024: 9 sessions either side of $0.6600 before moving lower
- April 2023: 10 sessions either side of $0.6700 before moving lower
- September 2022: 9 sessions either side of $0.6500 before moving lower
- June 2020: 10 sessions either side of $0.6900 before moving lower
OPTIONS: EUR/USD Could Be Contained by Expiries Into ISM Manufacturing Release
Larger FX option strikes rolling off at the NY cut today include decent sized expiries in EUR/USD today, which could contain price action through to the ISM Manufacturing release:
- EUR/USD: $1.1270(E1.1bln), $1.1330-50(E888mln), $1.1385(E589mln)
- USD/JPY: Y143.00-20($1.8bln), Y144.00($1.0bln), Y145.75($1.6bln)
- EUR/GBP: Gbp0.8485-00(E690mln)
- AUD/USD: $0.6310-25(A$502mln)
GOLD: 2% Lower On Equity and USD Recovery; Dominant Uptrend Still Intact For Now
Gold prices are over 2% lower on the session at $3,220, with global equities and the USD finding support from yesterday’s strong US tech earnings (Microsoft and Meta) and hopes for US trade deals in the coming weeks.
- Initial support at the 20-day EMA ($3,244.2/oz) has been pierced, which could begin to signal a short-term top should the price stay fragile. $3,167.8 marks the next key downside level, the April 3 high and recent breakout.
- The S&P 500 index has now fully retraced the April 3 - April 7 reciprocal tariff-driven selloff, which has contributed to a wave of profit taking amongst gold investors.
- For now though, moving average studies remain in a bull-mode position highlighting a dominant uptrend. Initial resistance is the April 23 high at $3,386.6, which shields the April 22 all-time high of $3,500.1
COMMODITIES: Latest Move Lower for WTI Futures Reinforces Bearish Theme
- A medium-term bearish theme in WTI futures remains intact and the latest move down reinforces this theme, signalling the end of the correction between Apr 9 - 23. The correction allowed an oversold trend condition to unwind. A clear resumption of the bear cycle would open $53.72, a Fibonacci projection. Initial support to watch is at $58.29, the Apr 29 low. Resistance to watch is $65.38, the 50-day EMA.
- Gold is unchanged and the yellow metal continues to trade below its recent highs. The trend needle points north and the latest move down appears corrective. The retracement has allowed an overbought condition to unwind. Moving average studies are in a bull-mode position highlighting a dominant uptrend. The next objective is $3547.9, a Fibonacci projection. Initial firm support to watch lies at 3239.5, the 20-day EMA.
EQUITIES: Break of 50-Day EMA Strengthens E-Mini S&P Bull Cycle
- Eurostoxx 50 futures maintain a positive tone and are holding on to their recent gains. The contract has cleared the 20-day EMA and pierced the 50-day EMA, at 5102.56. A clear break of this average would strengthen the current bull cycle and signal scope for a continuation of the corrective uptrend. This would open 5165.00 next, the Apr 3 high. Support to watch lies at 4812.00, the Apr 16 low. Clearance of this level would highlight a reversal.
- A corrective bull cycle in S&P E-Minis that started on Apr 7, remains in play. The contract has breached a number of important short-term resistance points. Price has cleared the 20-day EMA and pierced 5528.75, the Apr 10 high. The next key resistance is 5618.25, the 50-day EMA. A clear breach of this EMA would strengthen a bull theme. Initial key support lies at 5127.25, the Apr 21 low. A break would be bearish.
| Date | GMT/Local | Impact | Country | Event |
| 01/05/2025 | - | *** | Domestic-Made Vehicle Sales | |
| 01/05/2025 | 1230/0830 | *** | Jobless Claims | |
| 01/05/2025 | 1230/0830 | ** | WASDE Weekly Import/Export | |
| 01/05/2025 | 1345/0945 | *** | S&P Global Manufacturing Index (final) | |
| 01/05/2025 | 1400/1000 | *** | ISM Manufacturing Index | |
| 01/05/2025 | 1400/1000 | * | Construction Spending | |
| 01/05/2025 | 1430/1030 | ** | Natural Gas Stocks | |
| 01/05/2025 | 1530/1130 | * | US Bill 08 Week Treasury Auction Result | |
| 01/05/2025 | 1530/1130 | ** | US Bill 04 Week Treasury Auction Result | |
| 02/05/2025 | 0130/1130 | * | Producer price index q/q | |
| 02/05/2025 | 0130/1130 | *** | Retail trade quarterly | |
| 02/05/2025 | 0130/1130 | ** | Retail Trade | |
| 02/05/2025 | 0630/0730 | DMO to announce details of long syndication for W/C 19 May | ||
| 02/05/2025 | 0715/0915 | ** | S&P Global Manufacturing PMI (f) | |
| 02/05/2025 | 0745/0945 | ** | S&P Global Manufacturing PMI (f) | |
| 02/05/2025 | 0750/0950 | ** | S&P Global Manufacturing PMI (f) | |
| 02/05/2025 | 0755/0955 | ** | S&P Global Manufacturing PMI (f) | |
| 02/05/2025 | 0800/1000 | ** | S&P Global Manufacturing PMI (f) | |
| 02/05/2025 | 0900/1100 | *** | HICP (p) | |
| 02/05/2025 | 0900/1100 | ** | Unemployment | |
| 02/05/2025 | 1130/2030 | * | Labor Force Survey | |
| 02/05/2025 | 1230/0830 | *** | Employment Report | |
| 02/05/2025 | 1400/1000 | ** | Factory New Orders | |
| 02/05/2025 | 1700/1300 | ** | Baker Hughes Rig Count Overview - Weekly | |
| 02/05/2025 | 1700/1300 | ** | Baker Hughes Rig Count Overview - Weekly |