MNI EUROPEAN MARKETS ANALYSIS: Tensions Weigh on Sentiment
- News Headlines were dominated today by the apparent approval by Donald Trump on attack plans for Iran, though seemingly he has not made a final decision as to when.
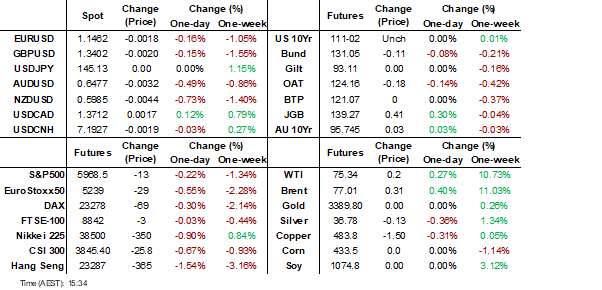
- Market sentiment remains challenged with most major bourses trending lower across the region whilst Oil's rise was modest.
- Markets will continue to digest the output from the Federal Reserve's decision to remain on hold and Chairman Powell's stance that there appears to be no rush to alter rates at this stage.
- Later the SNB and BoE announce decisions. The ECB’s Lagarde, de Guindos and Buch speak. April euro area construction prints. The US is closed for a holiday.
MARKETS
US TSYS: Asia Wrap - TYU5 Slightly Higher
The TYU5 range has been 110-23+ to 110.30 during the Asia-Pacific session. It last changed hands at 110-27+, up 0-02 from the previous close.
- Cash Market Closed
- (Bloomberg) -- “Macquarie Group moved its forecast for the next Federal Reserve interest-rate cut to December, after previously seeing no reductions this year. The firm now sees one cut in 2026, also by a quarter-point. “We continue to anticipate 50 bps of cuts ahead, but bring forward our timing slightly. Tolerance for higher core PCE could pave the way for a 2025 cut.”
- “The willingness of FOMC participants to continue to project 50 bps of cuts despite projecting more elevated core PCE inflation leads us to shift our baseline view for the timing of rate cuts ahead.”
- “Foreign investors' holdings of US Treasuries totaled $9.01 trillion in April, the second-highest figure on record, despite market turmoil.”(BBG)
- The 10-year yield continues to find decent supply back towards its 4.30/35% support, this area needs to hold if yields are to move higher. The range looks to be 4.30% - 4.60% for now a break either side would provide a clearer direction.
- Data/Events: Philadelphia Fed Business Outlook, Leading Index
JGBS: 5Y Leads Yields Lower, MoF Considering Cutting LT Issuance
JGB futures surged higher in the Tokyo afternoon session, +42 compared to settlement levels, after news that the MoF is considering trimming its issuance of super-long bonds starting in July. A draft of a revised bond issuance plan was seen by Bloomberg.
- “The ministry is set to propose cutting issuance of 20-, 30- and 40-year bonds by ¥100 billion ($690 million) each per auction through the end of March 2026, the draft plan showed Thursday. To offset the decrease, the ministry is considering increasing issuance of 2-year bonds and other shorter-dated debts." – BBG
- There has been no cash US tsy trading today due to a holiday. TYU5 is slightly stronger than closing levels
- Cash JGBs are flat to 4bps richer, with the 5-year leading after today’s supply.
- Today’s 5-year JGB auction showed mixed signals on demand. The low price came in below expectations at 100.05, but other indicators were notably strong. The bid-to-cover ratio surged to 4.5783x—the highest since 2023—up from 3.1894x, while the tail narrowed slightly to 0.05 from 0.06, both pointing to improved bidding interest.
- Swap rates are ~1bp lower. Swap spreads are wider.
- Tomorrow, the local calendar will see Natl CPI alongside a speech by BoJ Governor Ueda at the National Shinkin Bank Convention.
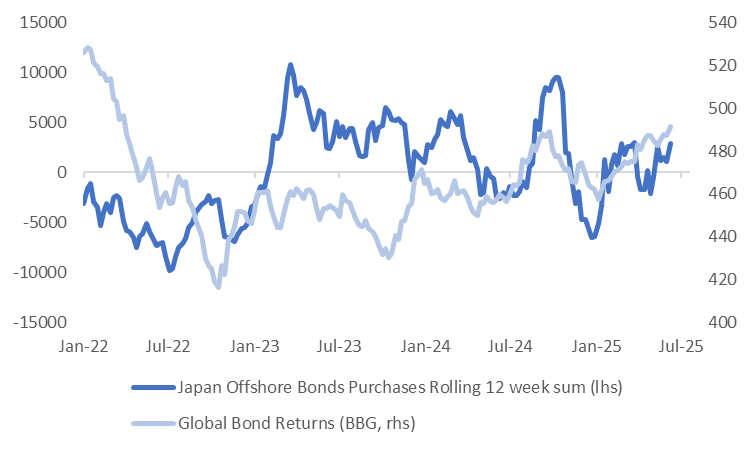
JAPAN DATA: Local Investors Offshore Bond Purchases Rebound
The standout from last week's offshore weekly investment flows was a surge in Japan buying of overseas bonds, see the table below. The near ¥1.6trln in net purchases was the largest since mid May and ends a run of consecutive weeks of outflows in this space. This did coincide with a pick up in global bond returns to the end of last week. The chart below plots rolling 12 week sum of offshore bond purchases against global bond returns. At face value, local investors remaining net buyers of offshore debt will be reassuring from the standpoint of Japan's important role in providing capital to global markets in this space (at least from this short term standpoint of Q2).
- Elsewhere, Japan investors sold overseas equities for the 5th straight week, albeit in reduced sized compared to the prior week.
- In terms of inflows into Japan assets, offshore investors were net buyers of both local equities and bonds. For equities this marked the 11th straight week of net buying.
Table 1: Japan Weekly Offshore Investment Flows
| Billion Yen | Week ending June 13 | Prior Week |
| Foreign Buying Japan Stocks | 473.4 | 179.8 |
| Foreign Buying Japan Bonds | 434.5 | 220.4 |
| Japan Buying Foreign Bonds | 1571.3 | -453.6 |
| Japan Buying Foreign Stocks | -84.5 | -1489 |
Source: Bloomberg Finance L.P./MNI
Fig 1: Japan Rolling Offshore Bond Purchases & Global Bond Returns
Source: Bloomberg Finance L.P./MNI
AUSSIE BONDS: Modest Bull-Flattener, Subdued Session Despite Jobs Data
ACGBs (YM +1.0 & XM +3.5) sit slightly stronger after dealing in narrow ranges.
- While headline new jobs were softer than expected, the details remained quite strong and signalled no easing in labour market conditions. Employment fell 2.5k but full-time jobs increased 38.7k.
- The RBA looks beyond headline employment and unemployment rate data to gauge labour market developments. In terms of these indicators, underemployment fell in May, and hours worked rose. However, vacancies-to-unemployment trended lower, and the youth unemployment rate rose. The mixed data suggest that, like the Q2 averages, there was no material shift in labour market conditions this quarter.
- There was no cash US tsys today due to a holiday. TYU5 is slightly stronger than closing levels.
- Cash ACGBs are holding a modest bull-flattener, with yields 1-3bps lower.
- The bill strip has twist-flattened, with pricing -3 to +2.
- RBA-dated OIS pricing is 1-3bps firmer across meetings after the data. A 25bp rate cut in July is given a 76% probability, with a cumulative 71bps of easing priced by year-end.
- Tomorrow, the local calendar will be empty.
- The AOFM plans to sell A$800mn of the 1.00% 21 December 2030 bond tomorrow.
AUSTRALIA DATA: Q2 Labour Market Conditions Little Changed
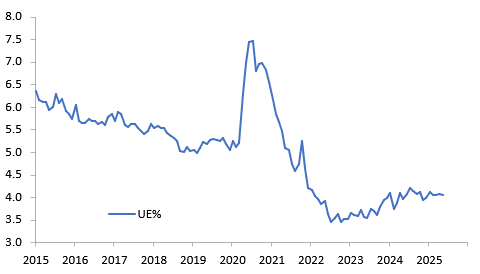
While headline new jobs were softer than expected, the details remained quite strong and signalled no easing in labour market conditions. Employment fell 2.5k but full-time jobs increased 38.7%, hours worked rose sharply and underemployment fell. The unemployment rate was stable at 4.1%, the fifth straight month. The data is consistent with the RBA remaining cautious.
Australia unemployment rate %
Source: MNI - Market News/ABS
- The May unemployment rate remained a low 4.1% at 4.057% after 4.07%. The RBA is forecasting Q2 unemployment at 4.2%. The number of unemployed fell 2.6k in May and is up only 28.2k or 4.8% over the last year.
- The labour force was flat in May but up 109k YTD or 2.4% y/y, while employment rose 91.4k YTD or 2.3% y/y. Thus the economy is almost creating enough jobs for those entering the market.
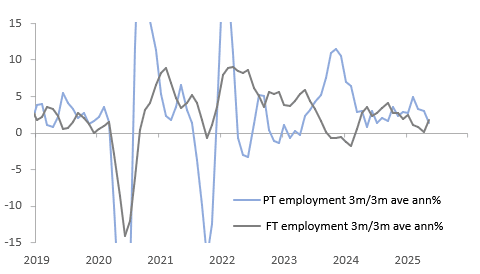
- Full-time (FT) employment rose 38.7k in May compared with a 41.2k drop in part-time (PT) with growth rates at 2.6% y/y and 1.7% y/y respectively. 3-month momentum is now stronger for FT than PT for the first time since November.
- FT outperforming PT again is a sign of continued strength in the labour market as firms are confident enough to increase hours or hire FT employees. The 1.3% m/m & 3.1% y/y rise in total hours worked was also concentrated in FT up 1.5% m/m & 3.4% y/y with PT +0.4% & 1.7% y/y. It rebounded following April holidays and extreme weather.
- Averages suggest that there has been little change in labour market conditions in Q2 with employment growth averaging 2.4% y/y up from Q1’s 2.3%, above the RBA’s 2.1% Q2 forecast. The unemployment rate has been steady in Q2 and the growth in hours worked unchanged at 2.1% y/y.
Australia full-time vs part-time employment %
Source: MNI - Market News/ABS
RBA: Underemployment Lower, Youth Unemployment Higher, Vacancies Trending Down
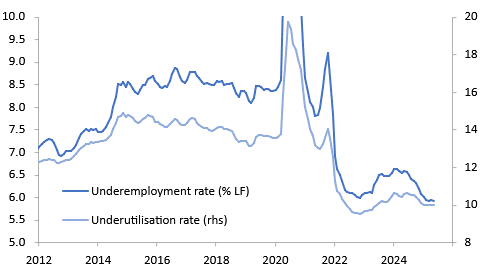
The RBA looks beyond headline employment and unemployment rate data to try and gauge labour market developments. In terms of the indicators it has said it monitors, underemployment fell in May and hours worked are recovering, while vacancies-to-unemployment is trending lower and the youth unemployment rate rose last month but remains close to its recent trend. The mixed data suggest that like the Q2 averages, there was unlikely a material shift in labour market conditions this quarter.
- The underemployment rate fell 0.1pp to 5.9% after it rose to 6% in April. It has been steady around 5.9% since December, while underutilisation has been around 10% all year and below the 10.5% 2024 average.
Australia underemployment vs underutilisation rates % 3-mth ma
- The youth unemployment rate rose 0.5pp in May to 9.4%, the highest since August 2024. The Q2 average to date is 9.1% up slightly from Q1’s 9.0%. The RBA sees it as a lead indicator of the labour market but the series can also be volatile.
- Hours worked were impacted by April holidays and severe weather events in Queensland and NSW. But they rebounded in May driven by full-time jobs to be up 3.1% y/y and 3-month momentum also turned.
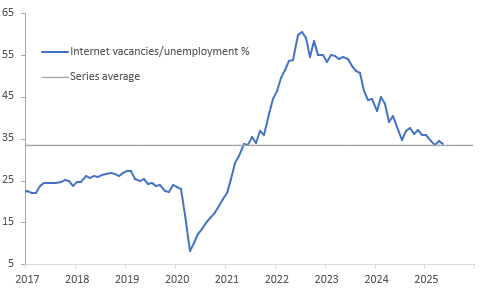
- Vacancies continue trending lower with the internet vacancy-to-unemployment ratio returning to the historical average in May. SEEK job ads fell 0.3% m/m last month to be down 5.6% y/y and April applicants per job continued rising signalling solid labour supply growth. The Q2 ABS data prints on June 26.
Australia internet vacancies/unemployment
BONDS: NZGBS: Closed With A modest Bull-Flattener Despite GDP Beat
NZGBs closed with modest gains, benchmark yields 1-2bps lower, after reversing the initial reaction to stronger-than-expected Q1 GDP data.
- Q1 NZ production-based GDP was stronger than expected, rising 0.8% q/q, resulting in the annual rate falling 0.7% y/y but up from the downwardly-revised -1.3% in Q4.
- Expenditure GDP rose 0.9% q/q, the fastest since Q2 2023, to be down 0.2% y/y after -1.1% in Q4. Growth in Q1 was fairly broad-based and substantially above the RBNZ’s May forecast. While it is backwards-looking data, it may allow the central bank to pause in July, especially given the pickup in inflation.
- Today’s supply saw solid demand metrics, with cover ratios around 3.50x across lines.
- There is no cash US tsys today due to a holiday. TYU5 is little changed from closing levels.
- Swap rates closed flat to 2bps lower.
- (Bloomberg) -- Citi pushes back its forecast for an RBNZ interest rate cut to August 20 from July 9, citing better-than-expected GDP figures and the stance taken by Governor Christian Hawkesby last month.
- RBNZ dated OIS pricing closed little changed across meetings. 4bps of easing is priced for July, with a cumulative 25bps by November 2025.
- Tomorrow, the local calendar will be empty.
NEW ZEALAND: Q1 Growth Materially Stronger Than RBNZ Forecast
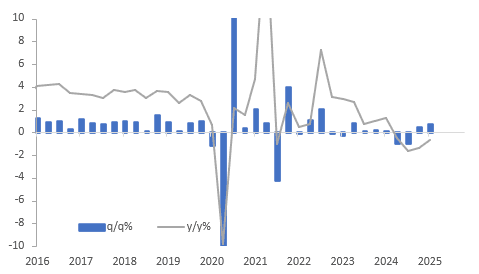
Q1 NZ production-based GDP was stronger than expected rising 0.8% q/q resulting in the annual rate falling 0.7% y/y but up from the downwardly-revised -1.3% in Q4. Expenditure GDP rose 0.9% q/q, the fastest since Q2 2023, to be down 0.2% y/y after -1.1% in Q4. Growth in Q1 was fairly broad based and substantially above the RBNZ’s May forecast. While it is backward-looking data, it may allow the central bank to pause in July especially given the pickup in inflation.
NZ production-based GDP %
Source: MNI - Market News/LSEG
- Nine of sixteen industries posted an increase in growth with primary, goods and services sectors all positive.
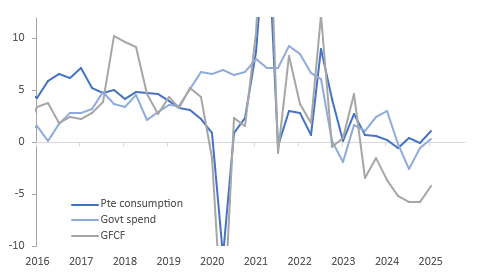
- Domestic demand was robust rising 1.1% q/q to be down 0.3% y/y after -1.5% y/y in Q4. This was the second straight quarter of growth.
- Private consumption rose 1.3% q/q driven by spending on services, durables and non-durables. It was the strongest quarter since Q1 2022 which was impacted by the post-Covid recovery. This strength is in contrast to card transaction and consumer sentiment data, which have been flat and pessimistic respectively.
- Government spending rose 1.1% q/q to be 0.3% y/y higher up from -0.6% y/y.
- GFCF rose 0.6% q/q, the first positive after 7 consecutive declines. The pickup was driven by a 2% q/q rise in residential building, a sign that the construction sector is recovering. Other GFCF fell 0.1% q/q.
- Net exports detracted 0.1pp from growth due to slightly higher goods & services imports but a sharp 8.5% q/q drop in services exports offsetting the 3.6% q/q rise in goods shipments.
- Productivity rose 0.8% q/q and rose 0.4% y/y, the second consecutive quarterly increase, which the RBNZ will want to see continue as low productivity growth has been a concern.
- GDP per capita increased 0.5% q/q in Q1.
NZ domestic demand y/y%
FOREX: Asia FX Wrap - USD Bounce Needs Confirmation Of US Entering The Conflict
The BBDXY has had a range of 1209.02 - 1212.22 in the Asia-Pac session, it is currently trading around 1211. "CHINA'S XIE: BENEFITS OF US-CHINA TRADE "GENERALLY BALANCED, PROTECTIONISM NO BETTER THAN DRINKING POISON WHEN THIRSTY, CURRENT US TARIFFS ON CHINA STILL `UNREASONABLY HIGH'' - BBG
- EUR/USD - Asian range 1.1451 - 1.1489, Asia is currently trading 1.1465. EUR has rejected the move above 1.1600 but dips should continue to find demand, first support back towards the 1.1400 area then 1.1100/1200. Price action does not look great in the short-term with a potential false break above 1.1500/1.1600.
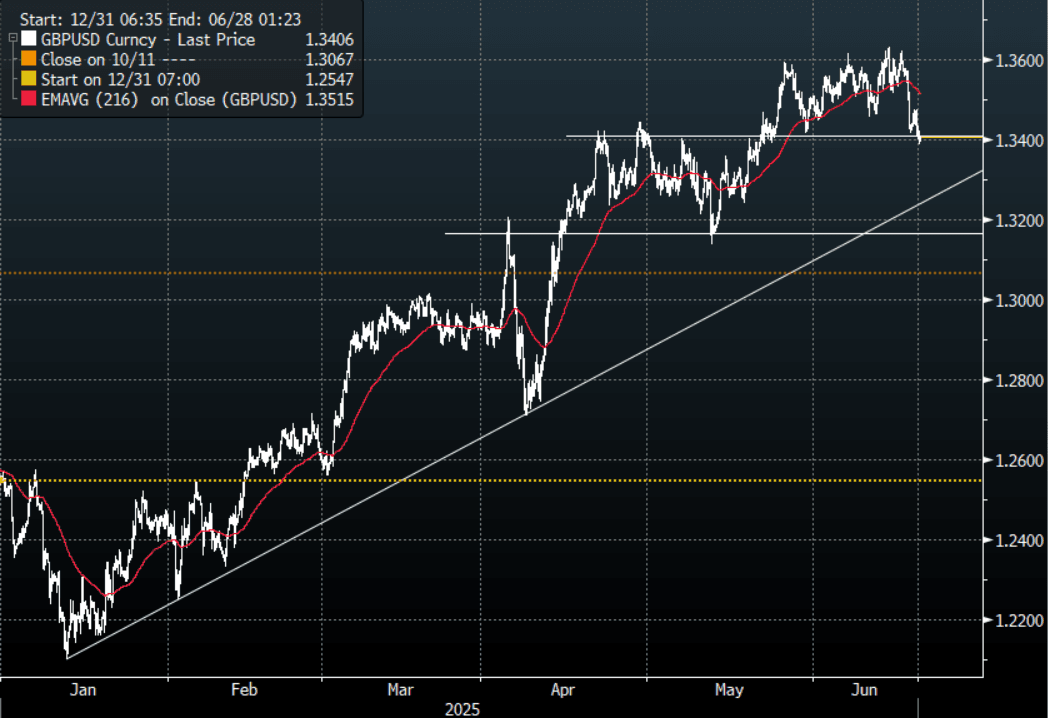
- GBP/USD - Asian range 1.3387 - 1.3433, Asia is currently dealing around 1.3405. The GBP looks to have failed in its attempts to break above the Weekly 1.35/36 pivot. First support is seen around the 1.3400 area, a sustained move back below here and we could see a deeper correction unfold.
- USD/CNH - Asian range 7.1919 - 7.1975, the USD/CNY fix printed 7.1729. Asia is currently dealing around 7.1935. Sellers should be around on bounces while price holds below the 7.2500 area and the PBOC manages the fix lower.
- Cross asset : SPX -0.20%, Gold $3373, TYU5 110-28, BBDXY 1211, Crude oil $75.09
- Data/Events : Spain Home Sales, EZ Construction Output,
Fig 1: GBP/USD Spot Hourly Chart
Source: MNI - Market News/Bloomberg Finance L.P
JPY: Asia Wrap - USD/JPY Can't Move Lower With Risk
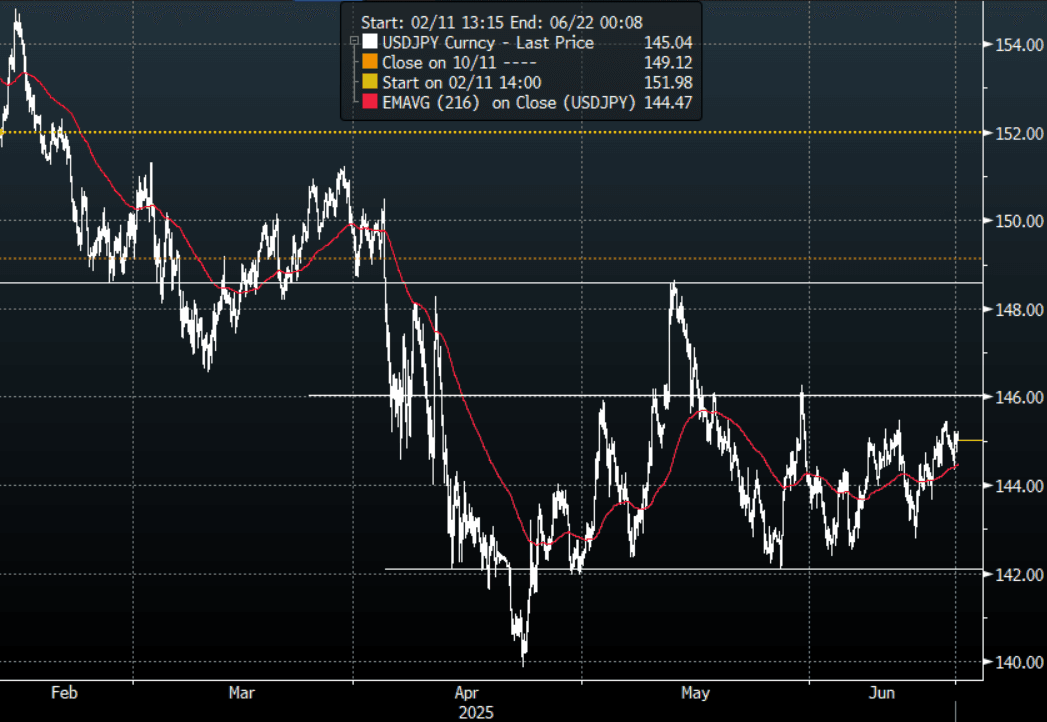
The Asia-Pac USD/JPY range has been 144.74 - 145.22, Asia is currently trading around 145.00. USD/JPY has drifted sideways in a muted Asian session. USD/JPY continues to find demand on dips back to 144.00/50 in the short-term, the wider range continues to hold.
- JAPAN DATA - Local Investors Offshore Bond Purchases Rebound : The standout from last week's offshore weekly investment flows was a surge in Japan buying of overseas bonds, see the table below. The near 1.6trln in net purchases was the largest since mid May and ends a run of consecutive weeks of outflows in this space.
- Elsewhere, Japan investors sold overseas equities for the 5th straight week, albeit in reduced sized compared to the prior week.
- USD/JPY again found decent demand overnight back around the 144.50 area. This price action stands out considering the risk backdrop and shows a market that is already very long JPY. A break below 144.00 is needed to see a move to the lower end of the range.
- Price is comfortable in its recent 142.00 - 146.00 range and will need a break either side of that to get a clearer direction.
- The market is clearly looking for a move lower in USD/JPY but with positioning quite large now we have seen the risk of pullbacks increase. A break above 146.00/50 would be needed to challenge the conviction of any shorts.
- Options : Close significant option expiries for NY cut, based on DTCC data: none. Upcoming Close Strikes : 146.00($1.92b June 20), 143.00($925m June 20)
Fig 1 : USD/JPY Spot Hourly Chart
Source: MNI - Market News/Bloomberg Finance L.P
AUD: Asia Wrap - AUD/USD Edges Lower
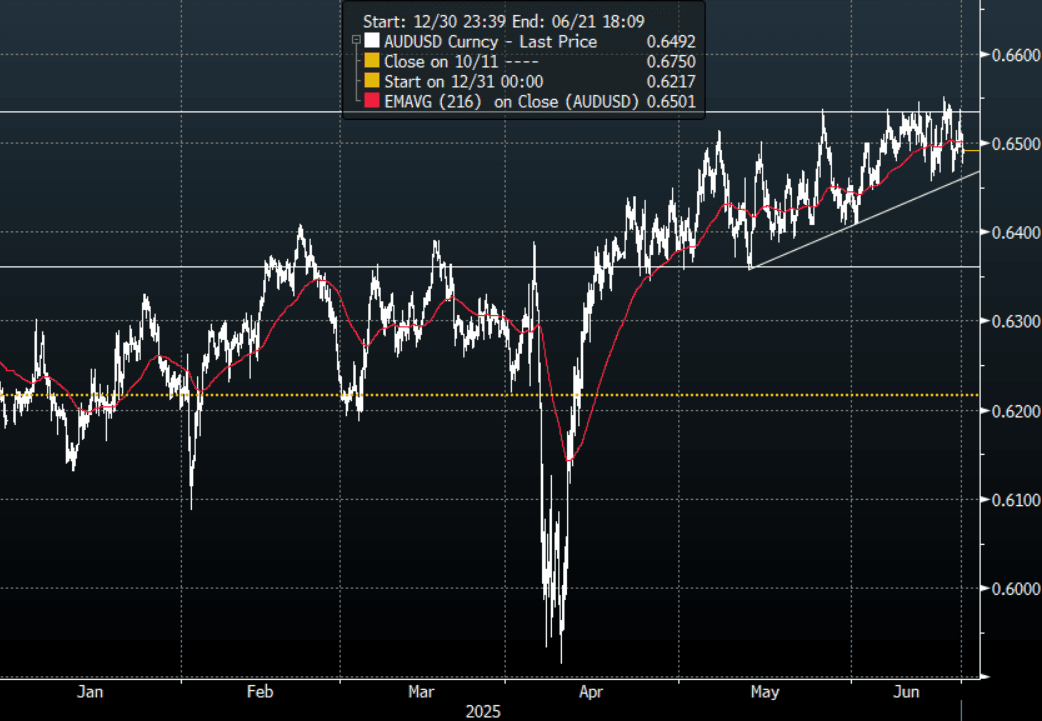
The AUD/USD has had a range of 0.6476 - 0.6511 in the Asia- Pac session, it is currently trading around 0.6490. The AUD has edged lower in our session -0.28%. All eyes are focused on the potential entry of the US into the Israel-Iran Conflict.
- AU DATA: Q2 Labour Market Conditions Little Changed. While headline new jobs were softer than expected, the details remained quite strong and signalled no easing in labour market conditions. Employment fell 2.5k but full-time jobs increased 38.7%, hours worked rose sharply and underemployment fell. The unemployment rate was stable at 4.1%, the fifth straight month. The data is consistent with the RBA remaining cautious.
- (Bloomberg) -- “US Preparing Strike On Iran In Coming Days. Headlines have crossed this morning that the US is preparing for possible strikes on Iran in coming days, with the weekend being eyed. The article stressed that the situation is evolving and plans could change.”
- The AUD/USD looks short-term to be comfortable in a 0.6450-0.6550 range as the market waits for more clarity on the Middle East and any confirmation of the US joining the fray.
- Price remains in the wider 0.6350 - 0.6550 range for now, a sustained break above 0.6550/0.6600 is needed for the move higher to accelerate.
- Technically buyers should continue to be around on dips while the support in the AUD/USD holds, a close back below 0.6350/00.6400 would start to see bulls be challenged.
- Options : Closest significant option expiries for NY cut, based on DTCC data: 0.6600(AUD1.15b), 0.6460(AUD708m). Upcoming Close Strikes : 0.6650(AUD 708m June 20), 0.6372(AUD 555m June 20)
- AUD/JPY - Today's range 93.81 - 94.51, it is trading currently around 94.15.Choppy price action as the pair establishes a range between 92.00 - 96.00. A break back below 91.50/92.00 is needed to see the move lower regain momentum and the focus turn back to the year's lows again.
Fig 1: AUD/USD spot Hourly Chart
Source: MNI - Market News/Bloomberg Finance L.P
NZD: Asia Wrap - NZD/USD Has A Look Below 0.6000
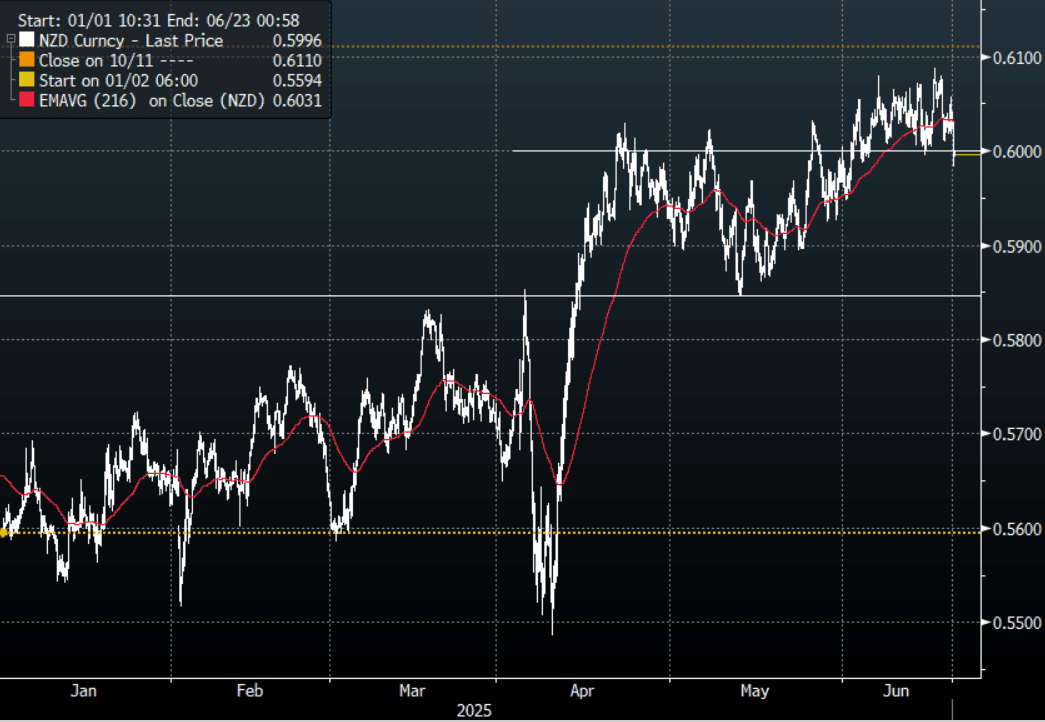
The NZD/USD had a range of 0.5983 - 0.6041 in the Asia-Pac session, going into the London open trading around 0.5995, -0.55%. The NZD has had a decent move lower in our session as risk turns lower with the potential entry of the U.S. into the Middle East conflict. Price has broken below its recent 0.6000 support and would have triggered any stops lingering just below that level. It feels like the market is waiting for confirmation of the US military committing itself to the war effort before deciding how to deploy risk. In that scenario can the NZD follow through on this break below 0.6000 before we have that information ?
- NEW ZEALAND: Q1 Growth Materially Stronger Than RBNZ Forecast. Q1 NZ production-based GDP was stronger than expected rising 0.8% q/q resulting in the annual rate falling 0.7% y/y but up from the downwardly-revised -1.3% in Q4. Expenditure GDP rose 0.9% q/q, the fastest since Q2 2023, to be down 0.2% y/y after -1.1% in Q4. Growth in Q1 was fairly broad based and substantially above the RBNZ’s May forecast. While it is backward-looking data, it may allow the central bank to pause in July especially given the pickup in inflation.
- (Bloomberg) -- “Citi pushes back its forecast for an RBNZ interest rate cut to August 20 from July 9, citing better-than-expected GDP figures and the stance taken by Governor Christian Hawkesby last month. “
- The NZD is attempting to break back below the 0.6000 area, a sustained break back below here and we could see a deeper pullback towards 0.5850 so watch to see if NZD/USD can reclaim 0.6000 in the overnight session.
- Technically while the support around 0.5850 holds in NZD/USD there should be buyers around on dips towards this area. A clear sustained break above 0.6050/0.6100 is needed for the pair to get momentum to push higher.
- Options : Closest significant option expiries for NY cut, based on DTCC data: none. Upcoming Close Strikes : 0.5830(NZD300m June 23), 0.5755(NZD300m June20)
- AUD/NZD range for the session has been 1.0788 - 1.0828, currently trading 1.0820. The cross has broken the multiple tops around 1.0800, if price can hold this break it would put a higher low in place on the Daily chart, and focus will return to the more important 1.0900 area once more.
Fig 1: NZD/USD Spot Hourly Chart
Source: MNI - Market News/Bloomberg Finance L.P
ASIA STOCKS: Middle East Tensions Weigh Heavy on Stocks
Most major bourses were down today as stories suggest that President Trump has approved US attacks on Iran, a move seen to further escalate the middle east conflict. With limited key data out in the region and financial markets waiting for the Federal Reserve decision on rates, the path of least resistance was lower.
- The Hang Seng led China's bourses lower for a third straight day falling by -2.00%. The CSI 300 followed falling by -0.78%, Shanghai Comp was down -0.86% and Shenzhen fell -1.27%.
- The KOSPI has been a standout of late in delivering gains but this could not hold up today as slipped only marginally by -0.08%.
- The FTSE Malay KLCI fell -0.58% and is down over -1.5% in its last five trading days.
- The Jakarta Composite fell heavily by -1.3% following the Central Bank's decision yesterday.
- The FTSE Straits Times fell by -0.28% and the PSEi in the Philippines eked out minor gains of +0.18% ahead of the decision by the BSP on rates.
- The NIFTY 50 in India is barely in the positive in morning trade, up just +0.08%
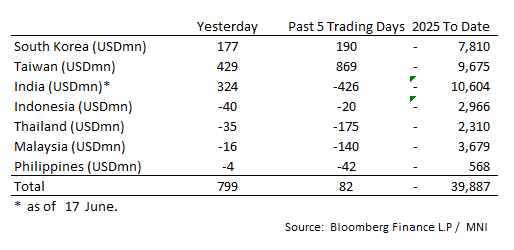
ASIA STOCKS: Inflows Resume for Major Markets
Large Inflows for Korea, Taiwan and India
- South Korea: Recorded inflows of +$177m yesterday, bringing the 5-day total to +$190m. 2025 to date flows are -$7,810. The 5-day average is +$38m, the 20-day average is +$183m and the 100-day average of -$77m.
- Taiwan: Had inflows of +$429m as of yesterday, with total inflows of +$869 m over the past 5 days. YTD flows are negative at -$9,675. The 5-day average is +$174m, the 20-day average of +$86m and the 100-day average of -$75m.
- India: Had inflows of +$324m as of the 17th, with total outflows of -$426m over the past 5 days. YTD flows are negative -$10,604m. The 5-day average is -$85m, the 20-day average of -$16m and the 100-day average of -$71m.
- Indonesia: Had outflows of -$40m yesterday, with total outflows of -$20m over the prior five days. YTD flows are negative -$2,966m. The 5-day average is -$4m, the 20-day average +$1m and the 100-day average -$29m.
- Thailand: Recorded outflows of -$35m as of yesterday, with outflows totaling -$175m over the past 5 days. YTD flows are negative at -$2,310m. The 5-day average is -$35m, the 20-day average of -$28m and the 100-day average of -$21m.
- Malaysia: Recorded outflows of -$16m as of yesterday, totaling -$140m over the past 5 days. YTD flows are negative at -$3,679m. The 5-day average is -$27m, the 20-day average of -$29m and the 100-day average of -$23m.
- Philippines: Recorded outflows of -$4m yesterday, with net outflows of -$42m over the past 5 days. YTD flows are negative at -$568m. The 5-day average is -$8m, the 20-day average of -$17m the 100-day average of -$5m.
OIL: Crude Watching & Waiting Middle East Situation
Oil is little changed today continuing to hold onto gains made since Friday as the situation in the Middle East remains tense and uncertain. Currently the main impact on oil from the conflict is on shipping but concerns are heightened that supply could be more severely impacted if Israel strikes Iran’s main export hubs or if Iran blocks the Strait of Hormuz. Israel and Iran continue to strike each other’s territory.
- WTI is down slightly to $73.48/bbl after falling to $72.63 earlier, while Brent is 0.2% lower at $76.52/bbl off the intraday low of $75.67. The USD is slightly higher.
- Goldman Sachs is assuming that the geopolitical risk premium on Brent is around $10/bbl, according to Bloomberg, but expects it to fall to $60 in Q4 assuming no supply issues.
- US President Trump said on Wednesday that he has approved a plan but is still hoping that Tehran will agree to abandon its nuclear programme. However, supreme leader Khamenei said they would “never surrender” in response to Trump’s demand for an unconditional surrender. The market is nervously waiting to see if the US will act and in what capacity.
- In a Bloomberg interview, the President of the API said that he doesn’t expect Iran to impact the Strait of Hormuz but given its situation the waterway should be monitored.
- Later the SNB and BoE announce decisions. The ECB’s Lagarde, de Guindos and Buch speak. April euro area construction prints. The US is closed for a holiday.
GOLD: Higher Fed US Inflation Outlook Offsetting Middle East Risks
Gold has not benefited from the risk off move in equities from continued geopolitical uncertainty as the Fed signalled it is on hold for now and revised its inflation forecasts higher. Bullion has traded in a narrow range during today’s APAC session. It rose to a high of $3387.98/oz earlier, below initial resistance at $3451.3, but then trended lower to around $3370 remaining above initial support at $3344.8. It is currently up 0.1% to $3372.9. The USD index is also off its intraday peak to be up slightly.
- 50bp of easing by end 2025 is still in the Fed’s forecast. It wants to take more time to assess the impact of current uncertainties, particularly around trade, before deciding if it needs to change policy. The FOMC believes that tariffs will impact inflation as they are passed on through the chain but its concern is if it turns into an inflation problem.
- Silver is down 0.2% to $36.67 off the intraday low of $36.60. It reached $36.78 earlier remaining below initial resistance at $37.32. The bull wave remains in place after breaking above the bull trigger at $34.90 as the metal has also benefited from safe-haven flows. Initial support is at $34.18, 20-day EMA.
- Equities are generally weaker with the Hang Seng down 2.0% and S&P e-mini -0.2%. Oil prices are down slightly with WTI -0.1% to $73.42/bbl. Copper is 0.4% lower.
- Later the SNB and BoE announce decisions. The ECB’s Lagarde, de Guindos and Buch speak. April euro area construction prints. The US is closed for a holiday.
ASIA FX: USD/KRW Can't Sustain +1385 Levels, CNH Very Steady
In North East Asia FX, trends have been mixed. CNH has been very steady. USD/KRW spiked early before finding selling interest.. Spot USD/TWD has drifted a little higher. USD/HKD remains close to the top end of the peg band. Regional equity markets are notably weaker, although the Kospi is outperforming.
- USD/CNH has drifted a little lower, last near 7.1920, but has largely ignored broader USD trends, which have mostly been supported amid market risk off. The USD/CNY fixing continues to track lower, likely helping curb USD/CNH upside. The CSI 300 is off around 0.70% at this stage.
- Spot USD/KRW is firmer, but well off earlier highs (1386.4). We last tracked close to 1379, still down 0.40% in won terms for the session. South Korean equities are only down modestly so far today, suggesting underlying support amid stimulus/corporate reforms hopes onshore.
- Spot USD/TWD is a little higher, last close to 29.58. The Taiex is down around 1.6% at this stage, which may slow equity inflow momentum into local stocks. The CBC decision is due later, with no change expected. The current policy rate is 2%.
- USD/HKD spot is very close to 7.8500.
ASIA FX: THB & PHP Falter, MYR Outperforms
In South East Asia FX, the firm bias has been for USD gains. There has been an undercurrent of market risk aversion, with concerns around potential US strikes on Iran impacting sentiment (even if oil is relatively steady and US equity futures are only down a touch). SEA equity indices are mostly under pressure. There are also country specific factors which look to be in play for the likes of Thailand and the Philippines.
- USD/THB is up around 0.70% so far today, putting the pair back around the 32.80/85 region. This is through the 20-day EMA (near 32.71). Fresh onshore political turmoil, as the government's coalition shows signs of fracturing (see this BBG link), is weighing on baht. Local equities were off 2% at one stage, putting us close to intra-session lows from April this year. Upside targets for USD/THB are likely to be at 33.00.
- USD/PHP is up by a similar amount to USD/THB. We were last 57.30/35. Comments from BSP Governor Remolona around futile efforts to intervene in the FX market during periods of risk off, has likely given fresh ammunition for USD/PHP bulls. USD/PHP is now through all key EMA resistance points. Late March highs from this year around 57.75 could be eyed on the topside.
- USD/IDR has risen, up around 0.50%, last near 16380 for spot. Risk aversion is weighing on the IDR, although it has outperformed the likes of PHP and KRW over the past week, see the recent spike in oil prices.
- USD/MYR is firmer, but only up around 0.20% at this stage, last close to 4.2600. A strong FX reserve position and less terms of trade fallout from rising oil prices are likely aiding MYR.
UP TODAY (TIMES GMT/LOCAL)
| Date | GMT/Local | Impact | Country | Event |
| 19/06/2025 | 0730/0930 | *** | SNB PolicyRate | |
| 19/06/2025 | 0730/0930 | *** | SNB Interest Rate Decision | |
| 19/06/2025 | 0730/0930 | ECB's Lagarde On Economic and Financial Integration | ||
| 19/06/2025 | 0800/1000 | *** | Norges Bank Rate Decision | |
| 19/06/2025 | 0900/1100 | ** | Construction Production | |
| 19/06/2025 | 0945/1145 | ECB de Guindos On Eurozone Economic Outlook | ||
| 19/06/2025 | 1030/1230 | ECB Lagarde Keynote Speech At Economic Integration Conference | ||
| 19/06/2025 | 1100/1200 | *** | Bank Of England Interest Rate | |
| 19/06/2025 | 1100/0700 | *** | Turkey Benchmark Rate | |
| 19/06/2025 | 1100/1200 | *** | Bank Of England Interest Rate | |
| 19/06/2025 | - | ECB Cipollone At Eurogroup Meeting | ||
| 19/06/2025 | 1600/1800 | ECB Lagarde At Financi'Elles event | ||
| 20/06/2025 | 2301/0001 | ** | Gfk Monthly Consumer Confidence | |
| 20/06/2025 | 2330/0830 | *** | CPI | |
| 20/06/2025 | 0600/0700 | *** | Public Sector Finances | |
| 20/06/2025 | 0600/0700 | *** | Retail Sales | |
| 20/06/2025 | 0600/0800 | ** | PPI | |
| 20/06/2025 | 0645/0845 | ** | Manufacturing Sentiment | |
| 20/06/2025 | - | ECB de Guindos at ECOFIN Meeting | ||
| 20/06/2025 | 1230/0830 | * | Industrial Product and Raw Material Price Index | |
| 20/06/2025 | 1230/0830 | ** | WASDE Weekly Import/Export | |
| 20/06/2025 | 1230/0830 | ** | Philadelphia Fed Manufacturing Index | |
| 20/06/2025 | 1230/0830 | ** | Retail Trade |