MNI ASIA OPEN: Watching Tariff-Tied Pass-Through Inflation
EXECUTIVE SUMMARY
- MNI FED: Dot Plot: Higher Shift In Outer Years Notable
- MNI FED: Statement: A Little Less Uncertainty, But Still High
- MNI SECURITY: Little Change In Tone: Summary Of Trump Comments On Iran
- MNI US DATA: Housing Activity Showing Increasing Signs Of Deterioration
US
MNI FED: Statement: A Little Less Uncertainty, But Still High
There were only limited changes to June's FOMC statement versus May's (PDF link).
- The characterization of the unemployment rate is basically the same, now simply "remains low" instead of "has stabilized at a low levels in recent months". Also as expected, the Committee notes now that uncertainty about the economic outlook has "diminished but remains elevated", versus "increased further", suggesting reduced uncertainty vs the May meeting.
- The Statement also keeps "The Committee is attentive to the risks to both sides of its dual mandate" but removes the following "and judges that the risks of higher unemployment and higher inflation have risen."
- It's quite likely Chair Powell will characterize these changes as being mark-to-market and removing dated/redundant phrasing rather than reflective of a major change in view on economic conditions, but it will be interesting to hear how he describes the decision - it does sound as though the FOMC is less concerned than it was 6 weeks ago about recession risks for example.
MNI FED: Dot Plot: Higher Shift In Outer Years Notable
The shift in the dot distribution vs March was a predictably close call going into this meeting between 2 cuts (3.9%) and 1 (4.1%) being signalled by the Dots for end-2025. The new Dot Plot shows 9 participants saw 1 or zero cuts, while the remaining 10 eyeing 2 or 3 cuts won the day. However, 7 of 19 members now anticipate no rate cuts this year. We think that the 8 in the 2-cut median probably reflects the core of the Committee including Chair Powell (with Gov Waller probably even more dovish at 3 cuts), but this wasn't far from signalling a higher end-year rate.
- More surprising was the shift higher in outer years, though again this was a close call.
- 10 of 19 now see a cumulative 75bp or less of cuts between now and end-2026, versus just 6 who saw such little easing at the March meeting. That said, there's one member who sees even more cumulative cuts by end-2026 than they expected before, and the median was close to remaining steady at 3.4%.
- For end-2027, there is a clearer shift with 6 dots at 3.1% now appearing in the 3.4% row. 11 of 19 members now see rates at 3.4% or higher by end-2027, versus 8 prior. This median is usually just a little above the longer-run dot, and perhaps this upward shift is reflective of the economic projections' medians showing that the 2% inflation target won't be hit by end-2027.
- On that note, none of the longer-run dot projections were changed vs March's meeting, a modest surprise given some had seen the median itself shifting up at this meeting (it remains at 3.0%).

NEWS
MNI SECURITY: Little Change In Tone: Summary Of Trump Comments On Iran
US President Donald Trump, speaking to reporters about flagpoles he is having installed at the White House, has continued to send mixed signals on his pending decision to authorise or rule out US military action against Iran’s nuclear facilities. The primary takeaway is that Trump has maintained his 'strategic ambiguity'. Markets appear receptive to comments stating that Iran reached out, but Trump reiterated his primary goal that Iran cannot have a nuclear weapon, which cannot be easily achieved without a US strike or a complete Iranian surrender.
MNI THAILAND: Bhumjaithai Withdrawal From Coalition Leaves Gov't w/Narrow Majority
The conservative Bhumjaithai party has withdrawn from PM Paetongtarn Shinawatra's governing coalition after bitter arguments regarding a cabinet reshuffle and in the wake of leaked audio of a call between the PM and president of the Cambodian Senate (and effective national leader) Hun Sen. Thailand and Cambodia have experienced tensions along their border following the death of a Cambodian soldier in May. The phone call took place on 15 June, after which Hun Sen posted the entire 17 minute conversation on his Facebook page.
US TSYS
MNI US TSYS: Chairman Powell Presser Ongoing, Rates & Stocks Extend Lower
- Treasury futures and stocks are extending lows as Chairman Powell's press conference continues.
- Tsy Sep'25 10Y futures currently -3 at 110-24 vs. 110-22.5 overnight low.
- Initial support to watch lies at 109-28, the Jun 6 / 11 low. A breach of this level would be bearish and open the bear trigger at 109-12+, the May 22 low.
- Curves steeper, 2s10s +1.414 at 44.697, 5s30s +0.263 at 90.075.
- Cross asset: Stocks trading lower now (SPX eminis -7 at 6035.25), Gold slipping lower at 3376.30, Bbg US$ index rebounds: 1210.77 +1.70.
OVERNIGHT DATA
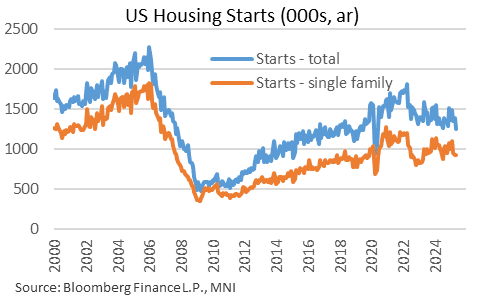
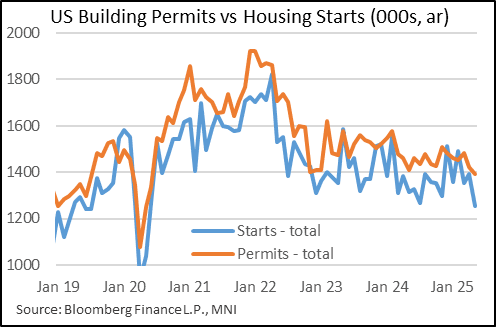
MNI US DATA: Housing Activity Showing Increasing Signs Of Deterioration
May's New Residential Construction report was very weak, portending very negative current conditions for residential investment activity, as well as a dim outlook for the quarters ahead. Housing starts fell to the lowest level since July 2019 (seasonally adjusted) excluding the sudden stop in 2020's pandemic, with a 9.8% M/M decline bringing the seasonally-adjusted annual rate of starts to 1,256k in May (vs 1,350k expected, 1,392k prior rev from 1,361k).
- Permits at 1,393k also disappointed vs expectations of a steady reading vs April at 1,422k and also hit the ex-pandemic lowest since July 2019.
- Weakness was seen across the board: single family permits fell 2.7% (4th fall in 5 months) to a 25-month low 898k, with multi-unit permits down 0.8% (7th fall in 9 months). Starts, which lag permits, saw single-family activity actually pick up slightly (0.4%, but only after falls in 3 of the prior 4 months) to 924k, but multi-units fall almost 30% to 332k.
- Starts are now down 4.6% Y/Y with permits down 1.0% Y/Y.
- New homes continue to sell, but combined with June's very poor NAHB survey - which tends to lead single-family starts/permits - the housing market is due to weaken significantly this year after 2024's residential investment bounce.
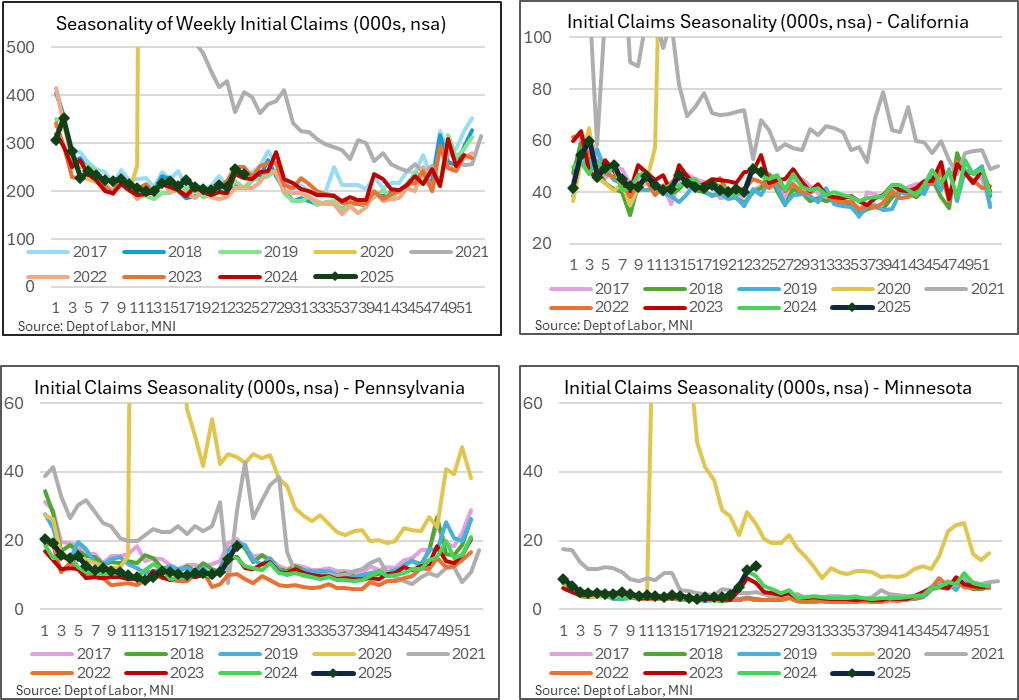
MNI US DATA: Recent Increases In NSA Jobless Claims Relatively Concentrated
The state-levels details of jobless claims data suggest recent increases in non-seasonally adjusted initial claims has been driven by increases in a relatively narrow range of states although a lack of improvement ahead would be notable.
- Adding to the above on jobless claims data, the seasonally adjusted initial claims figures have started to push higher with their highest four-week moving average since Aug 2023.
- The non-seasonally adjusted level of initial claims mostly support this, lifting a little in the past two weeks compared to non-pandemic years although as top left chart shows it’s not wildly different to readings from 2023 and 2024 for the same time of year.
- Of the increase that we have seen, with NSA initial claims rising a cumulative 27k in the latest two weeks, 7.5k has come from California (largest state, similar to 2024 but otherwise elevated) whilst more notable increases for their size have come from Minnesota (+5.9k) and Pennsylvania (+7.7k).
- These latter two are somewhat linked to seasonal norms, but would start to be more notable if they don’t roll over shortly, especially Minnesota.
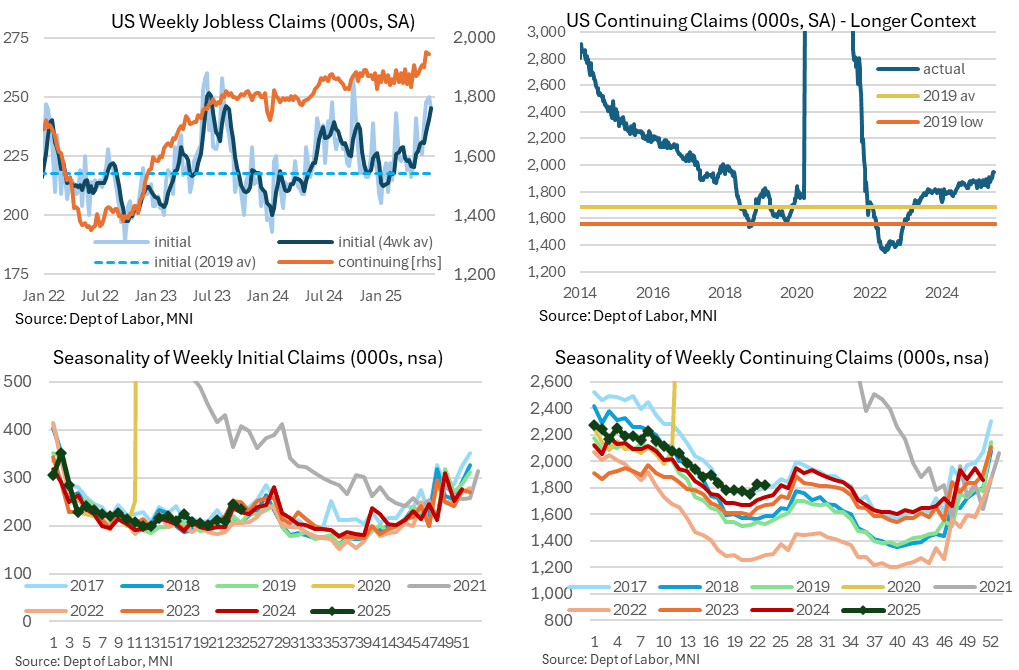
MNI US DATA: Upward Trend In Jobless Claims Confirmed
The weekly jobless claims data confirmed recent deterioration in the labor market. There was a sizeable step higher in initial claims compared to recent payrolls reference periods along with the highest four-week moving average since Aug 2023, whilst continuing claims hovered close to the previous week's fresh high since late 2021.
- Initial jobless claims were as expected at 245k (sa, cons 245k) in the week to Jun 14 – a payrolls reference period – after a slightly upward revised 250k (initial 248k).
- This can still be revised next week but for now it points to a clear step higher from reference payroll periods (226k for May, 216k for Apr, 225k for Mar and 224k for Feb).
- The four-week moving average increased to 246k from a marginally upward revised 241k (initial 240k) for its highest since Aug 2023.
- Continuing claims were a touch higher than expected at 1945k (sa, cons 1941k) in the week to Jun 7 after a slightly downward revised 1951k (initial 1956k).
- It rules out a larger downward revision from what had been a firm uptick in continuing claims in the prior week for a fresh high since late 2021, with only a marginal improvement seen in latest data.
- The claims rate saw a second week at 1.28% after two weeks at 1.25%. Increases from what had been sustained 1.2% readings has drawn some attention in recent weeks.
MNI US DATA: Mortgage Spreads Retrace Half Of Tariff-Driven Widening
- MBA composite mortgage applications fell -2.6% (sa) last week for only a modest pullback from a strong 12.5% increase the week prior. The lack of reaction to a 9bp decline in the 30Y conforming mortgage rate wasn’t too surprising considering the outsized strength of that prior increase on a 1bp increase previously.
- New purchase applications led the decline (-3.0% after 10.3%) although refis saw a broadly similar pattern (-2.1% after 15.6%).
MARKETS SNAPSHOT
Key market levels of markets in late NY trade:
DJIA down 37.39 points (-0.09%) at 42175.54
S&P E-Mini Future down 0 points (0%) at 6036.75
Nasdaq up 33.3 points (0.2%) at 19550.76
US 10-Yr yield is down 0.2 bps at 4.3869%
US Sep 10-Yr futures are steady at at 110-27 at 110-27
EURUSD down 0.0011 (-0.1%) at 1.1468
USDJPY down 0.13 (-0.09%) at 145.16
WTI Crude Oil (front-month) up $0.03 (0.04%) at $74.87
Gold is down $21.34 (-0.63%) at $3366.96
European bourses closing levels:
EuroStoxx 50 down 21.77 points (-0.41%) at 5266.91
FTSE 100 up 9.44 points (0.11%) at 8843.47
German DAX down 116.84 points (-0.5%) at 23317.81
French CAC 40 down 27.61 points (-0.36%) at 7656.12
US TREASURY FUTURES CLOSE
3M10Y -2.163, 4.714 (L: -0.729 / H: 7.895)
2Y10Y +1.48, 44.763 (L: 41.804 / H: 45.935)
2Y30Y +1.368, 94.837 (L: 91.7 / H: 97.403)
5Y30Y +0.577, 90.389 (L: 88.916 / H: 93.03)
Current futures levels:
Sep 2-Yr futures up 0.875/32 at 103-21 (L: 103-19.25/ H: 103-24.5)
Sep 5-Yr futures up 0.75/32 at 108-4.75 (L: 108-01.5 / H: 108-13.5)
Sep 10-Yr futures steady at 110-27 (L: 110-22.5 / H: 111-08)
Sep 30-Yr futures steady at 113-21 (L: 113-10 / H: 114-09)
Sep Ultra futures steady at 116-29 (L: 116-13 / H: 117-21)
MNI US 10YR FUTURE TECHS: (U5) Resistance Is Intact For Now
- RES 4: 111-30 76.4% retracement of the May 1 - 22 downleg
- RES 3: 111-21 1.0% 10-dma envelope
- RES 2: 111-14+ High Jun 5 & 61.8% of the May 1 - 22 downleg
- RES 1: 111-13 High Jun 13
- PRICE: 111-03+ @ 1135 ET Jun 18
- SUP 1: 110-10+/109-28 Low Jun 16 / Low Jun 6 / 11
- SUP 2: 109-12+ Low May 22 and the bear trigger
- SUP 3: 109-09+ Low Apr 11 and key support
- SUP 4: 108-25+ 0.764 proj of the Apr 7 - 11 - May 1 price swing
Key resistance in Treasury futures at 111-14+, a Fibonacci retracement and the Jun 5 high, remains intact for now. Clearance of this hurdle would be bullish and highlight a stronger reversal. This would open 111-30, a Fibonacci retracement. On the downside, initial support to watch lies at 109-28, the Jun 6 / 11 low. A breach of this level would be bearish and open the bear trigger at 109-12+, the May 22 low.
SOFR FUTURES CLOSE
Sep 25 +0.020 at 95.870
Dec 25 +0.035 at 96.125
Mar 26 +0.025 at 96.340
Jun 26 +0.015 at 96.545
Red Pack (Sep 26-Jun 27) +0.010 to +0.015
Green Pack (Sep 27-Jun 28) +0.005 to +0.010
Blue Pack (Sep 28-Jun 29) +0.005 to +0.010
Gold Pack (Sep 29-Jun 30) +0.005 to +0.010
REFERENCE RATES (PRIOR SESSION)
US TSYS: Repo Reference Rates
- Secured Overnight Financing Rate (SOFR): 4.31% (-0.01), volume: $2.692T
- Broad General Collateral Rate (BGCR): 4.29% (-0.01), volume: $1.087T
- Tri-Party General Collateral Rate (TCR): 4.29% (-0.01), volume: $1.063T
- (rate, volume levels reflect prior session)
STIR: FRBNY EFFR for prior session:
- Daily Effective Fed Funds Rate: 4.33% (+0.00), volume: $104B
- Daily Overnight Bank Funding Rate: 4.33% (+0.00), volume: $285B
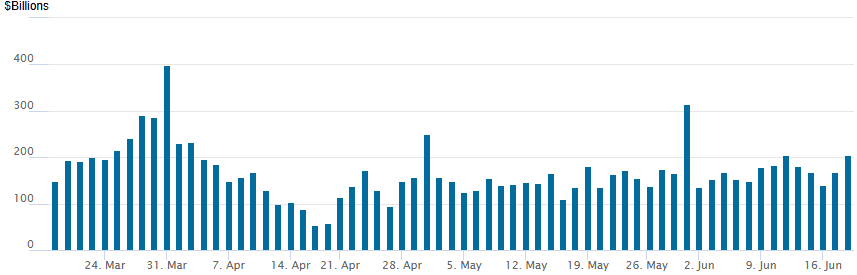
FED Reverse Repo Operation
RRP usage climbs to $205.050B this afternoon from $168.939B yesterday, total number of counterparties at 40. Usage had fallen to $54.772B on Wednesday, April 16 -- lowest level since April 2021. Conversely, usage had surged to the highest level since December 31, 2024 on Monday, March 31: $399.167B.
PIPELINE
- Date $MM Issuer (Priced *, Launch #)
- 06/18 No new issuance Wednesday, sidelined ahead FOMC annc
- $18.767B To price Tuesday, $32.717B/wk
MNI BONDS: EGBs-GILTS CASH CLOSE: UK Curve Bull Flattens Ahead Of BOE
Curves bull flattened Wednesday, with Gilts modestly outperforming Bunds ahead of Thursday's BOE decision announcement.
- Early trade saw some bull steepening led by Gilts after UK CPI data looked in line with expectations.
- There was a broad rally across core FI for almost the entire remainder of the session however, with the long end leading gains.
- The main triggers were weak-leaning US data (jobless claims and residential construction), with lower oil prices as US President Trump seemingly views a near-term resolution on the Iran-Israel conflict.
- The German and UK curves both bull steepened on the day. Periphery/semi-core EGB spreads were little changed.
- Overnight focus will be on the US Federal Reserve, but the BOE takes centre-stage Thursday - MNI's preview is here.
- It would be a surprise to markets if the outcome is anything other than an on hold decision with unchanged official guidance. Expectations are relatively strongly pointing towards a 7-2 vote split for a hold/cut respectively.
Closing Yields / 10-Yr EGB Spreads To Germany
- Germany: The 2-Yr yield is down 2.6bps at 1.842%, 5-Yr is down 3.8bps at 2.103%, 10-Yr is down 3.8bps at 2.497%, and 30-Yr is down 4.1bps at 2.944%.
- UK: The 2-Yr yield is down 3.5bps at 3.888%, 5-Yr is down 4.7bps at 4.006%, 10-Yr is down 5.5bps at 4.495%, and 30-Yr is down 5.4bps at 5.229%.
- Italian BTP spread down 0.2bps at 95bps / French OAT unchanged at 71.5bps
MNI FOREX: Greenback Reverses Higher as Powell Downplays Economic Concerns
- The US dollar spent much of the pre-Fed session trading with a moderate downward bias as President Trump hinted at potential talks with Iran, which fleetingly boosted risk sentiment. On the FOMC release, this greenback weakness extended as the Fed confirmed the median dot for 2025 year-end rates as steady in predicting two further cuts this year.
- USDJPY traded down to a low of 144.34 on the release, while EURUSD tried to consolidate gains back above 1.15.
- However, higher median Fed dots for 2026 and 2027 and a relatively optimistic view of economic activity and the labour market prompted a sharp dollar reversal higher through Chair Powell’s press conference, with the USD index rallying to fresh session highs.
- Once again, USDJPY was in focus here as the pair rose back above 145.00, narrowing the gap to the overnight highs and initial resistance around 145.45. Further out, key short-term resistance is 146.28, the May 29 high.
- Both the EUR and GBP were laggards amid the dollar reversal, both notable underperformers across G10. For GBPUSD, we have printed fresh pullback lows as the move extends below 1.3415, placing greater attention on the next important support, which lies at 1.3350, the 50-day EMA.
- Thursday remains busy on the central bank front, with the SNB kicking off the calendar. This will be followed by decisions from the Norges Bank and the BOE. In terms of data, New Zealand GDP and Australian employment figures are scheduled.
THURSDAY DATA CALENDAR
| Date | GMT/Local | Impact | Country | Event |
| 19/06/2025 | 0730/0930 | *** | SNB PolicyRate | |
| 19/06/2025 | 0730/0930 | *** | SNB Interest Rate Decision | |
| 19/06/2025 | 0730/0930 | ECB's Lagarde On Economic and Financial Integration | ||
| 19/06/2025 | 0800/1000 | *** | Norges Bank Rate Decision | |
| 19/06/2025 | 0900/1100 | ** | Construction Production | |
| 19/06/2025 | 0945/1145 | ECB de Guindos On Eurozone Economic Outlook | ||
| 19/06/2025 | 1030/1230 | ECB Lagarde Keynote Speech At Economic Integration Conference | ||
| 19/06/2025 | 1100/1200 | *** | Bank Of England Interest Rate | |
| 19/06/2025 | 1100/0700 | *** | Turkey Benchmark Rate | |
| 19/06/2025 | 1100/1200 | *** | Bank Of England Interest Rate | |
| 19/06/2025 | - | ECB Cipollone At Eurogroup Meeting | ||
| 19/06/2025 | 1600/1800 | ECB Lagarde At Financi'Elles event | ||
| 20/06/2025 | 2301/0001 | ** | Gfk Monthly Consumer Confidence | |
| 20/06/2025 | 2330/0830 | *** | CPI |