BUND TECHS: (Z5) Monitoring Support At The 50-Day EMA
- RES 4: 130.80 High Jun 13 and key resistance
- RES 3: 130.63 1.500 proj of the Sep 3 - 10 - 25 price swing
- RES 2: 130.07/59 High Oct 24 / 17 and the bull trigger
- RES 1: 129.73 High Oct 28
- PRICE: 129.29 @ 05:54 GMT Oct 30
- SUP 1: 129.21 Low Oct 28
- SUP 2: 129.11 50-day EMA
- SUP 3: 128.52 76.4% retracement of the Sep 25 - Oct 17 Bull leg
- SUP 4: 128.25 Low Oct 7
A short-term bear cycle in Bund futures remains intact for now. The move down that started on Oct 17 is considered corrective and this has allowed an overbought trend condition to unwind. The next important support to watch lies at the 50-day EMA, currently at 129.11. A clear break would signal scope for a deeper retracement. A reversal would refocus attention on the key resistance at 130.59, the Oct 17 high. First resistance is 129.73, Oct 28 high.
Want to read more?
Find more articles and bullets on these widgets:
Historical bullets
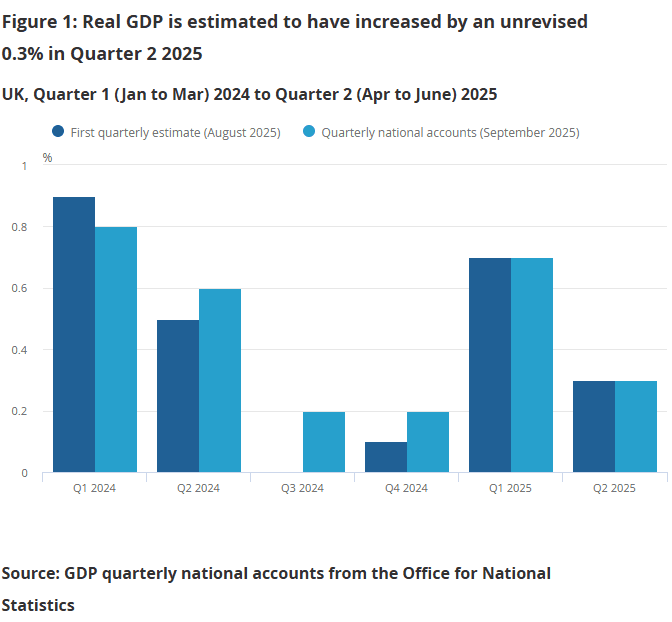
UK DATA: GDP Final Print Shows Only Minor Revisions
- Q2 and Q1 GDP both unrevised.
- 2024 annual GDP is unrevised at 1.1% but there have been downward revisions to H2-23 GDP and Q1-24 and upside revisions to Q2-24, Q3-24 and Q4-24.
- "The level of GDP in Quarter 2 2025 compared with Quarter 4 (Oct to Dec) 2023 is now estimated to be 2.9% higher, revised up from the first estimate of 2.6%." ONS
- This includes the Blue Book new methodology and corrections for retail sales (and likely for PPI too). It will be reflected in the next monthly series' release.
- Additionally, it will be used by the OBR for its Budget forecasts, so there is more focus than usual on a final print - but as it came in line with expectations there is no notable market movements here.
GILT TECHS: (Z5) Bearish Structure
- RES 4: 92.30 High Aug 7
- RES 3: 92.06 High Aug 14
- RES 2: 92.00 Round number resistance
- RES 1: 91.28/82 High Sep 24 / 11
- PRICE: 90.89 @ Close Sep 29
- SUP 1: 90.26/89.94 Low Sep 26 / 76.4% of the Sep 3 - 11 correction
- SUP 2: 90.31/89.36 Low Sep 4 / 3
- SUP 3: 89.36 Low Sep 3
- SUP 4: 89.22 1.618 proj of the Aug 21 - 27 - 28 price swing
Gilt futures have recovered from their latest lows. The move down last week strengthens a bearish theme and does suggest the end of the recent corrective phase between Sep 3 - 11. Note that on the continuation chart, moving average studies are in a bear-mode position, highlighting a dominant downtrend. A resumption of weakness would open 89.94, a Fibonacci retracement. Initial resistance to watch is 91.28, the Sep 24 high.
USDJPY TECHS: Trading Above Support
- RES 4: 151.62 61.8% retracement of the Jan 10 - Apr 22 bear leg
- RES 3: 151.21 High Mar 28
- RES 2: 150.92 High Aug 1 and a key resistance
- RES 1: 149.96 High Sep 26 and the bull trigger
- PRICE: 148.27 @ 07:01 BST Sep 30
- SUP 1: 148.08/147.59 20- and 50-day EMA values
- SUP 2: 146.77 Low Sep 18
- SUP 3: 145.49 Low Sep 17 and a pivot support
- SUP 4: 144.23 Low Jul 7
USDJPY has pulled back from last week’s high print. The move down - for now - appears corrective. Moving average studies are in a bull-mode position, highlighting a dominant uptrend. Support to watch lies at 147.59, the 50-day EMA. Pivot support has been defined at 145.49, the Sep 17 low. A resumption of gains would signal scope for a climb towards key resistance at 150.92, the Aug 1 high.