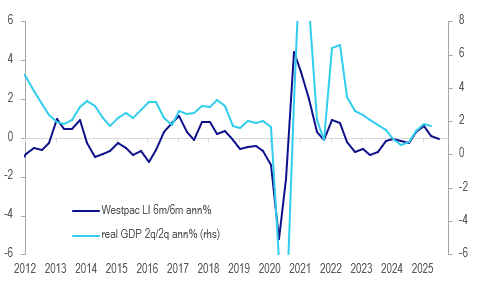
AUSTRALIA DATA: Westpac Lead Indicator Signals Around Trend Growth
The Westpac lead index fell 0.03% m/m in September bringing the 6-month annualised rate to +0.04% from -0.16%. It has oscillated around zero over the last 5 months. This measure leads detrended growth by 3 to 9 months and signals that growth may slow in H2 but be around trend early in 2026. Westpac is forecasting 2% growth in 2025 with it improving in 2026.
- Westpac forecast a 25bp rate cut at the November meeting but now believes that while the next move in rates is down, the upcoming decision will rely on Q3 CPI on 29 October. It notes though that its lead indicator signals GDP growth remains lacklustre.
- The indicator was stronger in H1 this year with the H2 moderation driven by dwelling approvals and AUD commodity prices. Westpac expects both of these components to turn with the latter already higher driven by gold and lower rates and policy likely to boost housing supply.
- Equity prices have been positive for the lead indicator over the last 6 months.
Australia Westpac lead indicator vs GDP %
Want to read more?
Find more articles and bullets on these widgets:
Historical bullets
USD: BBDXY - USD Remains Stubborn, Can It Break Down Before FOMC ?
The BBDXY range overnight was 1197.09 - 1201.11, Asia is currently trading around 1198, +0.02%. The USD could not follow through on Friday and remains frustratingly above its recent support. A sustained break below 1197/1195 is needed to regain the momentum lower and retest the year's lows towards 1180 where demand should return initially. A break sub 1180 would be extremely bearish, should the USD start another leg lower it would have big implications for FX and potentially see a lot of the recent ranges in G10 broken. With the FOMC approaching we might see the ranges continue until the market hears what Powell has to say about the potential new rate cutting cycle the market is pricing in.
- MNI INTERVIEW: Powell Won't Signal String Of Fed Cuts-Lockhart. Federal Reserve Chair Jerome Powell will justify next week’s widely expected interest rate cut by citing rising downside risks to employment but refrain from signaling a string of cuts beyond September because the Fed must also contend with inflation heading in the wrong direction, former Atlanta Fed President Dennis Lockhart told MNI.
- Bloomberg - “Dollar Downturn to Keep FX Carry Trades Beating Equity Returns. The dollar’s weakness is delivering a stunning year for currency carry trades, and it could be about to get even better. The top 10 currency trades against the dollar have returned just over 20% on average, nearly twice the year-to-date gains on the S&P 500 and topping the Nasdaq 100 by a third.”
- RenMac on X: “Fed Should Go 50… But Likely Won’t – Neil Dutta”
- Bloomberg - “The dollar edged higher in New York trading, paring its weekly loss, as investors expect next week’s Federal Reserve meeting will offer clues to how much the central bank will cut interest rates in the months ahead.”
- Data/Events : Empire Manufacturing
Fig 1: BBDXY Daily Chart
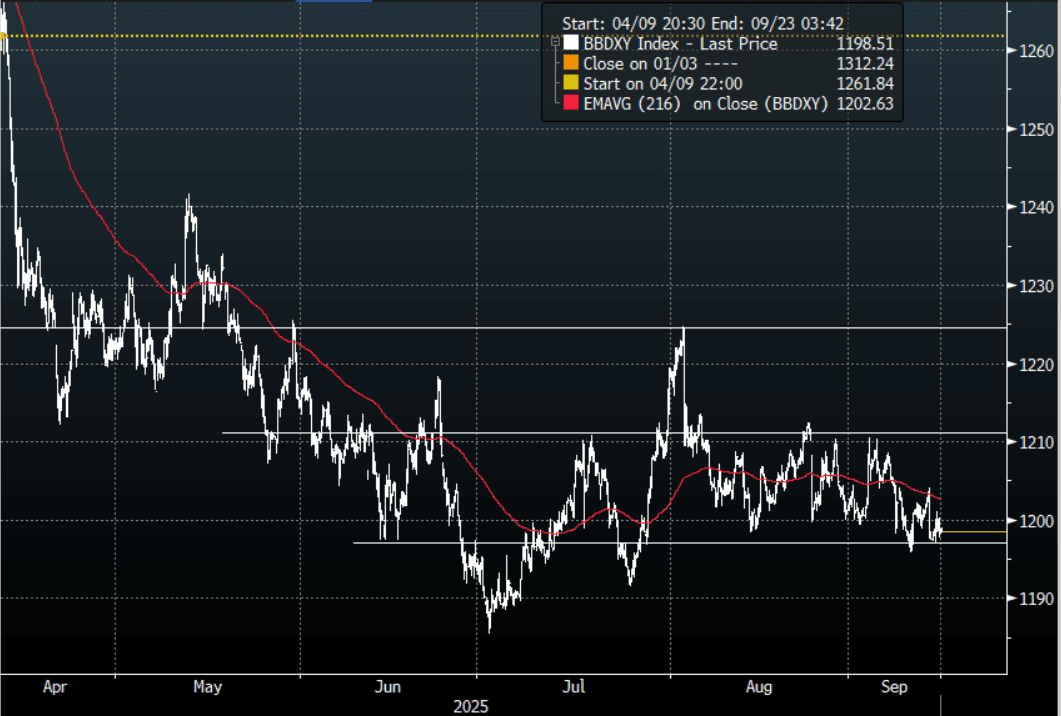
Source: MNI - Market News/Bloomberg Finance L.P
AUSSIE BONDS: Weaker & At Cheaps, No Cash US Tsys In Asia-Pac Session
ACGBs (YM -3.0 & XM -6.0) are weaker and at/near session lows on a relatively subdued session.
- There is no cash US tsy trading today with Japan out. TYZ5 is moderately cheaper.
- Cash ACGBs are 3-6bps cheaper with the 3/10 curve steeper.
- The bills strip is flat to -4 across contracts with a steepening bias.
- RBA-dated OIS pricing is little changed across meetings today. A 25bp rate cut in September is given a 9% probability, with a cumulative 28bps of easing priced by year-end (based on an effective cash rate of 3.59%).
- Today, the local calendar will be empty ahead of an RBA Hunter's Fire-Side Chat tomorrow.
- The focus this week will be on Thursday’s August jobs data. Employment is forecast to rise 21k after July’s +24.5k with the unemployment rate expected to remain at 4.2%. It will also be important to monitor underemployment, the split between full-time & part-time and hours worked. The RBA is currently expected to leave rates unchanged on September 30 as it waits for Q3 CPI on October 29.
- This week, the AOFM plans to sell A$1200mn of the 4.25% 21 December 2035 bond on Wednesday and A$1000mn of the 1.00% 21 December 2030 bond on Friday.
FOREX: AUD Crosses - Consolidate Recent Gains
US Equities traded sideways as the market turned its focus towards the FOMC this week and what the potential upcoming cutting cycle could look like. This morning US futures have had a muted open, E-minis +0.03%, NQU5 -0.01%. The AUD consolidated its most recent gains on Friday night. The AUD/USD is also trying to break higher through the top of its recent range as price action is starting to turn constructive across the board for the AUD.
- EUR/AUD - Friday night range 1.7614 - 1.7664, Asia is currently trading around 1.7630. The pair has found some demand initially back towards its support around 1.7600. Momentum higher seems to have now stalled and a break back below 1.7600 would potentially signal a deeper correction back to the support between 1.7300/1.7400. Expect sellers to return on a bounce back towards the 1.7800 area.
- GBP/AUD - Friday night range 2.0353 - 2.0428, Asia is trading around 2.0380. The pair is trying to break below the lower band of the range which has held since March. The price action of the pair is looking potentially exhaustive and sustained break sub 2.03/2.04 would open up a deeper pullback towards 1.9800/2.0000. I expect rallies back to 2.0550/0650 to now be met with supply initially.
- AUD/JPY - Friday night range 98.05 - 98.52, Asia is trading around 98.15. The pair consolidated its gains on Friday night, turning the focus back towards the 99.00/100.00 area. Dips back towards 96.50/97.00 should be expected to be supported now first up.
- AUD/NZD - Overnight range 1.1152 - 1.1170, the cross is dealing in Asia around 1.1170. The Cross is consolidating above 1.1100, dips back towards 1.1000/1.1050 should be supported now. A break above the multiple highs towards the 1.1200 area is needed to regain the momentum higher.
Fig 1: GBP/AUD spot 2H Chart
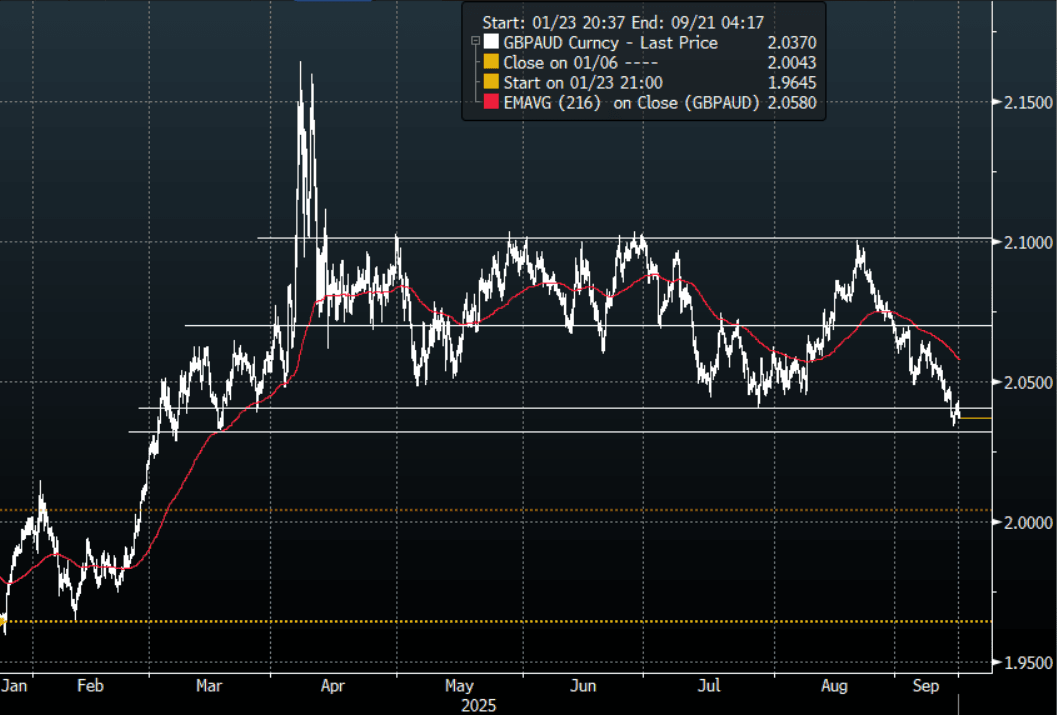
Source: MNI - Market News/Bloomberg Finance L.P