EUROZONE T-BILL ISSUANCE: W/C December 22
Dec-19 14:48
Greece will look to sell E400mln of the new 26-week Jun 26, 2026 GTB at its auction next Tuesday. Total issuance will be below this week's E7.8bln, where only France sold bills.
That auction will conclude Eurozone T-bill issuance for the year.
Want to read more?
Find more articles and bullets on these widgets:
Historical bullets
EQUITY TECHS: E-MINI S&P: (Z5) Bearish Outlook
Nov-19 14:42
- RES 4: 6993.12 3.500 proj of the Aug 20 - 28 - Sep 2 price swing
- RES 3: 6953.75 High Oct 30 and bull trigger
- RES 2: 6900.50 High Nov 12
- RES 1: 6779.00 20-day EMA
- PRICE: 6640.50 @ 14:31 GMT Nov 19
- SUP 1: 6594.00 Low Nov 18
- SUP 2: 6571.25 Low Oct 17
- SUP 3: 6540.25 Low Oct 10 and a key support
- SUP 4: 6476.62 23.6% retracement of the Apr 7 - Oct 30 uptrend
S&P E-Minis maintain a softer short-term tone. The breach of support at 6655.70, the Nov 7 low cancels recent bullish signals and signals scope for an extension of the current corrective cycle. Note that price has also breached support at the 50-day EMA. An extension would open 6540.25, the Oct 10 low and the next key support. Initial firm resistance to watch is 6779.00, the 20-day EMA.
US DATA: Gold Imports Drove Summer Swing, Computer Surge Continued [2/2]
Nov-19 14:37
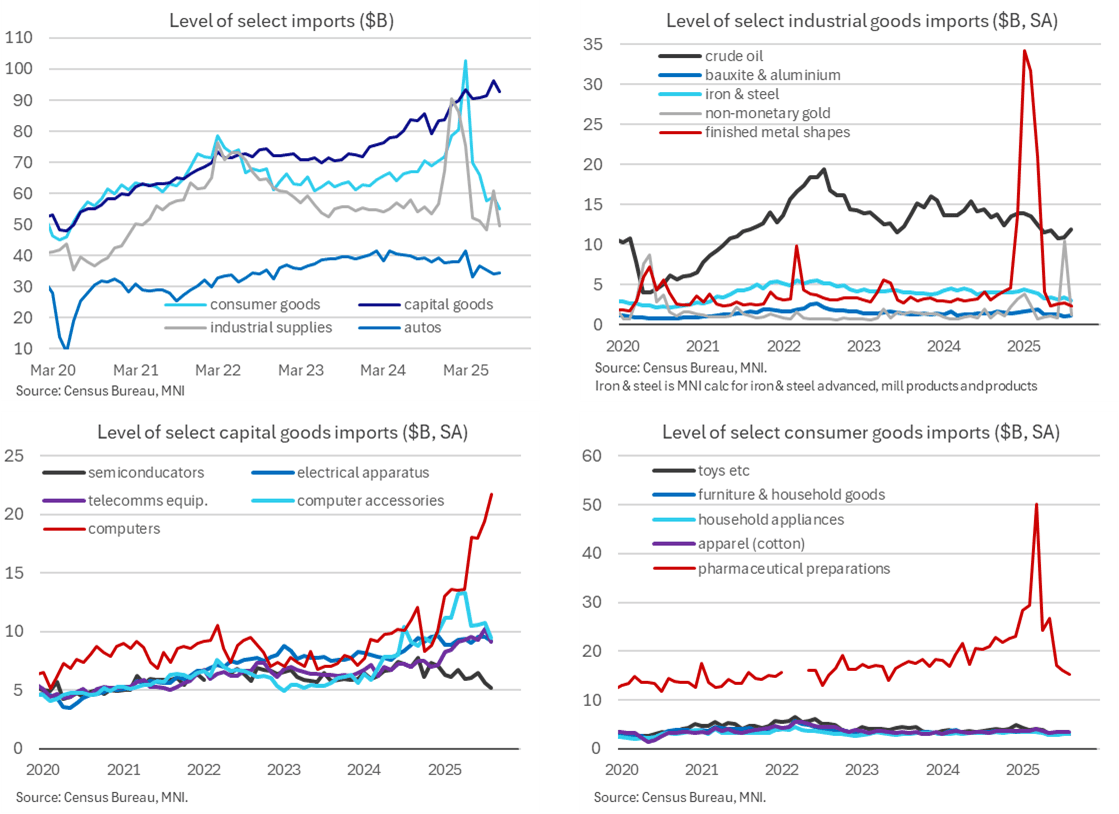
- Today’s details give us a better sense of the drivers behind what we had already known to have been broad-based weakness in imports, with consumer -7.0% M/M after 2.4%, capital -4.4% after 5.1% and industrial supplies -19.6% after 24.3%.
- The swing in industrial supplies was dominated by a pullback in non-monetary gold imports after a surprise jump in July (from $0.9bn in Jun to $10.5bn in Jul and now $1.2bn in Aug).
- This category had picked up earlier this year on tariff front-running with a high of $3.8bn in January but it was tiny compared to the surge in monetary gold which drove the “finished metal shapes” category to $34bn in Jan vs a more typical $3-4bn per month and a latest value of $2.4bn in August. Recall that monetary gold doesn’t feed into GDP calculations (but the non-monetary gold category noted above, does) and now sees the Atlanta Fed’s GDPNow run on an ex-gold basis, for example.
- Capital goods imports fully reversed July’s large increase, falling back from $90.6bn to $86.6bn, despite a further cranking higher in computer imports to $21.7bn (+2.3bn). That’s up from $10bn in December. Nearly all other categories fell on the month, with the largest coming from computer accessories (-1.3bn), telecommunications equipment (-1.1bn), medical equipment (-0.4bn) and semiconductors (-0.4bn).
- Consumer goods imports meanwhile continued their downtrend into August compared to some particularly elevated readings earlier this year on Irish pharmaceutical front-running. Latest Eurozone trade data for September suggests this reversed with a sharp increase. For now, the $55bn in August was the lowest nominal level of consumer goods since mid-2020. This category saw $72bn of imports in Dec 2024 before surging to a peak of $103bn in March ahead of telegraphed reciprocal tariff announcements in early April.
US DATA: China And EU Leading Largest Adjustments In Trade With US [1/2]
Nov-19 14:37
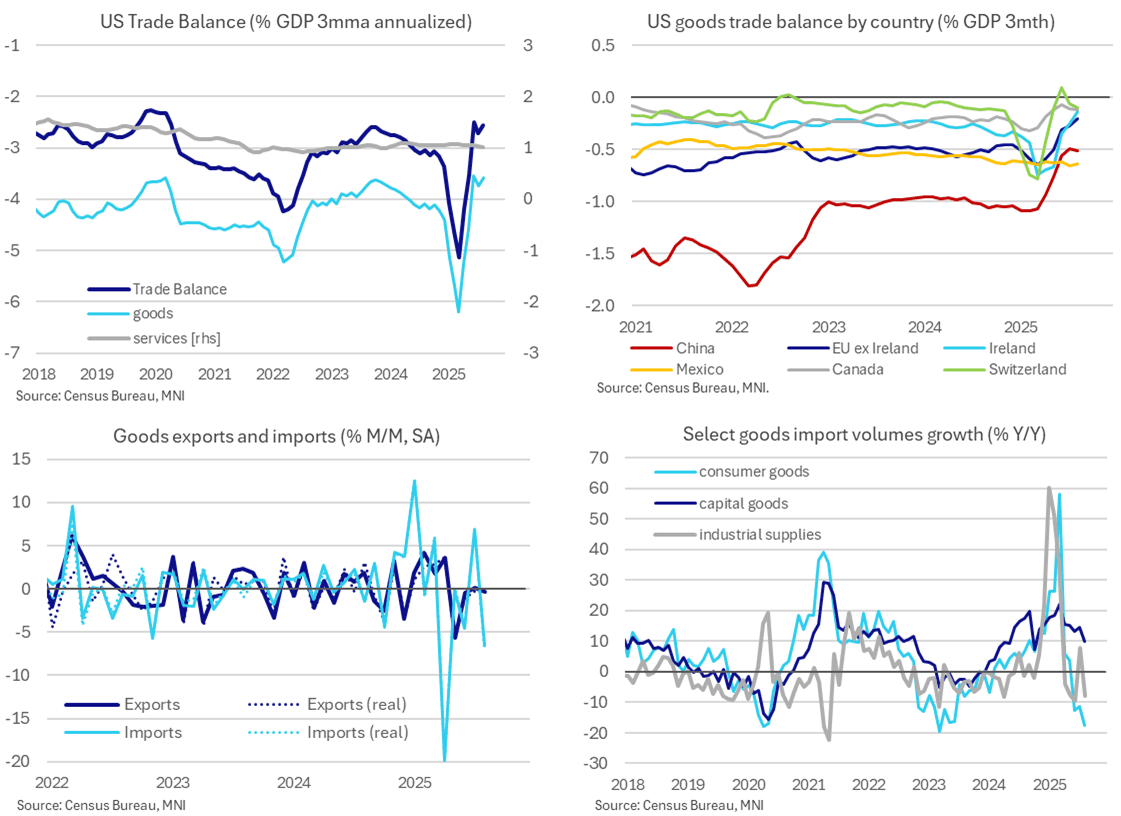
- The goods & services trade deficit was close to expectations in August at $59.6bn (cons $60.4bn) after a marginally revised $78.2bn in July.
- This is the full August release that was delayed by the government shutdown, after the initial advance covering just goods trade had been reported on Sep 25.
- Exports increased 0.1% M/M, with reasonable services growth of 0.8% M/M offsetting softer goods at -0.3% M/M as broadly indicated by the advance release.
- Imports were confirmed to have fallen firmly, with -5.1% M/M after bouncing 5.9% M/M in July, driven primarily by goods (-6.6% after 6.9%) whilst services increased a little further (0.4% after 2.3%). The swing in imports was due to monetary gold – to be discussed in part two.
- The $264.6bn of goods imports poked below the $264.9bn in June for its lowest since Jan 2024 – of note for a nominal series – although the subsequent uplift in services imports saw broader goods & services imports hold above its June recent low.
- Driving these trends, goods imports volumes are currently -4.0% Y/Y for their most negative since mid-2023. Consumer goods have clearly been adversely impacted by tariffs (-18% Y/Y) along with industrial supplies more recently (-8% Y/Y). Capital goods (10% Y/Y) continues to be an important offsetting driver, having been growing strongly since mid-2024 and with 10% Y/Y actually its softest since October.
- It left the goods & services trade deficit at 2.6% GDP on a three-month basis in August vs 5.1% GDP in Q1 on peak tariff front-running and 3.4% GDP in Q4.
- Latest updates on country trade balances vs Dec’24 levels: China -0.6% GDP vs -1.1%, EU -0.4% vs -0.8%, Switz. -0.1% vs -0.3% and then less change for Canada at -0.1% vs -0.2%, UK 0.1% vs 0.0% and Mexico -0.6% vs -0.6%.