AUSTRALIA: Some Indicators Signal Stabilisation In Labour Market Easing
The RBA eased its language regarding the labour market in its August meeting statement with conditions now “a little tight”. In July, Governor Bullock spoke about the bank’s dual mandate which includes full employment and showed some of the other jobs-related data that it follows. They show that the labour market has eased from the 2022-23 heights but may now be stabilising with some indicators still tighter than average.
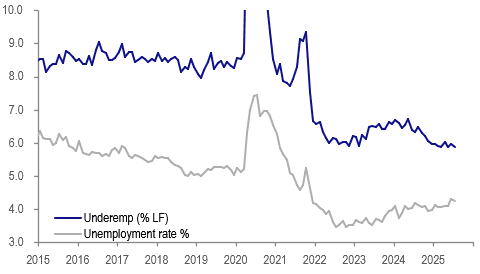
- One indicator that hasn’t shown an easing in the labour market is the underemployment rate which in July fell 0.1pp to 5.9% and has been just under the 2022 low on average this year. A pick up in underemployment would signal a weakening in labour demand resulting in people not working as much as they’d like.
Australia underutilisation %
- Growth in hours worked has eased and was up 2.1% y/y in July down from January’s 3.6% but momentum in full-time hours is recovering suggesting solid labour demand. It is easier for firms to adjust hours than change headcount and so the trend could reflect current elevated uncertainty.
- Bullock noted that the “quit rate” had returned to around pre-pandemic rates, also a sign of labour market easing. It tentatively appears to have stabilised around this level.
- The NAB business survey measure of labour shortages remains above the series average but continued to moderate over H1 2025.
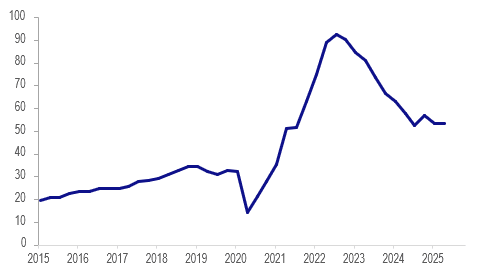
- Vacancies-to-unemployment appears to have troughed in Q3 2024 and has been moving sideways since. It is down almost 40pp since its 2022 high of around 92% but remains about 15pp above the historical average.
Australia vacancies/unemployment %
Want to read more?
Find more articles and bullets on these widgets:
Historical bullets
US TSYS: Asia Wrap - Quiet Session Looking Toward CPI
The TYU5 range has been 110-20+ to 110-25 during the Asia-Pacific session. It last changed hands at 110-23, down 0-01 from the previous close.
- The US 2-year yield is trading around 3.898%.
- The US 10-year yield is trading around 4.433%.
- The 10-year yield is again testing the 4.40/45% pivot within its wider 4.10% - 4.65% range. The market is clearly worried about inflation and the CPI this week will be a critical input into the market's thinking. A sustained close back above the 4.45% area could see more longs pared back, above here and the focus will turn back to the 4.65% area.
- Lance Roberts(RIA) - “Tuesday’s CPI and Wednesday’s PPI reports will be very helpful in appreciating how tariffs are impacting inflation. Thus far, there has been a negligible effect. However, the June reports will fully capture a period when the tariffs were being enforced. If data continues to be on the weak side, we suspect the Fed will become more dovish. However, higher-than-expected inflation data may allow them to continue to postpone rate cuts.”
- MNI US OUTLOOK/OPINION: Analysts See Core CPI On Cusp Of 0.2% or 0.3% M/M In June. Ahead of tomorrow’s US CPI release, we note that the broad Bloomberg consensus looks for both core and headline CPI inflation at 0.3% M/M in June although unrounded estimates suggest a risk of rounding lower.
JAPAN: 30yr JGB Yield Correlation With Other G7 Yields Elevated
Fiscal spending concerns are not just present in Japan, but in much of the G7 markets. Pressure points come from the recently passed US tax bill, whilst the UK government is grappling with how to balance spending priorities amid revenue constraints. Germany is also moving away from fiscal restraint, whilst broader EU trends are looking at increased defense spending as well.
- The chart below plots the 30yr government bond yields for these economies. We have mostly been trending higher over the past 6-12 months. Japan, an historical laggard in this space, has now caught up with the level of German 30yr yield levels.
- The second chart presents the correlations between the 30yr JGB yield and those of the rest of the G7. The correlations are presented as a rolling 6 month window.
- Outside of JGB and Italian yields, the correlations have been trending higher of late and sit close to cyclical highs. This provides scope for spill over from high JGB yields and vice versa to Japan from other G7 markets.
Fig 1: G7 30yr Government Bond Yields
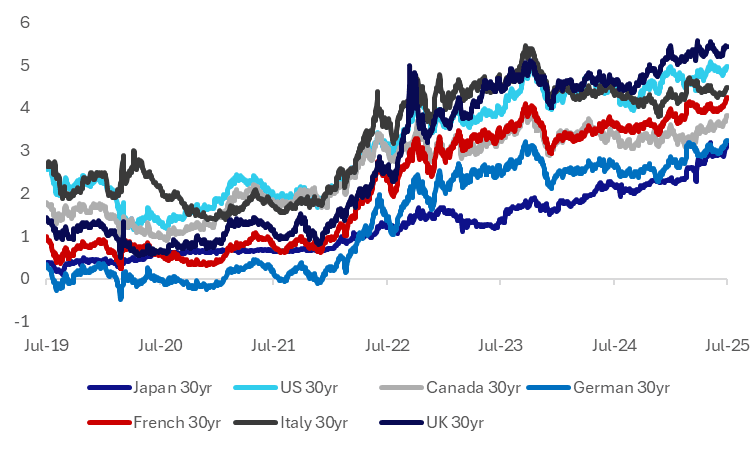
Source: Bloomberg Finance L.P./MNI
Fig 2: JGB 30yr Yield Correlations With Other 30yr G7 Yields
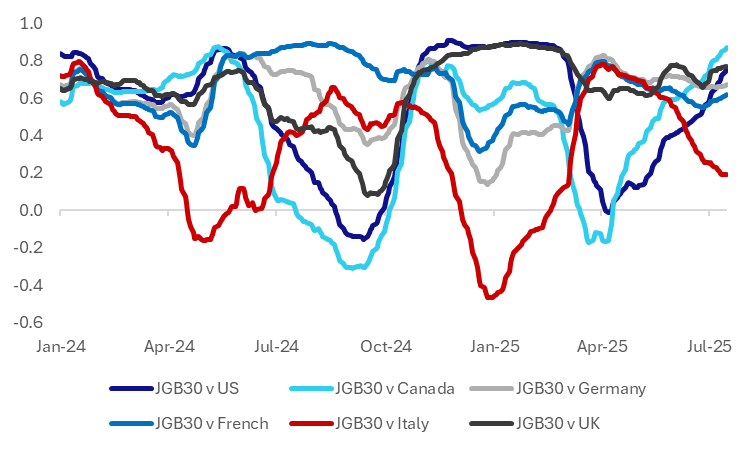
Fig 2: JGB 30yr Yield Correlations With Other 30yr G7 Yields
CHINA: Bond Futures Up in the Morning Session
- China's bond futures have rallied this morning to take back yesterday's losses.
- The 10yr is up +0.13 to 108.86, just below the 50-day EMA of 108.90, with the 100-day EMA below at 108.80.
- The 2yr is up +0.03 at 102.41 to remain below all major moving averages. The nearest being the 20-day EMA of 102.46
- Bonds remain stable with the CGB10yr at 1.66%