AUSTRALIA: NZ Q2 Core CPI Suggests Small Moderation In Australia
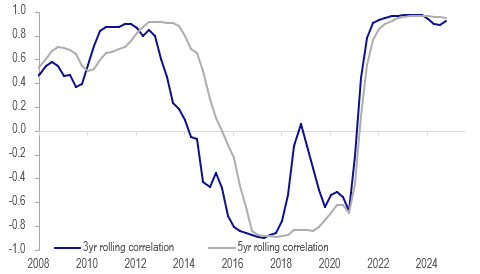
With Australia’s Q2 CPI data released on Wednesday, it is worth looking at NZ developments given the high correlation between the two countries’ inflation rates. With Australia’s headline CPI impacted by government electricity rebates, it is hard to infer any trends. However, the trimmed mean has a 3-year rolling correlation of around 90% with the RBNZ’s measure of core. The two were in line in Q1 at 2.9% and NZ’s Q2 outcome of 2.8% suggests that Australia’s may also post a small decline. This result would be above the RBA’s May Q2 forecast of 2.6% though.
Australia vs NZ underlying inflation y/y%
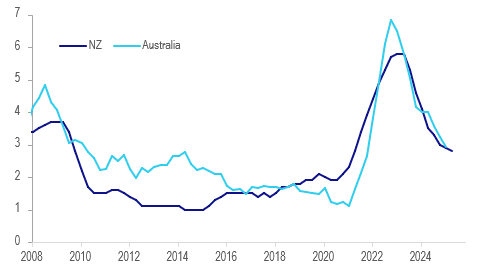
- NZ-Australia services CPIs also have a correlation of around 90% and in Q2 NZ’s picked up to 4.7% y/y from 4.2%. Q2 seasonally sees an increase in the quarterly rate in services but it would have to be above 1.0% q/q in Australia for the annual rate also to pick up. However, NZ non-tradeables inflation moderated 0.3pp to 3.7% y/y in Q2.
- Both services and non-tradeables in NZ continue to run above Australia’s, as has been the case since mid-2023.
- RBA Governor Bullock noted that in the monthly CPI data durable goods prices were a bit higher. NZ’s goods inflation was steady at 1.4% y/y in Q2. The 3-year rolling correlation between Aus-NZ goods inflation has picked up recently to around 95%.
Australia-NZ core CPI y/y% correlations
Source: MNI - Market News/LSEG/RBNZ
Want to read more?
Find more articles and bullets on these widgets:
Historical bullets
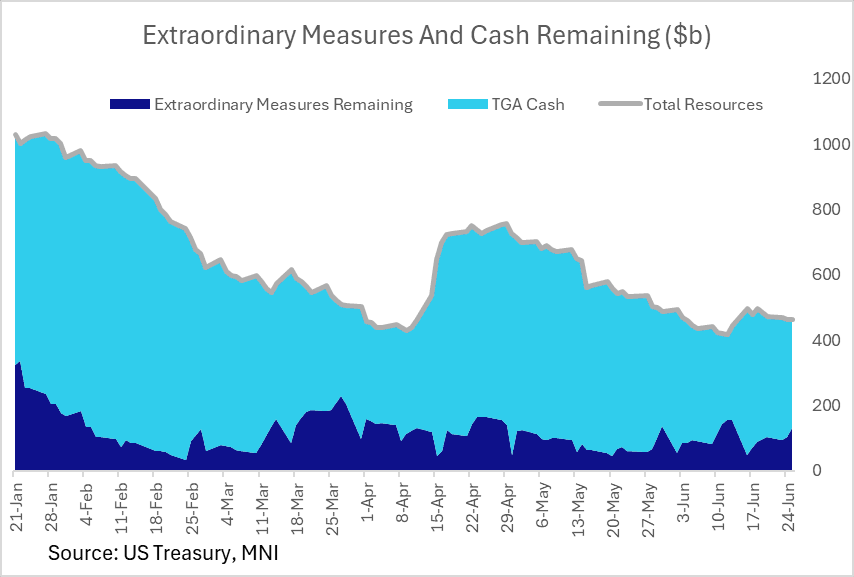
US FISCAL: Available "Extraordinary" Measures To Ward Off X-Date Pick Up
Treasury reported Friday that as of Jun 25 it had $130B in remaining "extraordinary" measures (of a total $378B available) to ward off an "x-date" of running out of resources before defaulting. That's the highest in 2 weeks.
- Combined with $334B cash as of Jun 25 (after a bit of a buildup after the mid-June tax deadline), that's a total of roughly $465B in total resources available.
- We noted earlier this week that Treasury told Congress that it was required to extend its debt issuance suspension period from Jun 27 to Jul 24, in effect prolonging the use of extraordinary measures while we await a resolution to the debt limit impasse, probably through the fiscal legislation currently going through Congress.
- Realistically, fiscal dynamics so far this year point to potential for Treasury to get into September without running out of cash + extraordinary measures. That seems to be the broad market expectation.
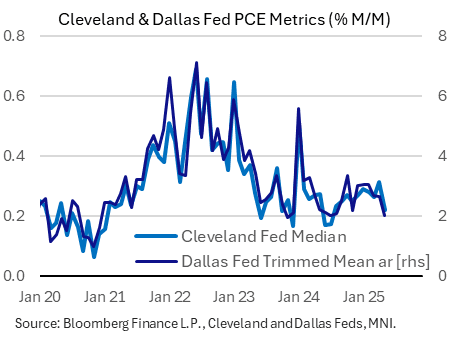
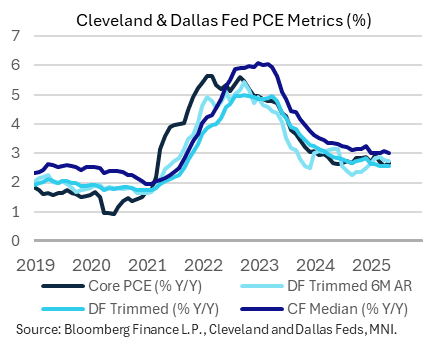
US DATA: Cleveland, Dallas Fed PCE Medians Show Progress But Still Above-Target
The Cleveland and Dallas Fed's median PCE metrics showed a notable drop in May. All indices suggest PCE inflation running above 2%, and higher than the actual core and headline PCE measures, but pressures appear to have cooled from a pickup in the early months of the year.
- The Cleveland Fed's median PCE measure came in at 0.22% M/M, a 10-month low after April's 15-month high 0.31%. This left median PCE at 3.01% on a Y/Y basis, down from 3.06% prior for a the joint-lowest (with Feb) since September 2021.
- The Dallas Fed's annualized median rate fell to 2.01%, from 2.65% prior for a 10-month low. The 6-month annualized rate edged lower to 2.74% (2.76% prior), a 4-month low, with the Y/Y rate ticking down to 2.55% from 2.56%, echoing the Cleveland Fed for the lowest reading since September 2021.
USDCAD TECHS: Pivot Resistance Remains Intact
- RES 4: 1.4111 High Apr 4
- RES 3: 1.4016 High May 12 and 13 and a key resistance
- RES 2: 1.3920 High May 21
- RES 1: 1.2710/3803 20- and 50-day EMA values
- PRICE: 1.3658 @ 16:23 BST Jun 27
- SUP 1: 1.3618 Low Jun 26
- SUP 2: 1.3540 Low Jun 16 and the bear trigger
- SUP 3: 1.3503 1.618 proj of the Feb 3 - 14 - Mar 4 price swing
- SUP 4: 1.3473 Low Oct 2 2024
USDCAD has pulled back from its recent highs. The primary downtrend remains intact and short-term gains appear to have been corrective. Key support and the bear trigger has been defined at 1.3540, the Jun 16 low. Clearance of this price point would resume the downtrend. Any reversal higher would instead signal scope for a stronger retracement. Pivot resistance to monitor is at the 50-day EMA, at 1.3803.