EM ASIA CREDIT: National Australia Bank: New USD deals priced
(NAB, Aa2/AA-/AA-)
"PRICED: National Australia Bank $2.5bn 4-Part Debt Deal" - BBG
New Issue: USD650m 3Y
IPT: T+60bp area
Final: T+35bp
New Issue: USD600m 3Y FRN
IPT: SOFR
Final: SOFR+53bp
New Issue: USD500m 5Y
IPT: T+70bp area
Final: T+45bp
New Issue: USD750m 5Y FRN
IPT: SOFR
Final: SOFR+68bp
Want to read more?
Find more articles and bullets on these widgets:
Historical bullets
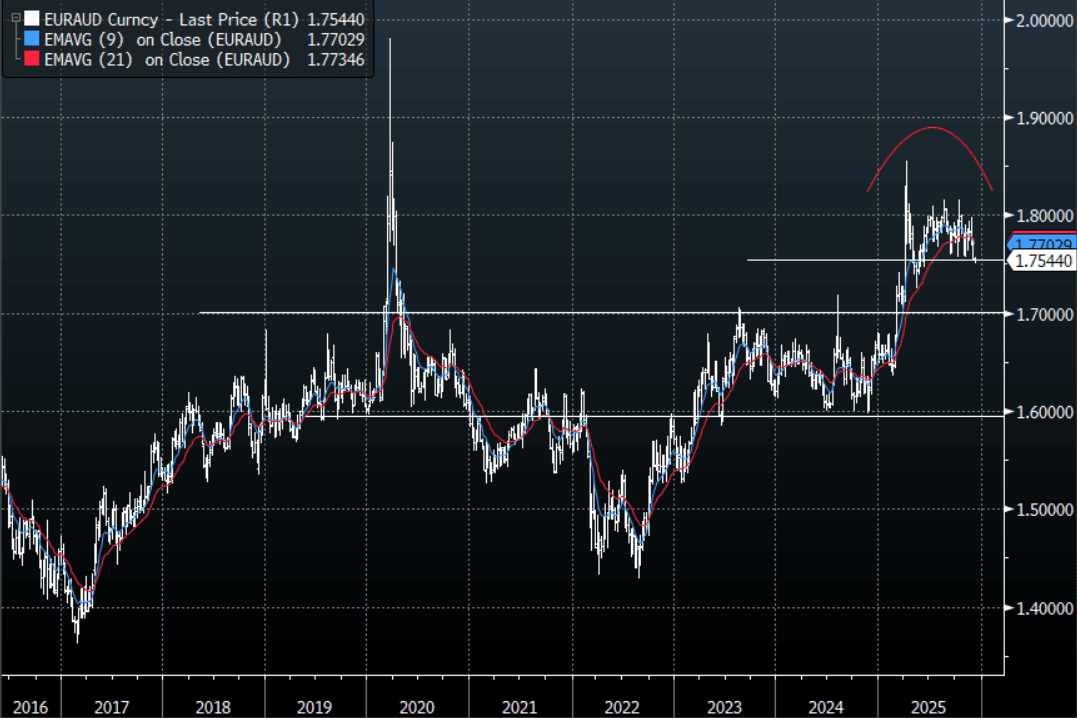
EURAUD: EUR/AUD - Slips lower, Eyes Move Toward 1.7450 Support
The overnight range was 1.7531 - 1.7612, Asia is trading around 1.7545. The pair slipped lower again on Friday as the AUD outperformance started to gain momentum. EUR/AUD has traded sideways in a 1.7450-1.8150 range for the most part since March/April this year. The AUD looks to be finding some real demand and dips have been shallow as the market starts to price in rate hikes next year. This has seen the pair move back towards the lower end of its range where I suspect we will challenge these lows at some point. On the day sellers should reemerge back toward the 1.7585-1.7615 area looking for a move lower to challenge the pivotal 1.7450-1.7550 support. A sustained break through this level and it could start to gather momentum potentially putting in a medium-term top.
- The EUR/AUD Average True Range(ATR) for the last 10 Trading days: 90 Points
Fig 1: EUR/AUD spot Daily Chart
Source: MNI - Market News/Bloomberg Finance L.P
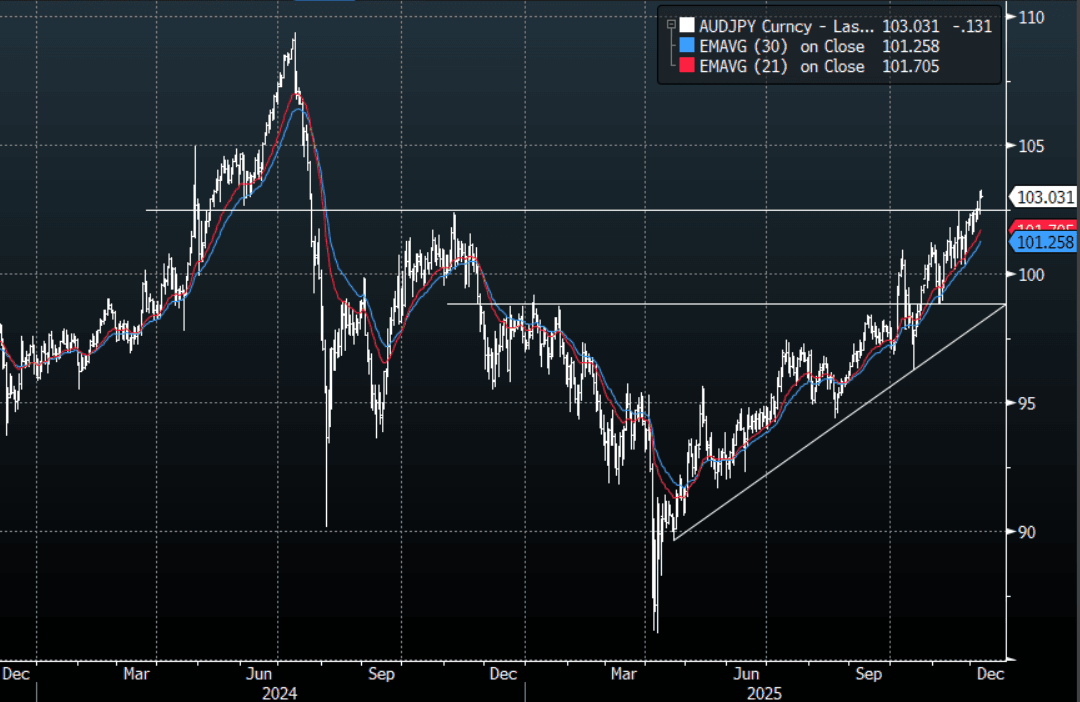
AUD: AUD/JPY - Breaks Above 102.50 Can It Build Momentum To Extend Higher ?
The Friday night range was 102.30 - 103.19, Asia is currently trading around 103.05. The pair which had been underlying bid all last week finally broke above 102.50 extending through 103.00 on Friday night. Can it now build on this move and build some upward momentum. On the day support looks to be around 102.55-85 where buyers should remerge looking for a move back above 103.00 en route to 105.00 initially before it will begin looking at the decade long highs around 108.00-110.00.
- The AUD/JPY Average True Range(ATR) for the last 10 Trading days: 73 Points
Fig 1: AUD/JPY spot Daily Chart
Source: MNI - Market News/Bloomberg Finance L.P
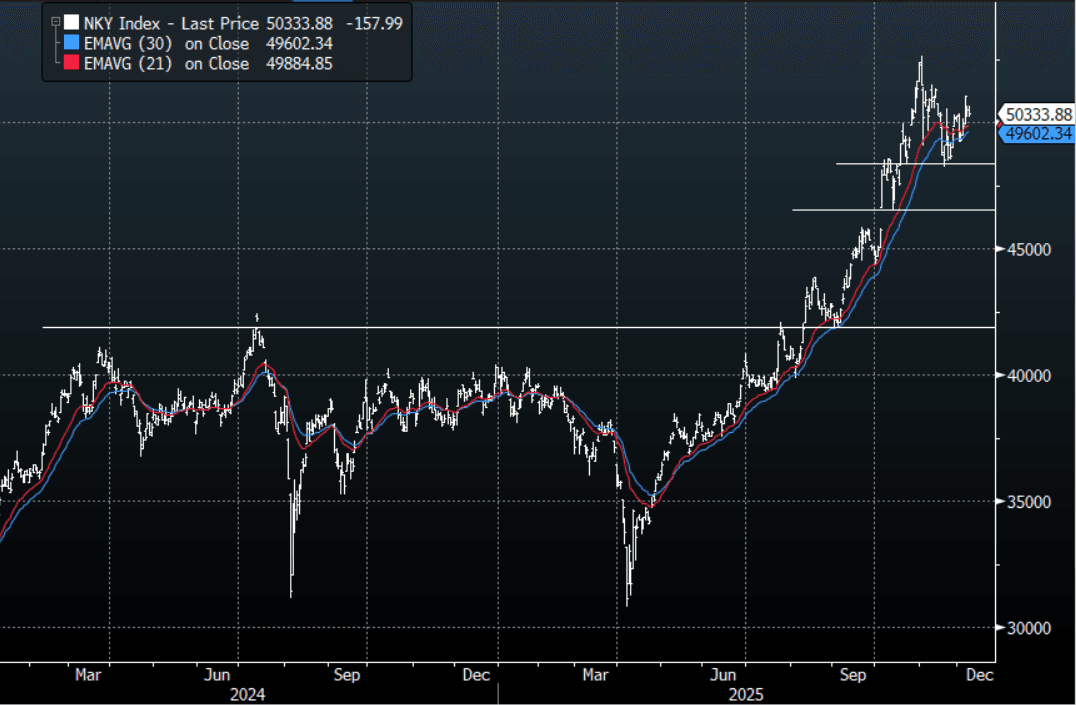
JAPAN: Nikkei(NHH6) - Japanese Data Sees Push Above 50800 Fail
The Nikkei(NHH6) contract Friday night range was 50460 - 50880, Asia is currently trading 50730, +0.05%. The (NHH6) contract consolidated its gains to end the week on Friday. The Nikkei 225 technically remains in an uptrend while the support toward 48000 holds, albeit a very steep one. In the Asian session price data has seen price stall and fall back below the 50800 area, failure to push above here and we could see a pullback towards first support around 49600-900.
- "JAPAN 3Q GDP -2.3% ON ANNUALIZED BASIS; EST. -2.0%(Q3 P -1.8%), JAPAN GDP DEFLATOR AT 3.4% IN 3Q Y/Y; EST. 2.8%" - BBG
- MNI BRIEF: Japan's Oct Negative Real Wages Narrow. Inflation-adjusted real wages, a barometer of households’ purchasing power, remained in negative territory for the 10th straight month in October, falling 0.7% after a 1.3% drop in September, preliminary data from the Ministry of Health, Labour and Welfare showed Monday.
- The Nikkei 225 Index Average True Range(ATR) for the last 10 Trading days: 802 Points
Fig 1: Nikkei 225 Daily Chart
Source: MNI - Market News/Bloomberg Finance L.P