EUROZONE DATA: Moderating Unit Labour Costs Drive Further Deflator Easing In Q1
Jun-06 10:56
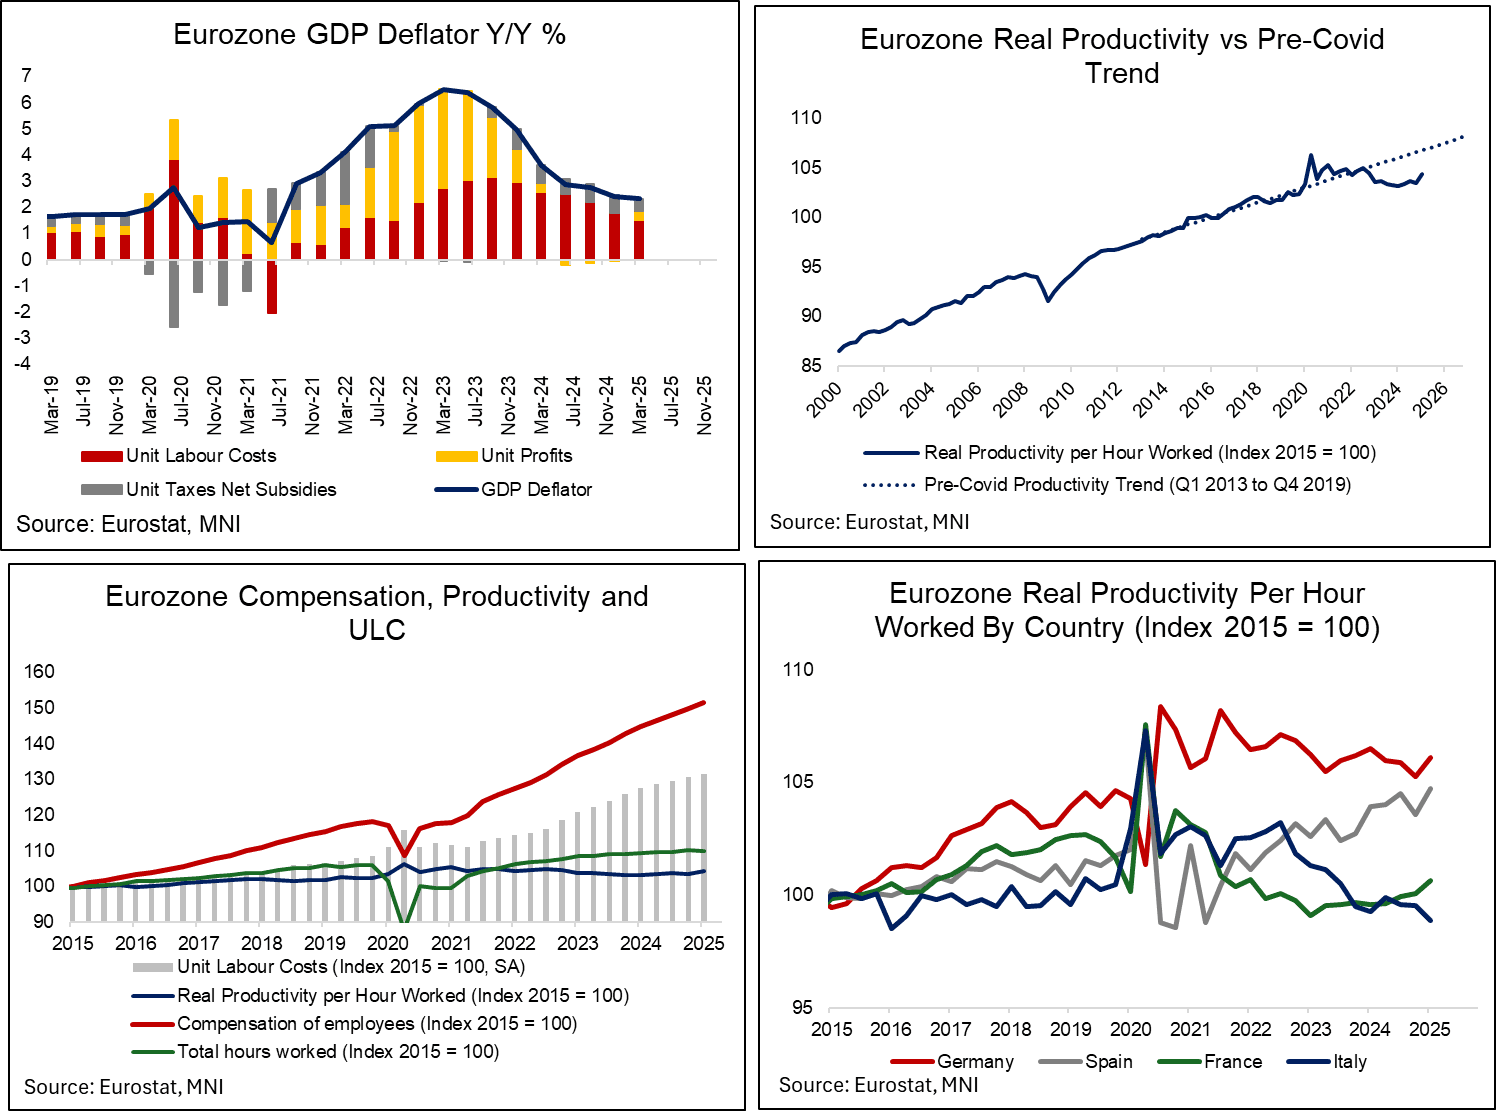
Eurozone GDP deflator growth eased a tenth to 2.3% in Q1, down from 2.4% in Q4 and a cycle high of 6.5% in Q1 2023. A moderation in unit labour costs continued to drive the deceleration, though unit profits provided some offset with the first positive Y/Y reading in a year. This was below the ECB’s 2.5% projection, seemingly a function of lower unit taxes growth than expected.
- In its June projections, the ECB noted that “overall domestic price pressures, as measured by the growth of the GDP deflator, are projected to continue decreasing in 2025 and to level off in the second half of the projection horizon, as declining unit labour costs allow profit margins to increase”.
- In Q1, unit labour costs rose 0.6% Q/Q (vs 0.8% prior) and 3.1% Y/Y (vs 3.7% prior, in line with the ECB’s projection), thus contributing 1.50pp to the annual GDP deflator rate. Compensation per employee growth softened to 3.8% Y/Y (vs 4.1% prior), but this was three tenths above the ECB’s projection. However, productivity per employee growth of 0.8% was four tenths higher than expected. The ECB writes that "growth in unit labour costs is projected to decline further over the projection horizon, on account of falling wage growth and increasing productivity growth."
- Worth noting that Eurozone-wide productivity was artificially skewed higher by increased tariff front-loading in countries such as Ireland and, to a lesser extent, Germany. Since employment growth (0.7% Y/Y) undershot real GDP growth of 1.2% Y/Y, productivity per employee by definition increased. Similar trends are seen on an hours-worked basis. At a country-level, Italian productivity growth stands out as weak.
- Unit profits fell 0.1% Q/Q (vs +0.8% prior) but rose 0.9% Y/Y (vs -0.1% prior), contributing 0.37pp to deflator growth. The ECB projected unit profit growth of 0.4% Y/Y in June, and noted that "as growth in unit labour costs moderates and other input cost dynamics remain contained, unit profit growth is expected to recover somewhat from 2025, aided by the economic recovery, strengthening productivity growth and a temporary accounting boost in 2027 related to the statistical treatment of ETS2".
- Taxes net of subsidies contributed the remaining 0.46pp, with annual growth of 4.3% Y/Y below the ECB’s 6.0% projection.
Want to read more?
Find more articles and bullets on these widgets:
Historical bullets
OPTIONS: Expiries for May07 NY cut 1000ET (Source DTCC)
May-07 10:56
- EUR/USD: $1.1400(E763mln)
- USD/JPY: Y142.50($804mln), Y143.00($595mln), Y143.20($746mln), Y145.50-55($1.1bln), Y145.85-00($1.6bln)
- EUR/GBP: Gbp0.8555-68(E501mln)
- AUD/USD: $0.6400(A$676mln), $0.6600(A$717mln)
- USD/CAD: C$1.3750-65825mln), C$1.3775-80($961mln)
- USD/CNY: Cny7.2000($500mln)
EQUITIES: Estoxx outright Put buyer
May-07 10:46
SX5E (16th May) 4650p, bought for 2.4 in 5k.
OUTLOOK: Price Signal Summary - Trend Structure In Gold Remains Bullish
May-07 10:45
- On the commodity front, Gold has recovered from its recent lows and this suggests the correction between Apr 22 - May 1, is over. A continuation higher would refocus attention on key resistance and the bull trigger at $3500.1, the Apr 22 high. Clearance of this level would confirm a resumption of the primary uptrend. Key short-term support has been defined at $3202.0, the May 1 low. A break of this level is required to signal scope for a deeper retracement.
- In the oil space, a medium-term bearish trend in WTI futures remains intact and short-term gains are considered corrective. The move down that started Apr 23 signals the end of the correction between Apr 9 - 23. That cycle higher allowed an oversold condition to unwind. Attention is on $54.67, the Apr 9 low and a bear trigger. Clearance of this level would resume the downtrend and open $53.72, a 2.236 projection of the Feb 20 - Mar 5 - Apr 2 price swing. Key resistance to watch is $64.12, the 50-day EMA.