MNI EUROPEAN MARKETS ANALYSIS: A$ Up On CPI Beat
- US President Trump's speech to mark his first 100 days in office was big on rhetoric but had little fresh policy detail, particularly around potential trade deals. US equity futures are weaker, with some earnings disappointment weighing.
- AUD has outperformed in the G10 space, aided by firmer than forecast CPI. RBA-dated OIS pricing is 2-5bps firmer across meetings after today’s data. A 50bp rate cut in May is given a 3% probability China PMIs were mixed but showed a sharp decline in new export orders. USD/Asia pairs continues to decline, while oil prices remained on the backfoot.
- Later US Q1 GDP & employment costs, March core PCE prices, April MNI Chicago PMI & ADP employment print. Also preliminary April euro area CPI, Q1 GDP including Germany & Italy, German March retail sales & unemployment are released. BoE’s Lombardelli speaks.
MARKETS
US TSYS: Asia Wrap - Quiet Session
TYM5 has traded a little higher with a range of 112-04 to 112-09 during the Asia-Pacific session. It last changed hands at 112-06, up 0-01 from the previous close.
- The US 10-year yield is a little lower, dealing around 4.16%, down from its close around 4.1716%.
- The US 2-year yield is unchanged, dealing around 3.65%.
- US President Trump has spoken at a rally in Michigan, which marks his first 100 days in office. The speech was big on rhetoric, but policy related areas of interest for the market remained light.
- “The trade deficit widened to a record in March, and consumer spending slowed, contributing to the GDP growth slowdown.”(per BBG)
- MNI Economist re GDP - “Domestic demand should look somewhat more robust but will be clouded by question marks over the extent to which areas of strength were driven by tariff front-running”.
- Month End flow will continue to be a key driver tonight.
- The 10-year Yield, has put in a lower high around 4.40% and has broken through the recent support around 4.25%. The next support is towards the 4.10 area which should find supply once more.
- Data/Events : ADP private jobs data, GDP, Chicago PMI, PCE and Home Sales.
BOJ: MNI BoJ Preview - May 2025: Wait-And-See Stance
EXECUTIVE SUMMARY
- The Bank of Japan (BoJ) is scheduled to hold its Monetary Policy Meeting (MPM) on April 30–May 1, during which it will also release its latest Outlook Report. The BoJ is widely expected to leave its benchmark interest rate unchanged at 0.5%.
- This decision comes amid a complicated economic backdrop: while Tokyo’s core inflation rose to 3.4% in April — its highest level in two years, driven by higher food prices and reduced energy subsidies — risks to economic growth are increasing.
- Given the significant shifts in external conditions, particularly the U.S. tariff policy changes since the last MPM in March, the BoJ is likely to adopt a cautious, wait-and-see stance at this meeting.
- Looking ahead, most analysts believe that the next interest rate hike will not occur before October 2025 at the earliest.
- As for the BoJ's Outlook Report, it is unlikely that the Bank will dramatically alter its baseline scenario. That said, the BoJ is expected to revise down its economic and inflation forecasts for the fiscal year 2025.
- Governor Ueda’s upcoming press conference is expected to attract considerable attention, especially regarding how the recent external shocks might influence the BoJ’s economic and inflation projections and future monetary policy.
Full preview here
JGBS: Modestly Richer, BoJ Decision Tomorrow
JGB futures are modestly stronger, +7 compared to the settlement levels.
- Outside of the previously outlined IP and Retail Sales data, there hasn't been much by way of domestic drivers to flag.
- The BoJ is widely expected to leave its benchmark interest rate unchanged at 0.5% tomorrow. This decision comes amid a complicated economic backdrop: while Tokyo’s core inflation rose to 3.4% in April — its highest level in two years, driven by higher food prices and reduced energy subsidies — risks to economic growth are increasing.
- Given the significant shifts in external conditions, particularly the US tariff policy changes since the last MPM in March, the BoJ is likely to adopt a cautious, wait-and-see stance at this meeting. (See MNI BoJ Preview here)
- Cash US tsys are slightly mixed in today's Asia-Pac session. Today’s US calendar will see ADP private jobs data, GDP, Chicago PMI, PCE and Home Sales.
- Cash JGBs are flat to 2bps richer (5-year). The benchmark 10-year yield is 0.7bp higher at 1.312%.
- Swap rates are 1-3bps lower. Swap spreads are mixed.
- Tomorrow, the local calendar will also see Jibun Bank PMI Mfg and Consumer Confidence data.
JAPAN DATA: March IP Below Expectations, Trend Close To Flat Y/Y
Japan March preliminary industrial production was below market forecasts, down 1.1%m/m, versus -0.4% expected. In y/y terms we came in at -0.3% versus 0.8% forecast (0.1% was the prior outcome).
- The y/y trend hasn't been able to see much upside traction for a number of years now. The current y/y pace is slightly above averages for 2023/24 but only marginally.
- By sub-sector, capital goods production rose 0.6%m/m, but ex transport was negative m/m. Shipments were negative. Durable consumer goods saw a sharp 6.5% fall, while non-durable consumer goods were also down. A government official also noted the sharp falls in motor vehicle production in March (down 5.9%m/m) due to lower exports and supply constraints (per RTRS).
- METI still looks for solid rises in output for April and May, although the trade/tariff outlook may derail such projections.
AUSSIE BONDS: Modestly Cheaper After CPI Beat, Chance 50bp Cut In May Gone
ACGBs (YM flat & XM +2.0) slightly mixed on the day but 1-4bps cheaper after today’s Q1 CPI data.
- Q1 headline and underlying inflation printed 0.1pp higher than expected but the trimmed mean at 2.9% y/y is below the top of the RBA’s 2-3% target band for the first time since Q4 2021.
- Cash US tsys are slightly mixed in today's Asia-Pac session.
- Cash ACGBs are flat to 2bps richer on the day, with the AU-US 10-year yield differential at flat.
- Swap rates are flat to 4bps lower, with the curve flatter.
- The bills strip has twist-flattened, with pricing -5 to +3.
- The data is close to the RBA’s expectations and at this stage consistent with inflation sustainably remaining within the band. Thus, another 25bp rate cut to 3.85% is likely on May 20, assuming that easing is consistent with the RBA’s updated outlook.
- RBA-dated OIS pricing is 2-5bps firmer across meetings after today’s data. A 50bp rate cut in May is given a 3% probability, with a cumulative 112bps of easing priced by year-end.
- Tomorrow, the local calendar will see CoreLogic Home Values, Trade Balance and Q1 Terms of Trade data.
- The AOFM plans to sell A$1200mn of the 2.75% 21 June 2035 bond on Friday.
AUSTRALIA DATA: Trimmed Mean Back In Band As Services Below 4%
Q1 headline and underlying inflation printed 0.1pp higher than expected but the trimmed mean at 2.9% y/y is below the top of the RBA’s 2-3% target band for the first time since Q4 2021. The data is close to the RBA’s expectations and at this stage consistent with inflation sustainably remaining within the band. Thus, another 25bp rate cut to 3.85% is likely on May 20, assuming that easing is consistent with the RBA’s updated outlook.
Australia CPI inflation y/y%

- Q1 trimmed mean CPI rose 0.7% q/q to be up 2.9% y/y, down from the upwardly revised Q4 at 3.3% y/y.
- Domestically-driven services inflation moderated to 3.7% y/y in Q1 from 4.3% with core services at 3.3% y/y after 4.2% y/y, the lowest since Q1 2022, which should reassure the RBA. Also, the moderation was broad based, which is important for sustainability. However, non-tradeables inflation rose 0.1pp to 3.2% y/y.
- Tradeables continued to provide disinflationary pressure falling for the third straight quarter down 0.4% q/q bringing the annual rate to 0.9% from 1.1%. Good prices rose 1.0% q/q though to be up 1.3% y/y after 0.8% y/y.
Australia goods vs services inflation y/y%

- Headline rose 0.9% q/q & 2.4% y/y, in line with Q4’s annual rate. It continues to be impacted by government electricity rebates and the ABS said that electricity prices rose 16.3% q/q in Q1 due to Brisbane households already using the $1000 subsidy. Also, the impact of the federal government’s relief was less in Q1 than Q4.
- Food and non-alcoholic beverages rose 1.2% q/q driven by fruit & vegetables because of less supply.
- Education rose 5.2% q/q as higher costs were passed on and tertiary fees indexation (+3.6%).
BONDS: NZGBS: Closed Richer, Bus Conf Lower, US ADP Data Later
NZGBs closed 1-3bps richer, but slightly off session bests at the long-end.
- NZ-US and NZ-AU 10-year yield differentials closed little changed.
- Cash US tsys are slightly mixed in today's Asia-Pac session.
- ANZ business confidence fell to 49.3 in April from 57.5, the lowest level since July 2024, the month before the start of the RBNZ’s easing cycle. The activity outlook moderated to 47.7 from 48.6, which remains above February’s 45.1.
- On a more positive note, the assessment of activity compared to a year ago rose 10 points to 11 driven by services and signalling a strong start to Q2 for GDP growth. Price/cost components trended higher over Q1 but were mixed in April but inflation expectations were stable around 2.6%.
- Online job ads fell for the 10th straight quarter on an annual basis.
- Swap rates closed 2-5bps lower, with the 2s10s curve flatter.
- RBNZ dated OIS pricing closed little changed across meetings. 26bps of easing is priced for May, with a cumulative 83bps by November 2025.
- Tomorrow, the local calendar will see CoreLogic Home Values ahead of Building Permits on Friday.
- Tomorrow, the NZ Treasury plans to sell NZ$250mn of the 4.50% May-30 bond, NZ$150mn of the 4.25% May-34 bond and NZ$50mn of the 5.00% May-54 bond.
NEW ZEALAND: Businesses Less Certain On Outlook, Gradual Recovery Continues
ANZ business confidence fell to 49.3 in April from 57.5, the lowest level since July 2024, the month before the start of the RBNZ’s easing cycle. The activity outlook moderated to 47.7 from 48.6, which remains above February’s 45.1. On a more positive note, the assessment of activity compared to a year ago rose 10 points to 11 driven by services and signalling a strong start to Q2 for GDP growth. Price/cost components trended higher over Q1 but were mixed in April but inflation expectations were stable around 2.6%.
NZ ANZ business activity outlook vs employment intentions

Source: MNI - Market News/LSEG
- It is likely that the survey was impacted by US tariff announcements, as ANZ noted that “forward-looking activity indicators were sharply lower in the late-month responses”. Export intentions fell 5 points to 12.2 with manufacturing down 7.6 points, while investment intentions were steady around 17.2.
- Employment compared to a year ago rose to +1.5 from -6.2 with services, construction and agriculture showing more jobs, while employment intentions rose 2.5 points to 18.1, the highest since July 21. This is in line with filled jobs and vacancy data showing a turn in the labour market. Wages expectations a year ahead rose over a point to 81.3.
- Cost expectations 3 months ahead rose to 77.9 from 74.1, highest since September 2023, while pricing intentions moderated almost 2 points to 49.4, signalling some margin squeeze. Profit expectations fell 1 point.
NZ ANZ business survey costs/prices

FOREX: G10 Wrap - USD Trying To Bounce, Market Remains Bearish
The BBDXY has had an Asian range of 1220.99 - 1223.27, Asia is currently trading around 1222. Bloomberg - “ The European union has made tangible offers to Donald Trump's administration in an effort to return stability to the global economy, according to the bloc’s commissioner for international partnerships”. “The ECB’s Yannis Stournaras urged caution with any additional rate cuts due to global uncertainty, but said the deposit is expected to be trimmed to 2%”. US President Trump has spoken at a rally in Michigan, which marks his first 100 days in office. The speech was big on rhetoric, but policy related areas of interest for the market remained light.
- EUR/USD - Asian range 1.1355 - 1.1396, Asia is currently trading 1.1370. Intra-day support is around 1.1300, should this area not hold demand should remerge on dips back to 1.1100.
- GBP/USD - Asian range 1.3382 - 1.3415, the GBP momentum seems to be stalling towards the decent Weekly resistance around 1.3500. Intra-day support 1.3280 area.
- USD/JPY - Asian range 142.17 - 142.55, has drifted higher for most of the Asia session. On the day the 143 handle should once again offer supply, then more importantly the 145/146 area should once more offer good levels for sellers to reengage. A break back below 142.00 and the market will once again turn its focus on the pivotal 140.00 area.
- USD/CNH - Asian range 7.2619 - 7.2761, the USD/CNY fix printed lower again at 7.2014. Will need to get back above 7.3000 again to start thinking about moving higher again. The longer it stays below there the higher the chance of weaker longs being forced to pare back exposure.
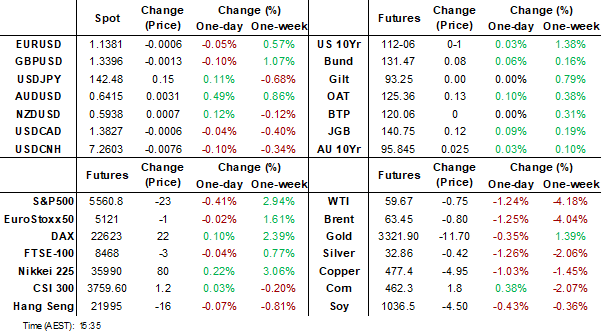
- Cross asset : SPX -0.44%, Gold $3303, US 10-Year yield 4.16%, BBDXY 1222, Crude oil $59.68.
- Data/Events : French & Italian GDP, US ADP private jobs data, GDP, Chicago PMI, PCE and Home Sales.
Fig 1: USD/JPY Spot Hourly Chart

Source: MNI - Market News/Bloomberg
FOREX: Antipodean Wrap - AUD Pops On Higher Than Expected Inflation
MNI Aus Economist - Monthly trimmed mean and headline data for March were unchanged from February at 2.7% y/y and 2.4% respectively. The latter was higher-than-forecast. The trimmed mean has been around 2.7% for four consecutive months now, which is consistent with the RBA’s projection that it could remain around this rate and not make any further progress towards the 2.5%-target mid-point in 2025. Given global developments though, the outlook remains highly uncertain. Bloomberg - “New Zealand business confidence fell to a nine-month low in April due to US President Donald Trump's tariff policies. ANZ Bank revised down its outlook for New Zealand's economic growth and expects the Reserve Bank to cut the Official Cash Rate to 2.5% this year from 3.5% currently.”
- AUD/USD - Asian range 0.6379 - 0.6407, the AUD got a quick 20/30 point boost from a higher than expected CPI. Momentum though has been stalling above 0.6400 the last few days. Watch the support around 0.6350 if this gives way, look for buyers to return back towards 0.6250.
- AUD/JPY - Asian range 90.75 - 91.21. Price goes into the London trading around 91.20, continues to trade sideways in a range of 0.8950/0.9200.
- NZDUSD - Asian range 0.5924 - 0.5945, going into London trading around 0.5930. Demand should return first around 0.5900, then around the 0.5800 area.
- AUD/NZD - Asian range 1.0744 - 1.0797, the cross has benefited from the AU CPI in the Asian session. Watch for supply to return on any bounce back towards the 1.0850 area.
Fig 1 : AUD/USD Spot Hourly Chart

Source: MNI - Market News/Bloomberg
ASIA STOCKS: China Bank Earnings Look Challenging
The anticipated release of earnings from China major banks sees an earnings downdraft as stimulus measures last year eroded margins and now the looming trade war poses a further threat. ICBC saw net income down 4% in Q1 driving shares lower by 6%.
In Korea Samsung shares were down even though net income was better than expected as forward looking assessments question the ability to sustain the chip demand seen in recent reporting periods.
- A quiet day for China’s major bourses, weighed down by the banking results with the Hang Seng up just +0.22%, CSI 300 +0.07%, Shanghai Comp -0.08% and Shenzhen the outperformer up +0.94%.
- The KOSPI was the one of the strugglers today as it slipped -0.63% on tech concerns, fuelled by Samsung’s release.
- Malyaia's FTSE KLCI bounced back from yesterdays fall to gain +0.83% today.
- Indonesia’s Jakarta Composite continued its good run gaining +0.45 and is up over 4% for the month.
- The FTSE Straits Times in Singapore rose +0.39% and the PSEi in Philippines jumped +1.54% on strong trade data.
- India’s NIFTY 50 is up +0.21% in early trading and if maintained has delivered gains of over +3.5% for the month.
ASIA STOCKS: Strong Inflows Continue Across Region
Strong inflows continue with India topping US$4bn of inflows over the last nine days.
- South Korea: Recorded inflows of +$576m as of yesterday, bringing the 5-day total to +$847m. 2025 to date flows are -$12,096m. The 5-day average is +$169m, the 20-day average is -$326m and the 100-day average of -$136m.
- Taiwan: Had inflows of +$310m as of yesterday, with total inflows of +$1,765m over the past 5 days. YTD flows are negative at -$18,312. The 5-day average is +$353m, the 20-day average of -$44m and the 100-day average of -$207m.
- India: Had inflows of +$295m as of the 28th, with total inflows of +$2,213m over the past 5 days. YTD flows are negative -$12,562m. The 5-day average is +$443m, the 20-day average of +$107m and the 100-day average of -$125m.
- Indonesia: Had inflows of +$1m as of yesterday, with total outflows of -$44m over the prior five days. YTD flows are negative -$3,071m. The 5-day average is -$9m, the 20-day average -$59m and the 100-day average -$38m
- Thailand: Recorded inflows of +$18m as of yesterday, outflows totaling -$218m over the past 5 days. YTD flows are negative at -$1,704m. The 5-day average is -$44m, the 20-day average of -$25m the 100-day average of -$35m.
- Malaysia: Recorded inflows of +$12m as of yesterday, totaling +$166m over the past 5 days. YTD flows are negative at -$2,734m. The 5-day average is +$33m, the 20-day average of -$25m and the 100-day average of -$35m.
- Philippines: Saw inflows of +$5m as of yesterday, with net inflows of +$7m over the past 5 days. YTD flows are negative at -$281m. The 5-day average is +$1m, the 20-day average of -$3m the 100-day average of -$4m.

OIL: Crude Continues Sharp Sell Off On Demand Concerns, Key Data Out Later
Oil has continued to sell off during today’s APAC session after falling around 3% on Tuesday on continued concerns regarding the impact of US trade policy on global energy demand and that OPEC will decide on another outsized output increase when it meets on Monday. Following soft US consumer confidence and Dallas Fed data, Q1 GDP & core PCE prices later today will be monitored closely for any signs of weakening growth related to tariffs. Today’s China manufacturing PMI was lower with export orders down sharply in line with ship-tracking of China-US flows.
- WTI has fallen below $60/bbl today and is currently down 1.3% to $59.63 to be down 16% in April, worse than April 2020. It reached $59.56, the lowest since April 11, but still above initial support at $58.29. The USD index is down slightly.
- Brent breached $63/bbl earlier in the session and is now 1.0% lower at $62.63, holding above support at $61.51. It is down 15.5% this month.
- China’s official manufacturing PMI for April fell to 49.0 from 50.5, below expectations, while the Caixin PMI decreased to 50.4 from 51.2, above consensus.
- Bloomberg reported that there was a US crude inventory build of 3.8mn barrels last week, according to people familiar with the API data. Products continued to destock with gasoline down 3.1mn and distillate 2.5mn. The official EIA data is out today.
- Later US Q1 GDP & employment costs, March core PCE prices, April MNI Chicago PMI & ADP employment print. Also preliminary April euro area CPI, Q1 GDP including Germany, France & Italy, German March retail sales & unemployment are released. BoE’s Lombardelli speaks.
GOLD: As Trade Tensions Ease, Gold Softens
- The push pull of the USD overnight as a stronger dollar saw gold soften.
- As market expectations around tariffs now easing permeated through investor thinking the dollar had a better night which makes gold’s purchase price more expensive
- Gold opened in Asia USD3,315.26 and declined steadily throughout the day to $3,303.06
- Gold continues to sit above all major moving averages with the nearest the 20-day EMA of $3,245.48
- The Thai Central Bank meets today and according to the BOT governor at a ceremony yesterday Thailand needs to brace for a ‘storm’ from the trade war and has increased their gold holdings accordingly.
- Gold ETF’s have experienced six straight days of outflows according to BBG.
- Gold remains one of the best performers year to date up 27% and the recent softening in prices appears likely driven by profit taking than a fundamental change in the outlook for bullion.
CHINA: Official PMI Slips into Contraction
- As anticipated following the release of the EPMI Index, China’s official PMI manufacturing slipped into contraction in April.
- Following March’s result of +50.5 April fell to +49.0, below expectations of +49.7.
- The Non-Manufacturing PMI slipped to +50.4 from +50.8 last month
- These are the first PMI readings since the trade war kicked off with the imposition of 145% tariffs on Chinese goods to the US and as shipments to the US crater the official forecast of 5% growth now looks challenging.
- Authorities have announced measures to support exporters with access to loans and continues to seek ways of boosting the domestic economy.
- However today’s result seems likely a taste of things to come as the trade war impacts not just China corporates, but the region as a whole.
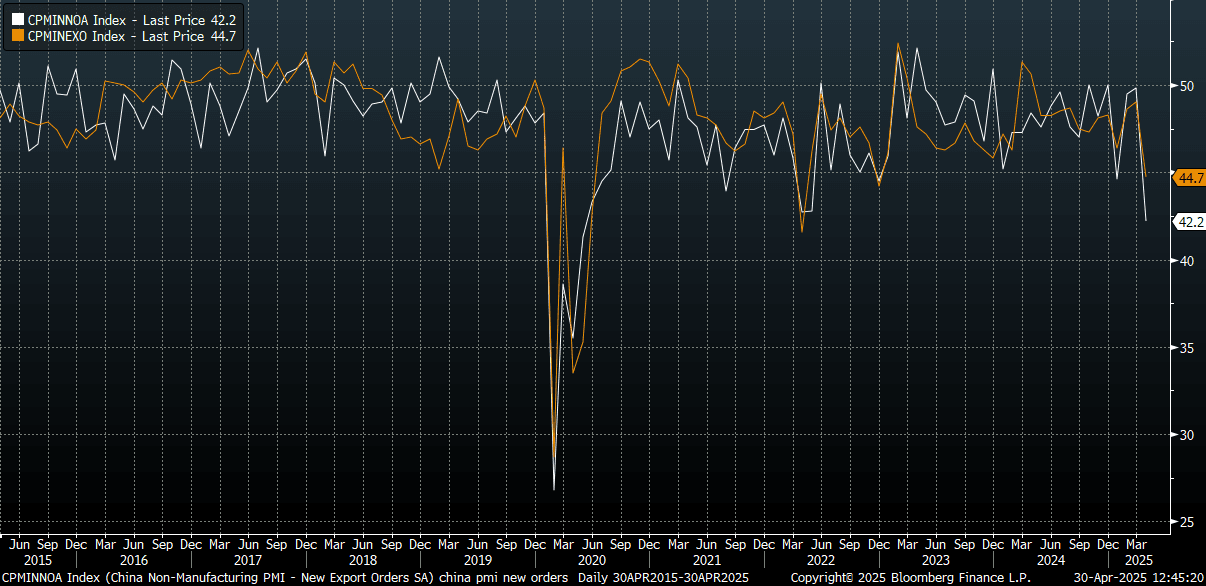
CHINA DATA: PMI Details: New Export Orders Slump, Price Indices Lower
The detail of the official PMI print showed new orders were down to 49.2, back to lows from Jan of this year. New export orders slumped to 44.7, which is fresh lows back to end 2022. April 2022 lows for this index were sub 42.0, while we got to below 30 during the Covid pandemic in 2020. The tariff impact is clearly in play here, with anecdotes of sharp declines in China to US shipping highlighted in recent weeks. For the services PMI, new export orders also fell sharply to 42.2, which is fresh lows back to 2020, see the chart below (which is the white line on the chart, manufacturing is the orange line).
- The aggregate new orders to inventory ratio eased to 1.04 for the manufacturing index, so softer but not implying a collapse in the headline PMI going forward.
- Inputs prices for the manufacturing PMI eased to 47.0 from 49.8 prior. Output prices fell to 44.8 from 47.9 prior.
- For the services side, input prices and selling prices also eased further and remain comfortably sub the 50.0 level.
- Overall, this still points to the need for further policy support, with external risks growing at a time when price pressures remain benign.
Fig 1: China PMIs - New Export Orders Slump
Source: MNI - Market News/Bloomberg
CHINA: CAIXIN PMI Surprises to the Upside But Grey Clouds Ahead
- In what no doubt will be pleasing to authorities, China’s CAIXIN PMI Manufacturing for APRIL rose +50.4 beating expectations for a contraction.
- As the CAIXIN is a broader representation of corporates, this will be pleasing and suggests that to now there has been some form of recovery in corporate activity.
- Nevertheless, it is still a significant contraction from the month prior result of +51.2 but beat market expectations that it would contract to +49.7.
- This marks the lowest reading for the year and possibly spells the beginning for corporates of seeing the impact of the trade war.
- Output fell to +51.6 from +51.8 and new orders were down from the prior month.
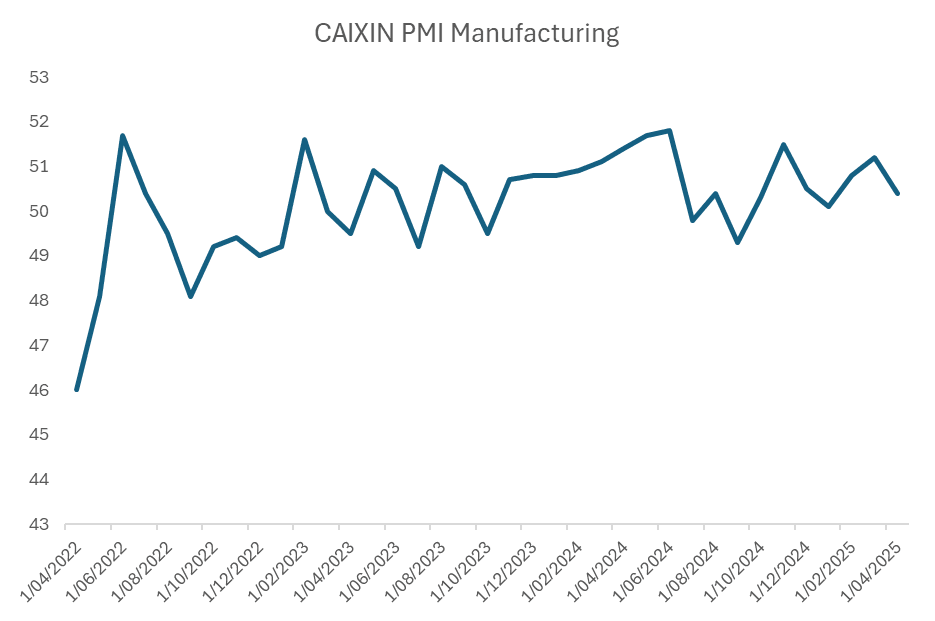
Table of Contents
THAILAND: Growth Outlook Likely To Drive Another BoT Rate Cut
The Bank of Thailand (BoT) decision is later today and 17 out of 21 analysts on Bloomberg expect it to cut rates 25bp to 1.75% (see MNI BoT Preview). In its February statement, it said that it would be monitoring the impact of “trade policies of major economies”, Thai manufacturing activity and loan growth/credit quality. These factors and the stronger THB plus March’s earthquake signal that the central bank is likely to revise down its growth forecast from “around 2.5%”.
- The baht has strengthened around 8% y/y both against the US dollar and in trade weighted terms. This is likely to weigh on exports and the important tourism sector, which saw a 6.9% y/y decline in arrivals in February and is likely to be impacted by the earthquake.
- Q1 customs export growth improved to 15.1% y/y from 10.5% in Q4, but it is highly exposed to the US with 20% of 2024 exports going there worth 11.4% of its GDP, only second to Taiwan in the region. Its exposure to China is a lot less but not immaterial at 12.7% of exports and so they could be impacted directly and indirectly from US trade policy. April S&P Global manufacturing PMI prints on May 2 and may show early impacts on the region given Thailand’s exposure.
US proposed tariffs & country exposure to the US

Source: MNI - Market News/LSEG/US Treasury
- The manufacturing PMI eased to 49.9 from 50.6 in March and the Q1 average at 50.0 was down from 50.5 in Q4 and is signalling stagnation in the sector. Orders are soft with export orders contracting.
- March manufacturing production fell 0.7% y/y, this is not as weak as it has been over recent months, while capacity utilisation rose to 63.7 from 59.0, the highest in two years.
- BoT noted in February that “loan growth and credit quality showed signs of stabilising”. This has generally continued but there was a slight softening in lending.
Thailand manufacturing

SOUTH KOREA: Industrial Production Up +5.3% YoY Beating Estimates
- March industrial production was ahead of expectations rising +5.3% y/y ahead of estimates of +3.2% whilst below February’s revised result of +7.1%.
- The month on month figure also beat estimates rising +2.9% m/m against an estimate of +0.3% and a revised February result of +1.4%.
- The Cyclical Leading Index rose marginally to +0.2 from +0.1.
- The BOK kept rates on hold at the last meeting and next meets on May 29.
- Markets continue to have limited cuts priced in for the near term.
INDIA: Country Wrap: RBI Debt Purchase Announced for May
- China has no intention to undercut markets with artificially low-priced goods, the country’s ambassador to India said, seeking to ease concerns about a potential influx of cheap Chinese products into global markets. “We will not engage in market dumping or cut-throat competition, nor will we disrupt other countries’ industries and economic development,” Xu Feihong wrote on Tuesday in an editorial in the Indian Express newspaper titled “Stand up to Washington’s bullying.” (source BBG)
- The RBI announced a $15bn debt purchase in May to boost liquidity and are expected to ease the demand-supply imbalance and support the economy, with the authority aiming to keep liquidity in 1% surplus of net deposits. (source RBI)
- India's NIFTY 50 is up +0.21% in early trading and if maintained has delivered gains of over +3.5% for the month
- Despite overnight dollar strength, Asia currencies had a strong day with the rupee gaining +.13% to 85.13, its strongest level since December.
- Bonds are weaker at the open with the IGB 10YR at 6.35% +1.5bps today. This comes after a 5bps rally yesterday on the OMO announcement
UP TODAY (TIMES GMT/LOCAL)
| Date | GMT/Local | Impact | Country | Event |
| 30/04/2025 | 0530/0730 | *** | GDP (p) | |
| 30/04/2025 | 0530/0730 | ** | Consumer Spending | |
| 30/04/2025 | 0600/0800 | ** | Import/Export Prices | |
| 30/04/2025 | 0600/0800 | ** | Retail Sales | |
| 30/04/2025 | 0600/1400 | ** | MNI China Money Market Index (MMI) | |
| 30/04/2025 | 0645/0845 | *** | HICP (p) | |
| 30/04/2025 | 0645/0845 | ** | PPI | |
| 30/04/2025 | 0700/0900 | ** | KOF Economic Barometer | |
| 30/04/2025 | 0755/0955 | ** | Unemployment | |
| 30/04/2025 | 0800/1000 | *** | GDP (p) | |
| 30/04/2025 | 0800/1000 | *** | GDP (p) | |
| 30/04/2025 | 0800/1000 | *** | Bavaria CPI | |
| 30/04/2025 | 0800/1000 | *** | North Rhine Westphalia CPI | |
| 30/04/2025 | 0800/1000 | *** | Baden Wuerttemberg CPI | |
| 30/04/2025 | 0900/1100 | *** | HICP (p) | |
| 30/04/2025 | 0900/1000 | ** | Gilt Outright Auction Result | |
| 30/04/2025 | 0900/1100 | *** | EMU Preliminary Flash GDP Q/Q | |
| 30/04/2025 | 0900/1100 | *** | EMU Preliminary Flash GDP Y/Y | |
| 30/04/2025 | 1000/1200 | ** | PPI | |
| 30/04/2025 | 1100/0700 | ** | MBA Weekly Applications Index | |
| 30/04/2025 | 1200/1400 | *** | HICP (p) | |
| 30/04/2025 | 1215/0815 | *** | ADP Employment Report | |
| 30/04/2025 | 1230/0830 | *** | Gross Domestic Product by Industry | |
| 30/04/2025 | 1230/0830 | *** | GDP | |
| 30/04/2025 | 1230/0830 | *** | Employment Cost Index | |
| 30/04/2025 | 1230/0830 | *** | Gross Domestic Product by Industry | |
| 30/04/2025 | 1230/0830 | *** | Treasury Quarterly Refunding | |
| 30/04/2025 | 1342/0942 | *** | MNI Chicago PMI | |
| 30/04/2025 | 1400/1000 | ** | NAR Pending Home Sales | |
| 30/04/2025 | 1400/1000 | *** | Personal Income and Consumption | |
| 30/04/2025 | 1430/1030 | ** | DOE Weekly Crude Oil Stocks | |
| 30/04/2025 | 1530/1630 | BOE Lombardelli At New Economics Teacher Training Launch | ||
| 30/04/2025 | 1730/1330 | BOC Meeting Minutes | ||
| 01/05/2025 | 2300/0900 | ** | S&P Global Manufacturing PMI (f) | |
| 01/05/2025 | 0030/0930 | ** | S&P Global Final Japan Manufacturing PMI | |
| 01/05/2025 | 0130/1130 | ** | Trade price indexes | |
| 01/05/2025 | 0130/1130 | ** | Trade Balance | |
| 01/05/2025 | 0200/1100 | *** | BOJ Policy Rate Announcement | |
| 01/05/2025 | 0630/0830 | ** | Retail Sales | |
| 01/05/2025 | 0830/0930 | ** | BOE Lending to Individuals | |
| 01/05/2025 | 0830/0930 | ** | BOE M4 | |
| 01/05/2025 | 0830/0930 | ** | S&P Global Manufacturing PMI (Final) | |
| 01/05/2025 | - | *** | Domestic-Made Vehicle Sales | |
| 01/05/2025 | 1230/0830 | *** | Jobless Claims | |
| 01/05/2025 | 1230/0830 | ** | WASDE Weekly Import/Export | |
| 01/05/2025 | 1345/0945 | *** | S&P Global Manufacturing Index (final) |