EURAUD: EUR/AUD-Bounces Off Daily Support, Look For Sellers Toward 1.7700
The overnight range was 1.7588 - 1.7641, Asia is trading around 1.7615. The pair has bounced off its support around 1.7450-1.7500 keeping its wider 1.7450-1.8150 range intact for now. The AUD continues to look as if it is finding some real demand and dips for the currency have been shallow as the market starts to price in rate hikes next year. This bounce in EUR/AUD then could potentially offer good levels to fade for a move back towards the lower end of its range which I suspect we will challenge at some point. On the day, support should be seen initially in the 1.7550-80 area but watch for sellers to reemerge toward the 1.7670-1.7750 area looking for an eventual move lower at a later stage to challenge the pivotal 1.7450 support again.
- The EUR/AUD Average True Range(ATR) for the last 10 Trading days: 88 Points
Fig 1: EUR/AUD spot Daily Chart
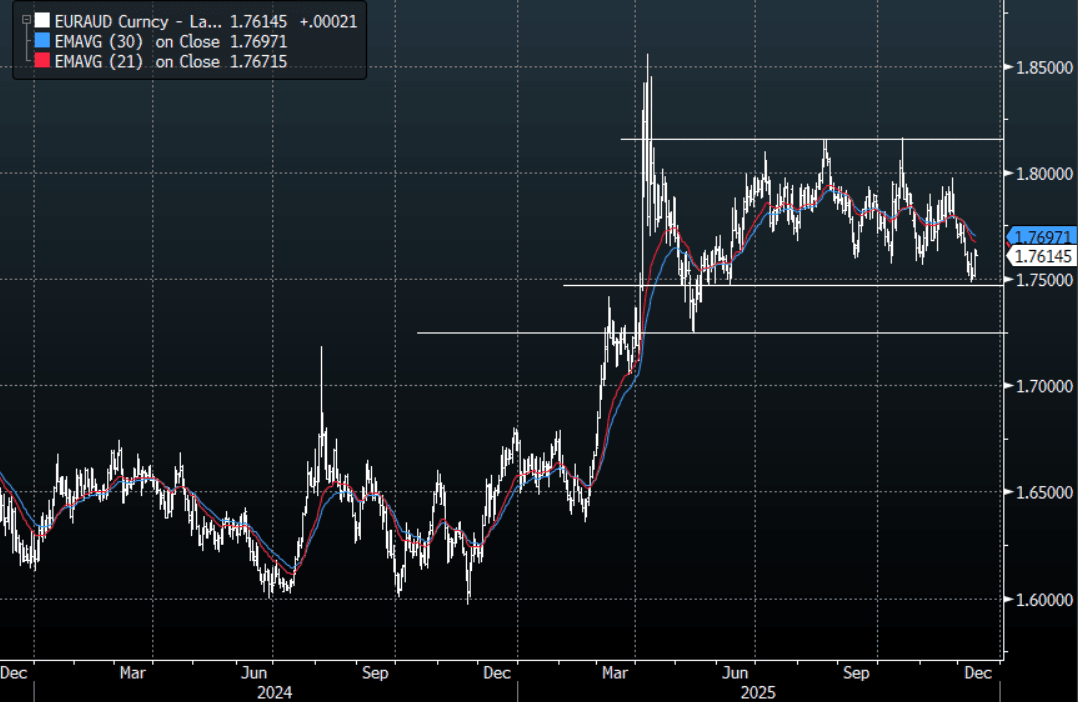
Source: MNI - Market News/Bloomberg Finance L.P
Want to read more?
Find more articles and bullets on these widgets:
Historical bullets
AUSSIE BONDS: ACGB Dec-35 Auction Result
The AOFM sells A$1200mn of the 4.25% 21 December 2035 bond:
- Average Yield (%): 4.3643 (prev. 4.2384)
- High Yield (%): 4.3650 (prev. 4.2400)
- Bid/Cover: 3.4875x (prev. 2.1583x)
- Allotted at Highest Accepted Yld as % of Bid at that Yld (%): 76.1 (prev. 66.1)
- Bidders: 35 (prev. 22), 10 (prev. 13) successful, 3 (prev. 5) allocated in full
AUDNZD: AUD/NZD - Stalls Toward 1.1600, Is It Just Taking A Breather ?
The overnight range was 1.1527 - 1.1573, the Cross is dealing in Asia around 1.1550. The Cross momentum stalled toward the 1.1600 area for the first time, breaking a procession of higher lows which lasted for the last 11 days. This 1.1600 area remains tough resistance but the price action has been unrelenting up until now. A sustained move back above 1.1600/50 and the market will start to get bulled up as the focus will then turn toward the 1.2000 area and beyond. I am a little wary of NZD positioning as the market gets all beared up, yesterday was the first sign we have seen of any potential exhaustion. Though it will take a little more than that to discourage the bulls who have been in full control, and I suspect dips will remain well supported.
- On the day watch the price action if we get back toward 1.1560-70, if it cannot regain upward momentum then it might signal a short-term retracement is underway. Look for dips back toward 1.1400 to be supported again.
Fig 1: AUD/NZD spot Weekly Chart

Source: MNI - Market News/Bloomberg Finance L.P
JAPAN: Nikkei(NHZ5) - Momentum Stalls Toward 51500, Look For Consolidation
The Nikkei(NHZ5) contract overnight range was 50770 - 51220, closing -0.14%. The Nikkei stalled towards the 51500 area yesterday and drifted lower off those highs. The Index has gone parabolic beginning in August/September, it looked to finally be putting in some sort of a top last week but with global sentiment improving again this price action could potentially continue into year-end. The support between 49000-49500 proved to be solid last week and while this continues to hold, I suspect the bulls will be around on dips as the focus turns back to the year's highs above 52 600 and a potential “Santa Rally.” This price action is pretty wild and the acceleration higher has been relentless but I do become wary when price action becomes parabolic, it's prudent to not fight the market when the price moves like this but history tells us when it does eventually stall the pullback could be just as brutal. Look for a 50500-51500 range on the day as it looks to consolidate these recent gains.
Fig 1: Nikkei Daily Chart
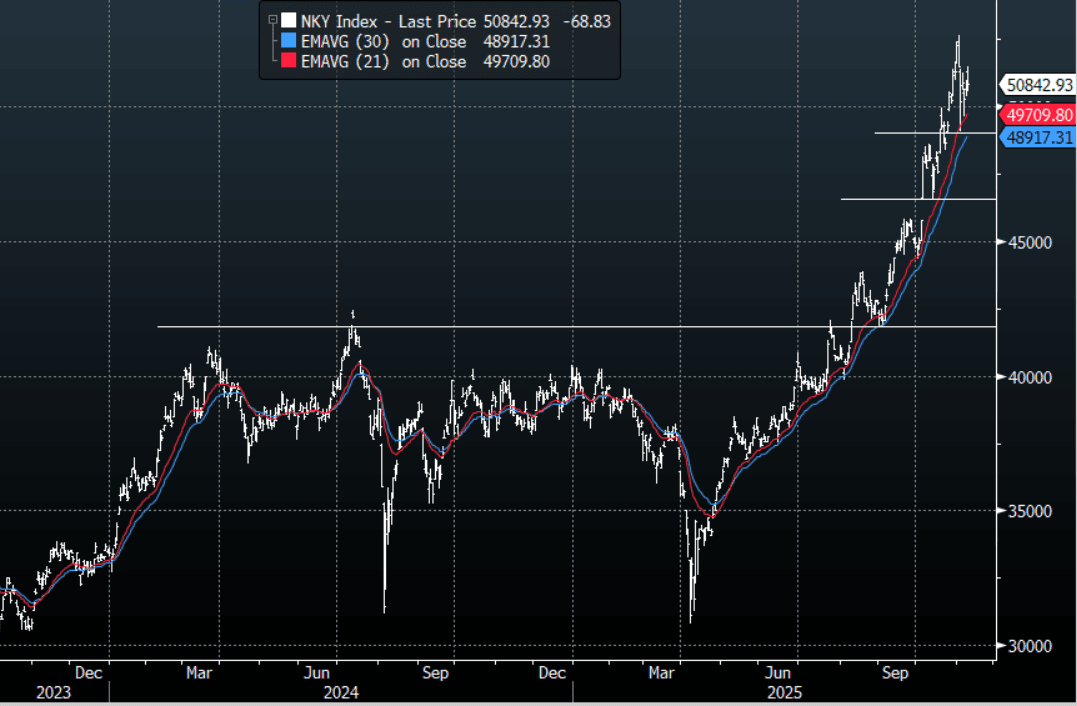
Source: MNI - Market News/Bloomberg Finance L.P