AUD: AUD/USD - Supply Caps 0.6600, Holds Gains In The Crosses
The AUD/USD had a range Friday night of 0.6570- 0.6591, Asia is trading around 0.6570. The pair found good supply again towards 0.6600 capping any move higher, but AUD continued to hold onto its gains in the crosses. CFTC Data does not show any real reduction in the short positions, the price action at the end of last week suggested there was some paring back of these so it's interesting to see it has not had an impact yet. Risk is opening on the backfoot this morning as the world has to again digest Trump's next round of tariffs this time on Europe and Mexico. AUD/USD needs a clear break above 0.6600 to gain momentum for a push higher until then it looks back to the range.
- (Bloomberg) -- “The US government is pressing Japan and Australia to clarify their roles in the event of a US-China war over Taiwan, a move that upsets America’s two key allies in the region, the FT reported.“
- “(Bloomberg) -- “Anthony Albanese touted deeper economic and trade cooperation with China during the Australian PM’s first visit to the country since his re-election in May.”
- The AUD/USD continues to hold above its support around 0.6500, looks like it's back to the 0.6500 - 0.6600 range and it should now take its cues from the USD. Watching to see if the market can build on this outperformance and break above 0.6600.
- Options : Closest significant option expiries for NY cut, based on DTCC data: none. Upcoming Close Strikes : 0.6560(AUD631m July 15), 0.6495(AUD611m July15), 0.6700(AUD611m July 16).
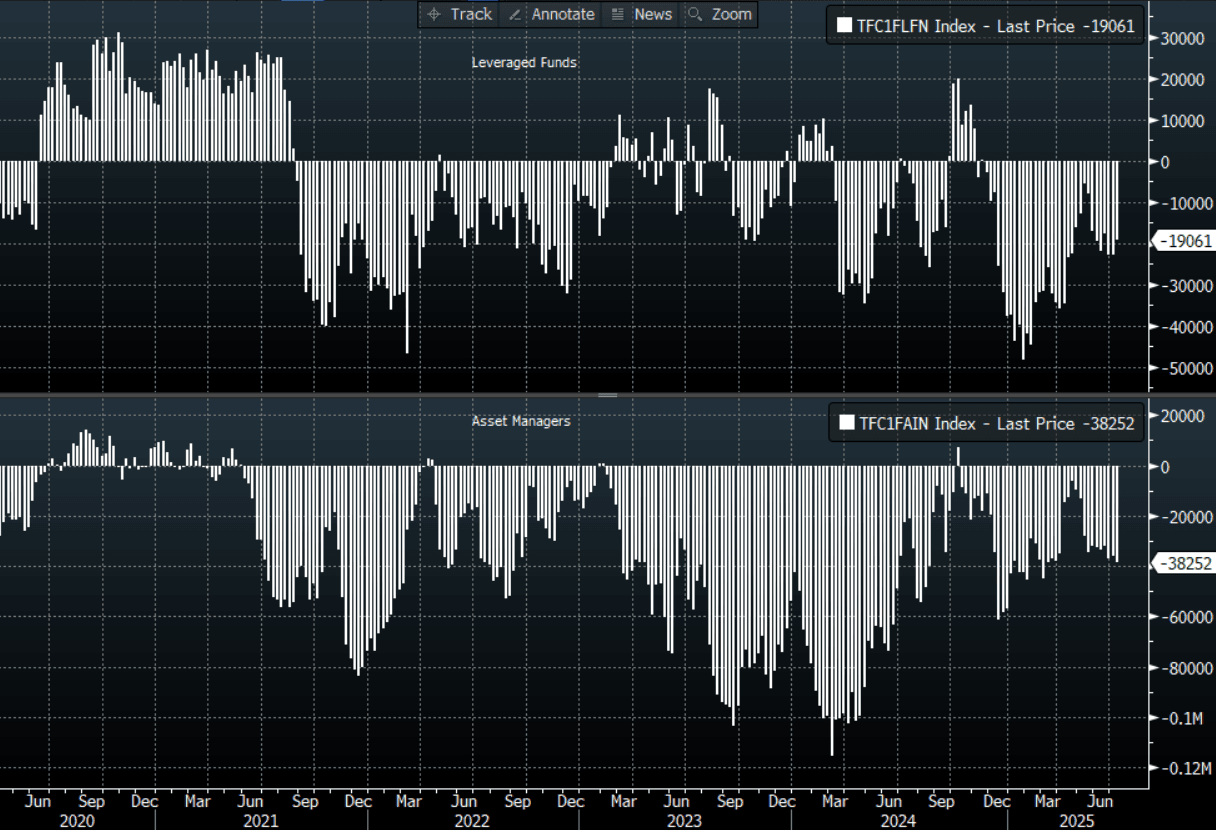
- CFTC Data shows Asset managers added to their shorts slightly -38252, the Leveraged community pared back their shorts to -19061.
- Data/Event: NAB Business Confidence, RBA Cash Rate
Fig 1: AUD CFTC Data
Source: MNI - Market News/Bloomberg Finance L.P
Want to read more?
Find more articles and bullets on these widgets:
Historical bullets
US FISCAL: Available Extraordinary Measures Pick Up Ahead Of Tax Date
Treasury had $144B in "extraordinary measures" available to keep the government financed as of June 11 per a release Friday. That is up from $84B a week earlier and the highest since April 28.
- However, TGA cash continues to fall, to $309B latest (lowest since early April) Combined with a pullback in Treasury cash ($376B), keeping the total resources available to avert an "x-date" in the summer at around $450B .
- There will be another uptick in Treasury cash in the coming days, and it's likely Treasury allowed some of the extraordinary measures to be rebuilt (ie not exercised) in anticipation of more cash coming in.
- This is likely to be the last major uplift before the summer at which point x-date speculation will pick up if Congress hasn't passed a debt limit increase by then.

FED: Two Cuts Priced This Year Headed Into FOMC Week
As we head into the June Fed meeting week, market pricing is reflective of the FOMC’s messaging (that we describe in our preview):
- The next cut is only fully priced by the October FOMC meeting, with September seeing a roughly 80% implied probability of bringing the next 25bp reduction.
- Exactly 50bp of cuts are priced through end-2025, implying two Q4 cuts.
- That’s a shift from just after the May meeting, after which the next cut was fully priced by September, and there were closer to three cuts priced for the rest of the year.
- Overall cuts are seen backloaded this year (after 15bp in September, 29bp of cuts priced in Q4 - Oct/Dec combined), but falls off in Q1 (just 21bp cuts priced, 9bp of cuts priced for January and 12bp for March)

FED: Summary Of Economic Projections: Higher 2025 Inflation, Weaker Growth
The MNI Markets Team’s expectations for the updated Economic Projections are below.
- As of the May meeting, the Federal Reserve staff – whose outlook tends to be broadly shared by the median Committee member – revised their forecasts for growth weaker in 2025 and 2026, “as announced trade policies implied a larger drag on real activity relative to the policies that the staff had assumed in their previous forecast. Trade policies were also expected to lead to slower productivity growth and therefore to reduce potential GDP growth over the next few years. With the drag on demand expected to start earlier and to be larger than the supply response, the output gap was projected to widen significantly over the forecast period. The labor market was expected to weaken substantially, with the unemployment rate forecast moving above the staff's estimate of its natural rate by the end of this year and remaining above the natural rate through 2027."
- On inflation, "The staff's inflation projection was higher than the one prepared for the March meeting. Tariffs were expected to boost inflation markedly this year and to provide a smaller boost in 2026; after that, inflation was projected to decline to 2 percent by 2027."
- Our expectations for these changes fall somewhere in between those projections and the March SEP – a slightly higher unemployment rate, substantially higher inflation in 2025 but to a lesser extent in 2026, and weaker GDP growth this year. Longer-run variables should be unchanged.
MNI Markets Team Expectations For June 2025 Summary Of Economic Projections Medians
