AUD: AUD/USD - Finds Buyers Sub 0.7000 After Corporate Month-End USD Demand
The AUD/USD had a range overnight of 0.6969-0.7087, Asia is trading around {AUDUSD Curncy}. The AUD’s relentless move higher finally stalled toward 0.7100, it looked like a combination of some profit-taking in metals as well as some strong USD demand for corporate month end, this saw it reverse rapidly in the N/Y session but found demand in its support zone and drifted back above 0.7000 after the month-end flows look to have been completed. The AUD has very quickly moved back towards 0.7000-0.7100 as the market prices in rate hikes but I would expect it to do some work up here initially. Was that the pullback ? I would not be surprised if we see another dip first before starting the next leg higher. In the Asian session, the first buy-zone is back toward the 0.6960-0.6990 area, if this does not hold we could see a deeper pullback toward 0.6870-0.6900. I suspect any decent pullback will be used to fade as traders add to longs looking for an eventual move higher.
- Options : Closest significant option expiries for NY cut, based on DTCC data: 0.6800(AUD944m), 0.6825(AUD485m). Upcoming Close Strikes : 0.6950(AUD1.65b Feb 4) - BBG
- The AUD/USD Average True Range for the last 10 Trading days: 76 Points
- Data/Event: Bloomberg Jan. Australia Economic Survey, PPI, Private Sector Credit
Fig 1: AUD/USD spot Daily Chart
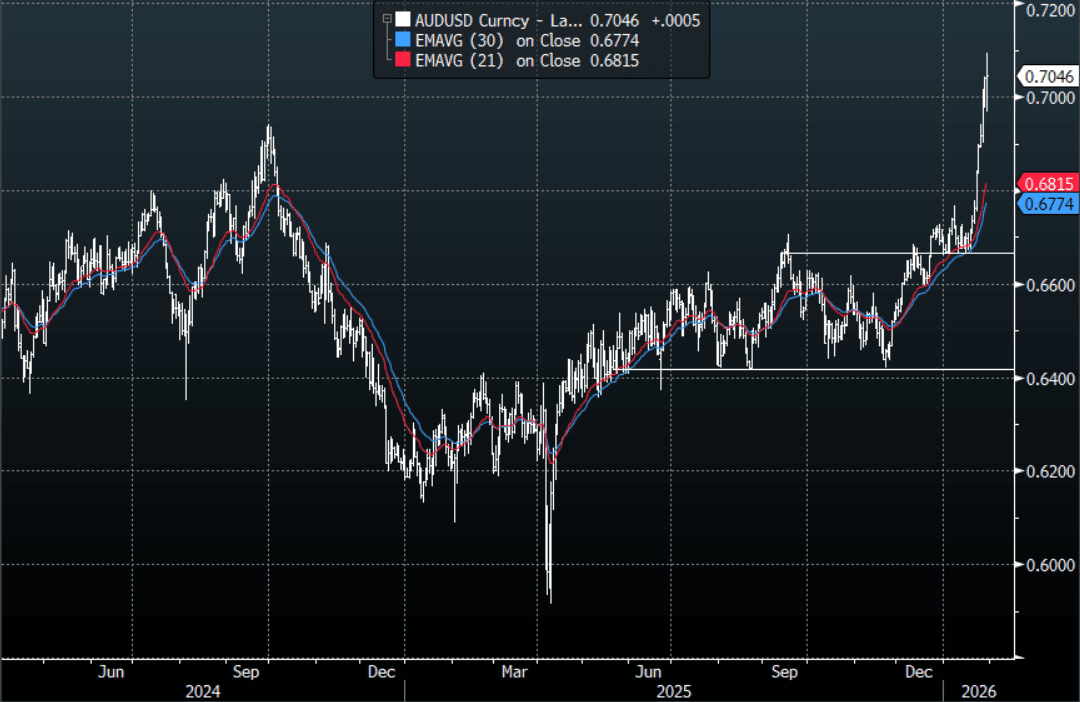
Source: MNI - Market News/Bloomberg Finance L.P
Want to read more?
Find more articles and bullets on these widgets:
Historical bullets
ASIA: Coming Up In Asia-Pac On Wednesday
| 2300BST | 0700HKT | 1000AEDT | South Korea Dec CPI |
| 0130BST | 0930HKT | 1230AEDT | China Dec PMIs |
| 0145BST | 0945HKT | 1245AEDT | China Dec RatingDog PMI mfg |
US TSYS: Tsys Hold Range, Dec Minutes Varying Opinions on Inflation/Labor/Risks
- Treasuries hold modestly mixed after the bell, curves twist steeper with the short end outperforming: 2s10s +2.168 at 67.531, 5s30s +.409 at 113.113.
- Inside session ranges on lighter volumes (TYH6 just over 900k, despite some chunky block sales in 5s and 10s) as those present digest the Dec FOMC minutes release with varying opinions on labor, inflation outlooks and risk metrics.
- TYH6 trades 112-20.5 (-2.5) vs. 112-17 low / 112-25.5 high, 10Y yld at 4.1258% (+.0156). Trend theme remains bearish and a break of 111-29 would confirm a resumption of the bear cycle. This would open 111-19, a Fibonacci projection.
- Key short-term resistance has been defined at 112-31, the Dec 18 high, where a break would undermine a bear theme and signal scope for a stronger recovery instead.
- Markets close early (1300ET; 1600ET Globex) Wednesday for New Years eve, re-open/electronic trade Thursday evening for Friday's order of business. Tomorrow's shortened session sees Weekly Jobless Claims (0830ET). Followed by US Treasury supply: 4W, 8W & 17W bills at 1130ET.
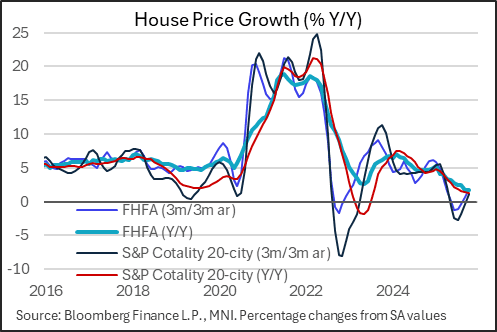
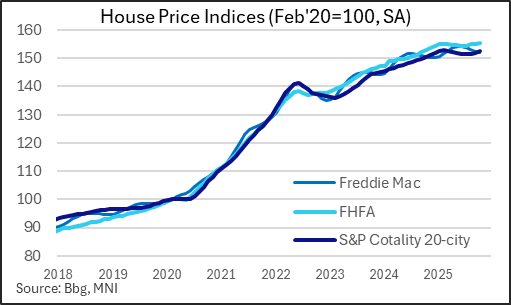
US DATA: House Price Momentum Stabilizes, But Gains Slowing At Elevated Level
House prices picked up in October at the highest sequential rate since January per the S&P Cotality 20-city index, with the 0.32% M/M rise surpassing the 0.1% expected. That's a third consecutive month of gain in the index, and comes alongside a 0.37% M/M gain in the FHFA index for October.
- Monthly changes are volatile, but looking at longer-run measures there appears to be some stability after a weak summer - something we've seen reflected in house sales data and homebuilder sentiment as well. The 3M/3M annualized growth in the S&P index of 1.2% follows 5 consecutive contractions, with the FHFA rising to a 7-month best 1.9%.
- That's best interpreted as a price momentum indicator; on a Y/Y comparison prices are more evidently weak: the 1.7% rise in the S&P / 1.3% in FHFA represent the softest growth rates since 2023 / 2012.
- Of course, prices are up over 50% since the start of the pandemic in 2020 and remain extremely elevated on affordability metrics.
- The latest data continue to show a slowdown in gains rather than an outright softening. For now prices are flat in nominal growth terms and negative vs CPI / wage growth, so hardly strong but also not crashing. But with sales volumes remaining low and few apparent forced sellers, price discovery remains very limited.