AUD: AUD/USD - Drifts Lower, Even With Risk Trading Well
The AUD/USD has had a range of 0.6454 - 0.6480 in the Asia- Pac session, it is currently trading around 0.6455, -0.17%. The AUD has traded heavy for most of our session even with risk trading positively. The AUD bounced nicely off the 0.6400 area but I suspect sellers might return back towards 0.6500/50 initially, though the bounce in equities overnight might suggest the correction I was looking for might not be as imminent as first thought.
- AUSTRALIA DATA: Q2 Spending Volumes Suggest Slight Pickup In Consumption Growth. June household spending printed lower than expected at 0.5% m/m bringing the annual rate to 4.8% up from May’s 4.4% though. Q2 consumption volumes rose 0.7% q/q, third consecutive gain, up from Q1’s 0.5% signalling that private spending in the national accounts on September 3 could be slightly higher than Q1’s 0.4%. This is an area that has disappointed RBA expectations given the growth in real incomes and it is monitoring closely.
- "The ANZ-Roy Morgan Australian consumer confidence rose 3.9 points to 90.6 points in the week of July 28 to Aug. 3, its highest since May 2022, driven by an increase across all the subindices, ANZ reported Tuesday." - MTN
- Options : Closest significant option expiries for NY cut, based on DTCC data: 0.6550(AUD831m), 0.6600(AUD847m). Upcoming Close Strikes : 0.6500(AUD4.16b Aug 8), 0.6600(AUD1.97b Aug 7), 0.6800(AUD1.72b Aug 7) - BBG
- CFTC Data shows Asset managers reduced their shorts slightly -49183(Last -53959), the Leveraged community added to their own shorts -13997(Last -12010).
- AUD/JPY - Asia-Pac range 94.95 - 95.29, Asia is trading around 95.00. The pair failed on multiple attempts above 97.00 and has moved swiftly back to test its first support toward the 95.00 area. Like the rest of the crosses the price action stands out in that it has not benefited at all from the strong bounce in risk overnight. There should be sellers around the 96.00/96.50 area initially.
Fig 1: AUD/USD spot Daily Chart
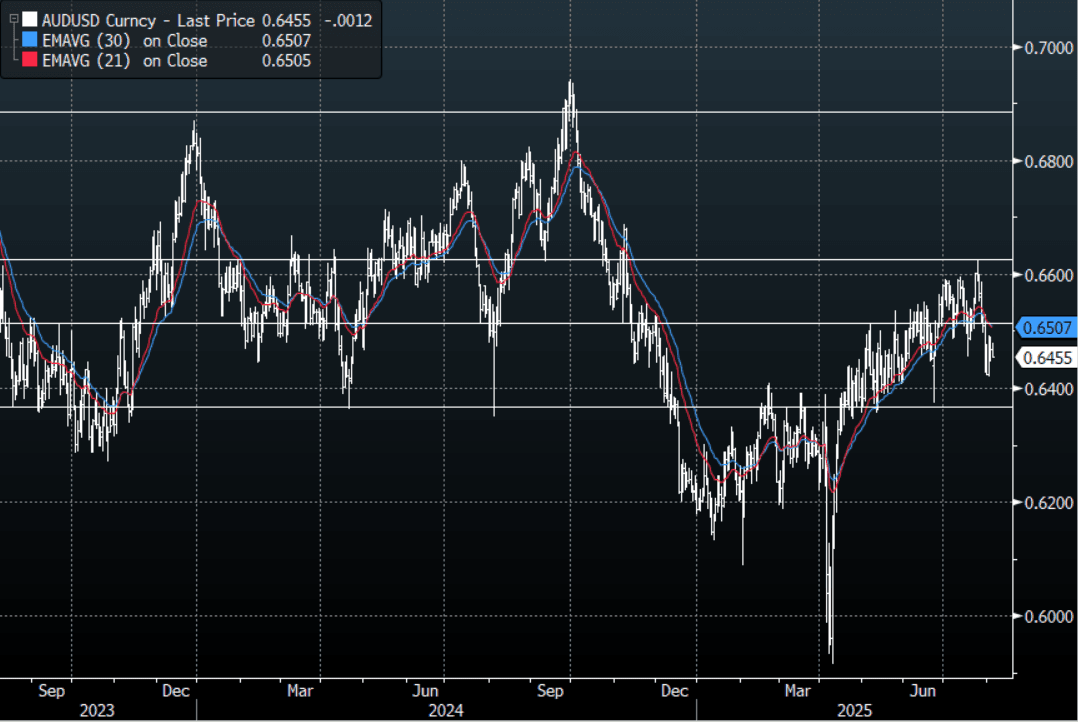
Source: MNI - Market News/Bloomberg Finance L.P
Want to read more?
Find more articles and bullets on these widgets:
Historical bullets
USDCAD TECHS: Trend Outlook Remains Bearish
- RES 4: 1.4111 High Apr 4
- RES 3: 1.4016 High May 12 and 13 and a key resistance
- RES 2: 1.3920 High May 21
- RES 1: 1.3674/3776 20- and 50-day EMA values
- PRICE: 1.3607 @ 16:12 BST Jul 4
- SUP 1: 1.3557 Low Jul 03
- SUP 2: 1.3540 Low Jun 16 and the bear trigger
- SUP 3: 1.3503 1.618 proj of the Feb 3 - 14 - Mar 4 price swing
- SUP 4: 1.3473 Low Oct 2 2024
The trend needle in USDCAD points south and this week’s move down reinforces current conditions. S/T gains between Jun 16 - 23 appear to have been corrective. Key support and the bear trigger is 1.3540, Jun 16 low. Clearance of this level would resume the downtrend and open 1.3503, a Fibonacci projection. Pivot resistance is at the 50-day EMA, at 1.3776. A clear break of this average would signal scope for a stronger recovery.
AUDUSD TECHS: Bull Cycle Remains In Play
- RES 4: 0.6700 76.4% retracement of the Sep 30 ‘24 - Apr 9 bear leg
- RES 3: 0.6688 High Nov 7 ‘24
- RES 2: 0.6603 High Nov 11 ‘24
- RES 1: 0.6590 High Jul 01
- PRICE: 0.6548 @ 16:05 BST Jul 04
- SUP 1: 0.6521 20-day EMA
- SUP 2: 0.6468/6373 50-day EMA / Low Jun 23 and a reversal trigger
- SUP 3: 0.6357 Low May 12
- SUP 4: 0.6275 Low Apr 14
The trend set-up in AUDUSD remains bullish and the pair is holding on to its recent gains. The latest break higher maintains the bullish price sequence of higher highs and higher lows, the definition of an uptrend. Moving average studies are in a bull-mode position, highlighting a dominant uptrend. Sights are on 0.6603 next, the Nov 11 2024 high. Key short-term support has been defined at 0.6373, the Jun 23 low.
EURJPY TECHS: Northbound
- RES 4: 171.88 High Jul 19 ‘24
- RES 3: 171.28 1.382 proj of the Feb 28 - Mar 18 - Apr 7 price swing
- RES 2: 171.09 High Jul 23 ‘24
- RES 1: 170.61 High Jul 03
- PRICE: 170.22 @ 16:04 BST Jul 04
- SUP 1: 169.04 Low Jul 02
- SUP 2: 167.87 20-day EMA
- SUP 3: 167.13 Low Jun 20
- SUP 4: 165.66 50-day EMA
EURJPY traded higher on Thursday resulting in a print above 170.47, the 76.4% retracement of the Jul 11 - Aug 5 sell-off. A clear break of this price point would strengthen bullish conditions and signal scope for extension. This would open 170.28 next, a Fibonacci projection. The trend is overbought, a pullback would unwind this condition. Support to watch lies at 167.87, the 20-day EMA.