AUD: Asia-Pac - AUD/USD Consolidates Around 0.6550 In A Quiet Session
The AUD/USD has had a range of 0.6539 - 0.6551 in the Asia- Pac session, it is currently trading around 0.6545, +0.03%. US yields retraced on Friday night but the USD continues to grind higher challenging levels last seen in July/August. The AUD/USD is back within its recent 0.6400-0.6650 range with the pivot being around 0.6500-0.6550 where I would expect some demand first up, RBA tomorrow but the market is not expecting them to move.
- Ex Alcohol & Tobacco, Q3 Consumer Spending Robust: September household spending was softer than expected rising 0.2% m/m to be up 5.1% y/y after a downwardly-revised 4.9% y/y. Q3 consumption volumes rose 0.2% q/q, the lowest rate since Q3 2024 but the fifth consecutive quarterly rise. Growth continued to recover rising 2.7% y/y, the highest since Q1 2024 but pressured by contracting alcohol & tobacco expenditure. The data point to a continued gradual recovery in private consumption. While the RBA is widely expected to be on hold this week, its consumption forecasts will be monitored for upward revisions.
- Bloomberg is reporting that “Pimco is betting on a rebound in Australian government bonds on expectations the RBA will resume easing next year, favoring the five- to 10-year part of the yield curve.”
- Options : Closest significant option expiries for NY cut, based on DTCC data: 0.6600(AUD 338m). Upcoming Close Strikes : 0.6625(AUD944m Nov 4), 0.6300(AUD600m Nov 4) - BBG
- EUR/AUD - Asia-Pac range 1.7602 - 1.7638, Asia is currently trading around 1.7605. The pair topped out again around 1.7700 and is once again testing the support in the 1.75-1.76 area. I suspect rallies toward 1.7700/1.7800 would now be faded but a break under the 1.7500 area is needed to signal a potential deeper pullback toward the 1.7000 area.
Fig 1: EUR/AUD spot 2H Chart
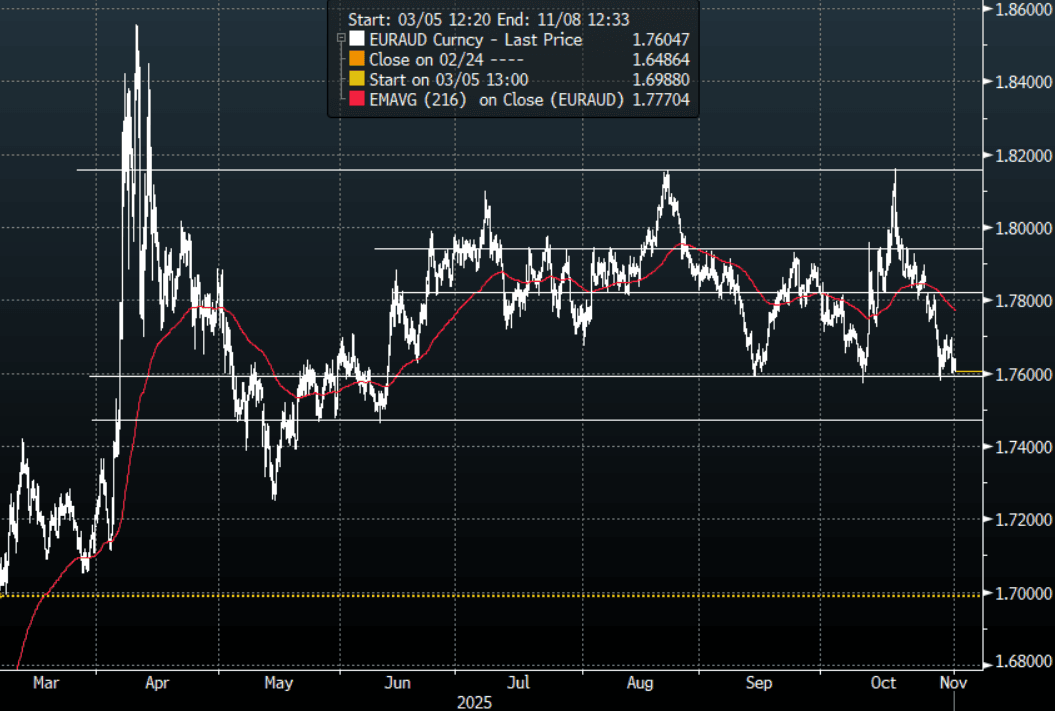
Source: MNI - Market News/Bloomberg Finance L.P
Want to read more?
Find more articles and bullets on these widgets:
Historical bullets
USDCAD TECHS: Fresh Cycle High
- RES 4: 1.4111 High Apr 10
- RES 3: 1.4045 3.0% Upper Bollinger Band
- RES 2: 1.4019 38.2% retracement of the Feb 3 - Jun 16 bear leg
- RES 1: 1.3989 200-dma
- PRICE: 1.3953 @ 16:02 BST Oct 3
- SUP 1: 1.3897/3825 Low Sep 30 / 50-day EMA
- SUP 2: 1.3727 Low Aug 29 and a bear trigger
- SUP 3: 1.3689 Low Jul 28
- SUP 4: 1.3637 Low Jul 25
A bull cycle in USDCAD remains intact and yesterday’s break above the late September’s high, firms the bullish theme. This move higher also maintains the bullish price sequence of higher highs and higher lows. Note too that moving average studies are in a bull-mode position, highlighting a dominant uptrend. Sights are on 1.4019, a Fibonacci retracement point. On the downside, first key support lies at 1.3825, the 50-day EMA.
AUDUSD TECHS: Support Remains Intact For Now
- RES 4: 0.6763 1.382 proj of the Jun 23 - Jul 24 - Aug 21 price swing
- RES 3: 0.6726 1.236 proj of the Jun 23 - Jul 24 - Aug 21 price swing
- RES 2: 0.6660/6707 High Sep 18 / 17 and key resistance
- RES 1: 0.6629 High Sep 30 & Oct 01
- PRICE: 0.6603 @ 16:01 BST Oct 3
- SUP 1: 0.6527/21 61.8% of the Aug 21 - Sep 17 bull leg / Low Sep 26
- SUP 2: 0.6484 76.4% retracement of the Aug 21 - Sep 17 bull leg
- SUP 3: 0.6463/6415 Low Aug 27 / Low Aug 21 / 22 and a bear trigger
- SUP 4: 0.6373 Low Jun 23
The AUDUSD uptrend remains intact and recent weakness appears to have been a correction. Support to watch lies at the 50-day EMA, at 0.6558. A clear break of this average would signal scope for a deeper retracement and expose 0.6527 once again, a Fibonacci retracement. For bulls, a stronger reversal higher would refocus attention on 0.6707, the Sep 17 high. Initial resistance to watch is 0.6629, the Sep 30 and Oct 1 high.
US TSYS/SUPPLY: September's Coupon Auctions Were Generally Solid (2/2)
September’s coupon auctions were generally solid, with three lines trading through, two coming out on the screws and two tailing slightly.
- Looking through the lens of MNI’s Relative Strength Indicator (RSI), five lines saw positive readings while two saw negative readings.
- The 3-year sale was the strongest auction of the month according to MNI’s RSI. The 3-year line traded through 0.7bps, the largest stop through in seven months. Meanwhile, the primary dealer take-up was just 8.4%, the lowest on record (data going back to 2003).
- The weakest sale of the month was the last – the 7-year line. This line saw the second consecutive 0.5bp tail, with the 12.0% primary dealer take-up above August’s 9.8% and July’s record low 4.1%.
September Auction Review:
- 2Y Note on-the-screws: 3.571% vs. 3.571% WI.
- 2Y FRN: 0.200% high margin vs. 0.195% prior
- 3Y Note trade-through: 3.485% vs. 3.492% WI.
- 5Y Note tail: 3.710% vs 3.709% WI.
- 7Y Note tail: 3.953% vs. 3.948% WI.
- 10Y Note trade-through: 4.033% vs. 4.047% WI.
- 10Y TIPS: 1.734% high yield vs. 1.985% prior
- 20Y Bond trade-through: 4.613% vs 4.615% WI.
- 30Y Bond on-the-screws: 4.651% vs. 4.651% WI.
