JGB TECHS: (Z5) Cycle Lows
- RES 3: 140.08 - High Jun 13
- RES 2: 139.05 - High Aug 4
- RES 1: 137.30 - High Sep 8 and key short-term resistance
- PRICE: 134.14 @ 15:06 GMT Dec 04
- SUP 1: 134.03 - Low Dec 04
- SUP 2: 133.77 - 3.0% Lower Bollinger Band
- SUP 3: 133.50 - 1.0% 10-dma envelope
Prices traded to new pullback and cycle lows again Thursday, weighed by building expectations of a December BoJ rate hike and a breach of support in futures prices. This affirms the firm downtrend that’s dominated prices since mid-September, and prices will need to challenge resistance before signaling any broader reversal. Key short-term resistance has been defined at 137.30, the Sep 8 high.
Want to read more?
Find more articles and bullets on these widgets:
Historical bullets
US STOCKS: Russell Index - Ugly Price Action Threatens A Move Back Below 2400
The Russell 2000 overnight range was 2427.34 - 2457.12, closing -1.78%. The Russell 2000 took another leg lower yesterday as the risk backdrop turned negative. The price action above 2500 does not look great and should the unwind in risk start to gain momentum small caps could come under some serious pressure. The bulls will be looking for dips to be supported and hoping the 2400 area continues to hold. The risk is a break sub 2400 which would indicate the move higher was a false break and could signal a deeper pullback. Should this level break the first target would be toward the 2250-2300 area.
- Lance Roberts wrote on X that “Wall Street continues to expect a massive improvement in earnings for small cap companies after several years of weak growth. Notably, that weak earnings growth occurred during a strong economic environment. Given that the forward outlook for the economy is weakening, those expectations may be disappointed.”
Fig 1: Russell 2000 Weekly Chart
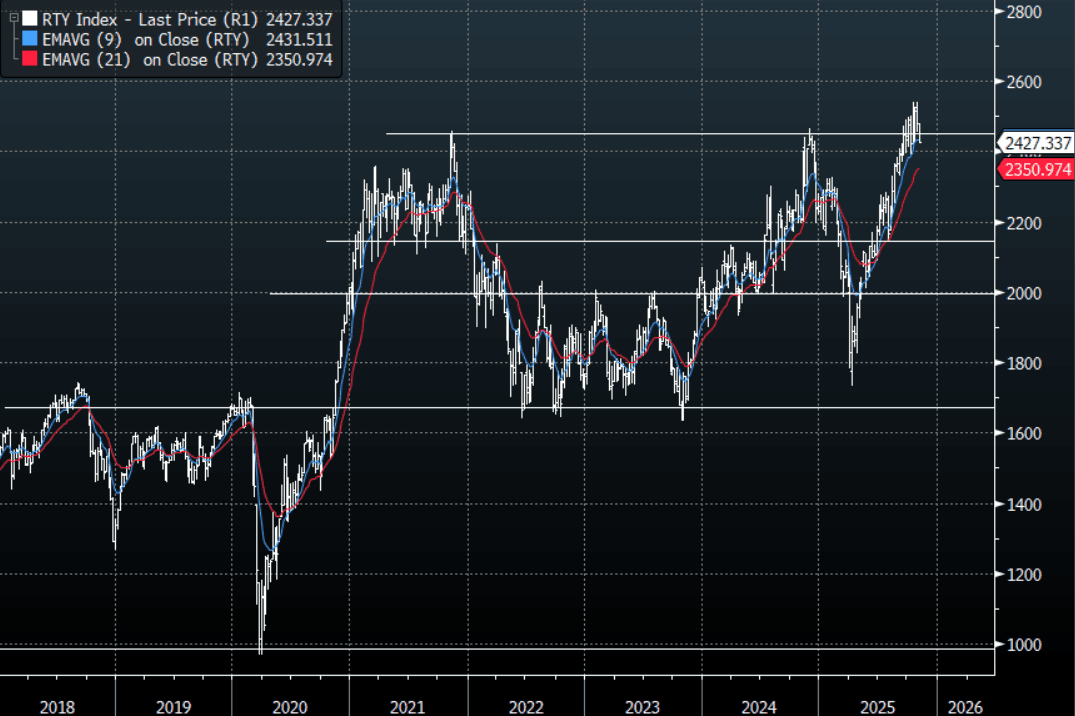
Source: MNI - Market News/Bloomberg Finance L.P
US STOCKS: S&P(ESZ5) - Breaks 6850 And Accelerates Lower As Risk Tumbles
The S&P(ESZ5) overnight range was 6786.25 - 6849.25, SPX closed -1.17%, Asia is currently trading around 6800.00. The Crypto market again proved to be the canary in the coal mine yesterday moving way ahead of everything else. The E-Mini’s turned lower in Asia and once it broke its support around the 6850 area it quickly accelerated lower as risk tumbled across the board. This morning has seen stocks open slightly lower, E-minis(S&P) -0.10%, NQZ5 -0.20%. The move higher has looked overdone for a while so this pullback has been coming, is it more than that ? There are some calling this the top in the bubble but my experience tells me that even though this pullback should have more to go, I would not be writing off the stock market just yet and suspect we find demand on dips as we head into year-end.
- The first support is back toward 6550-6650 and if that breaks it could signal a deeper correction back to the more important 6300-6350 support zone. I suspect for now rallies will be sold into as some positions are reduced.
- Tracy Shuchart posted on X that “Goldman’s Flow specialist Cullen Morgan Sees CTAs Selling Over The Coming Weeks. “CTAs will be small sellers of equities under every scenario over the coming week, that would follow $1.2 billion of global stock disposals by this group last week, positioning is still high, in the 94% percentile.” Morgan writes in a note to clients. “In the event of a significant decline in stocks this week, the fund group could reduce exposure by as much as $32 billion.”
Fig 1: S&P 500 Index Daily Chart
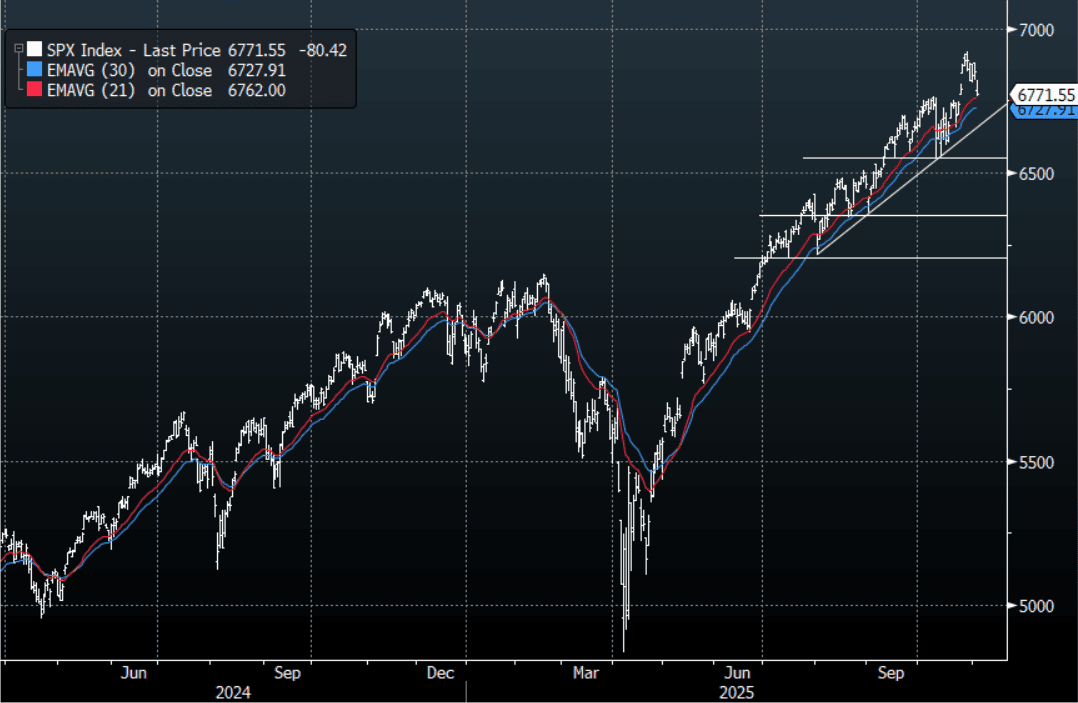
Source: MNI - Market News/Bloomberg Finance L.P
AUSSIE BONDS: ACGB Mar-36 Supply Faces Similar Yield But A Flatter Curve
The Australian Office of Financial Management (AOFM) will today sell A$1200mn of the 4.25% 21 March 2036 bond. The line was last sold on 8 October 2025 for A$1200mn. This new line was sold by syndication on 5 February 2025 for A$15.0bn. Bidding at today’s auction is likely to be shaped by several key factors:
- The outright yield is roughly the same as the previous auction level and about 20bps below the late February peak.
- However, the 3/10 yield curve is flatter than the previous auction level and sits around 40bps flatter than its recent high.
- Sentiment toward longer-dated global bonds remains uncertain.
- This bond is included in the XM futures basket, which may support demand.
- Overall, firm pricing is still anticipated at today’s auction, given the higher yields and other favourable factors.
- Results are due at 0000 GMT / 1100 AEST.