JGB TECHS: (Z5) Cycle Lows
- RES 3: 140.08 - High Jun 13
- RES 2: 139.05 - High Aug 4
- RES 1: 137.30 - High Sep 8 and key short-term resistance
- PRICE: 134.58 @ 16:30 GMT Dec 02
- SUP 1: 134.38 - Low Dec 01 & Cycle Low
- SUP 2: 134.01 - 3.0% Lower Bollinger Band
- SUP 3: 133.72 - 1.0% 10-dma envelope
Prices traded to new pullback and cycle lows Monday, weighed by building expectations of a December BoJ rate hike and a breach of support in futures prices. This affirms the firm downtrend that’s dominated prices since mid-September, and prices will need to challenge resistance before signaling any broader reversal. Key short-term resistance has been defined at 137.30, the Sep 8 high.
Want to read more?
Find more articles and bullets on these widgets:
Historical bullets
JGB TECHS: (Z5) Tilts Higher
- RES 3: 140.08 High Jun 13
- RES 2: 139.05 High Aug 4
- RES 1: 137.30 - High Sep 8 and key short-term resistance
- PRICE: 135.96 @ 16:17 GMT Oct 31
- SUP 1: 135.61 - Low Oct 08
- SUP 2: 135.39 - 1.618 proj of the Aug 4 - Sep 2 - Sep 8 swing (cont.)
- SUP 3: 134.69 - 2.000 proj of the Aug 4 - Sep 2 - Sep 8 swing (cont.)
Prices started last week well, growing the gap with next support into the 135.61 Oct 08 low. Despite this stability, prices remain inside the firm downtrend that’s dominated prices since mid-September, and prices will need to challenge resistance before signaling any broader reversal. Key short-term resistance has been defined at 137.30, the Sep 8 high. Further weakness would open 135.39 next, a Fibonacci projection.
US STOCKS: S&P(ESZ5) - Fails To Extend Higher On Better Earnings
The S&P(ESZ5) Friday night range was 6843.50 - 6918.50, SPX closed +0.26%, Asia is currently trading around 6890.00. The E-Mini’s chopped around sideways on Friday unable to gain push higher after much better than expected results from both Amazon and Apple. This morning has seen stocks open higher, E-minis(S&P) +0.20%, NQZ5 +0.20%. The market is clearly in a powerful uptrend, though there are signs of some short-term exhaustion and most of the stubborn shorts have been forced back into the market as data shows active managers are back to being 100% invested in the stock market.
- Barchart on X highlights how “Warren Buffett's Berkshire Hathaway has now dumped stocks for 12 consecutive quarters, the longest selling streak in its history. It is now sitting on an all-time high $382 Billion in Cash, enough to buy 477 companies in the S&P 500.” See Graph Below
Fig 1: Berkshire Sells Stocks For The 12th Quarter
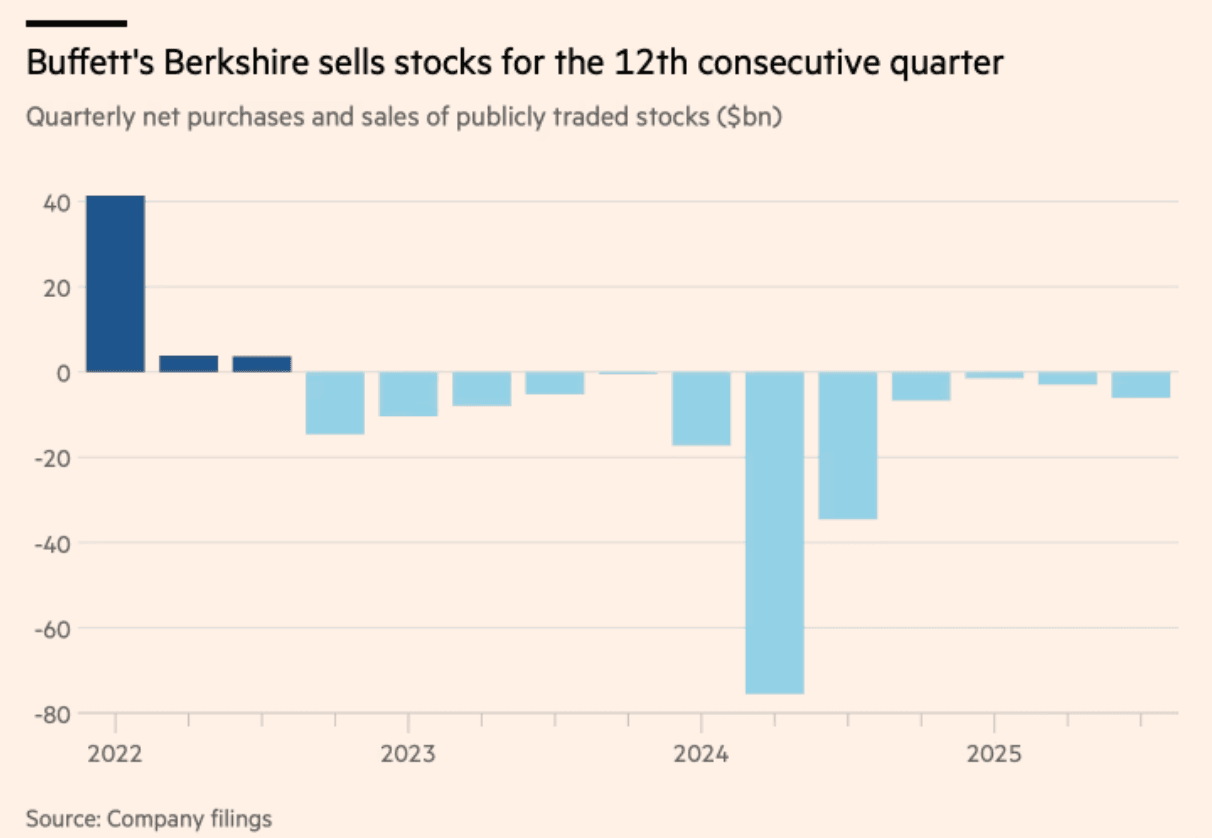
Source: MNI - Market News/@Barchart
GOLD: Gold Cautious On Uncertain Fed Outlook & Changed US-China Trade Relations
Gold prices were moderately lower on Friday but finished above $4000/oz. They fell to a low of $3972.71 but finished at $4002.92 to be down 0.5% on the day, as the US dollar strengthened (BBDXY +0.2%), and 2.7% on the week. Bullion returned to trade above $4000 following the meeting between presidents Trump and Xi on Thursday. While Trump sounded very positive, the one-year pause created scepticism that trade relations will return to where they were, which has supported gold prices.
- Gold approached the 50-day EMA at $3853.2 on Friday after breaking through support at $3886.6. If it clears the 50-day EMA, then the short-term bear theme would be strengthened.
- China has removed its retail gold tax break which is likely to reduce demand.
- Bloomberg observes that there were outflows from gold ETFs for six straight days until Thursday. Westpac believes that this is contributing to gold’s correction and that prices could fall to around $3750.
- Hawkish comments from Fed Chair Powell that a rate cut in December is not a given also pressured non-yield bearing bullion. The OIS market now has around 17bp priced in for the 10 December decision and it was close to 25bp before the 29 October meeting.
- Silver was down 0.5% to $48.689 on Friday to be flat on the week and up 4.4% in October. It reached a high of $49.370 early in the European session and then sold off to $48.384, holding above the 50-day EMA at $45.852.
- Equities were mixed with the S&P up 0.3% but Euro stoxx down 0.7%. Oil prices were slightly higher with Brent +0.5% to $64.58/bbl. Copper rose 0.2%.