CANADA DATA: Trade Data Keeps Q2 GDP On Track For A Negative Reading
The slightly smaller-than-expected trade deficit in June keeps Q2 GDP on course to print slightly negative when it's released at the end of the month (Aug 29).
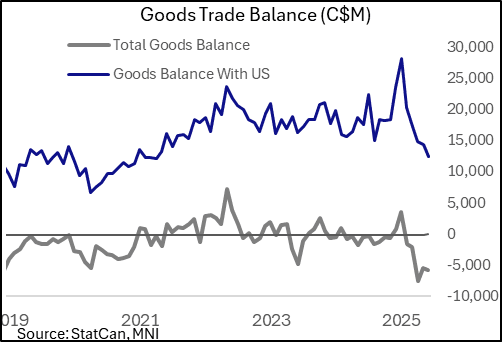
- June data released by StatCan Tuesday showed the goods deficit widened slightly from a revised figure: at C$5.9B (C$6.3B expected), it was up from C$5.5B prior (rev from C$5.9B). Exports were up 0.9% M/M after 2.0%, rising largely thanks to energy shipments, with imports up for the first time in 4 months (1.4%) due to a one-off factor (StatCan: "in large part the result of an increase in imports of industrial machinery, equipment and parts, for which a one-time high-value shipment was reported in June. Excluding this product section, total imports were down 1.9%"). In volume terms, exports were down 0.6% M/M with imports up 2.0%.
- For the quarter, the services account posted a deficit of C$1.96B in nominal terms, combining with goods' C$19.0B for a grand total of just under $21B - easily a quarterly record.
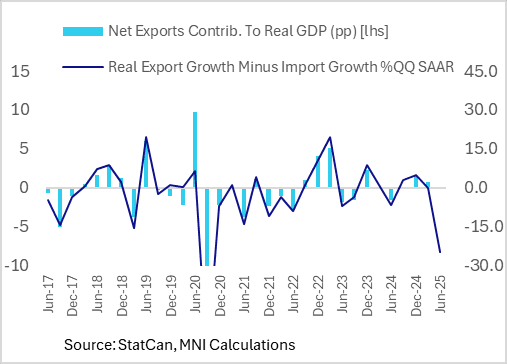
- On a volumes basis, exports fell 31% Q/Q SAAR on the quarter with imports down 6%. In this sense from a GDP perspective, net exports could subtract 7+ percentage points from the overall GDP growth figure (see chart). Consensus is for a -0.5% Q/Q SAAR reading, after +2.2% in Q1.
- The Bank of Canada's latest Monetary Policy Report has a -1.5% Q/Q SAAR GDP estimate for Q2 which looks pessimistic versus the monthly industry GDP which is closer to flat. However the BOC assumption includes a -6.8pp contribution from net exports (-10pp exports, +3.2pp imports) which isn't reflected in the industry estimate, which may in fact be boosted by the aforementioned industrial machinery investment even as overall GDP is weighed down by large net imports.
- The pullback will be transitory in some respects, even if the BOC expects the jump in cross-border tariffs to permanently impair Canadian output. The BOC published in its "current tariff" outlook scenario: "After falling sharply in the second quarter due to tariffs, exports stabilize in the second half of 2025. They increase modestly over the rest of the scenario horizon as Canadian exporters adjust to the new trade environment. Non-commodity exports remain well below their pre-tariff levels, reflecting the permanent damage done by US tariffs".
Want to read more?
Find more articles and bullets on these widgets:
Historical bullets
USDCAD TECHS: Trend Outlook Remains Bearish
- RES 4: 1.4111 High Apr 4
- RES 3: 1.4016 High May 12 and 13 and a key resistance
- RES 2: 1.3920 High May 21
- RES 1: 1.3674/3776 20- and 50-day EMA values
- PRICE: 1.3607 @ 16:12 BST Jul 4
- SUP 1: 1.3557 Low Jul 03
- SUP 2: 1.3540 Low Jun 16 and the bear trigger
- SUP 3: 1.3503 1.618 proj of the Feb 3 - 14 - Mar 4 price swing
- SUP 4: 1.3473 Low Oct 2 2024
The trend needle in USDCAD points south and this week’s move down reinforces current conditions. S/T gains between Jun 16 - 23 appear to have been corrective. Key support and the bear trigger is 1.3540, Jun 16 low. Clearance of this level would resume the downtrend and open 1.3503, a Fibonacci projection. Pivot resistance is at the 50-day EMA, at 1.3776. A clear break of this average would signal scope for a stronger recovery.
AUDUSD TECHS: Bull Cycle Remains In Play
- RES 4: 0.6700 76.4% retracement of the Sep 30 ‘24 - Apr 9 bear leg
- RES 3: 0.6688 High Nov 7 ‘24
- RES 2: 0.6603 High Nov 11 ‘24
- RES 1: 0.6590 High Jul 01
- PRICE: 0.6548 @ 16:05 BST Jul 04
- SUP 1: 0.6521 20-day EMA
- SUP 2: 0.6468/6373 50-day EMA / Low Jun 23 and a reversal trigger
- SUP 3: 0.6357 Low May 12
- SUP 4: 0.6275 Low Apr 14
The trend set-up in AUDUSD remains bullish and the pair is holding on to its recent gains. The latest break higher maintains the bullish price sequence of higher highs and higher lows, the definition of an uptrend. Moving average studies are in a bull-mode position, highlighting a dominant uptrend. Sights are on 0.6603 next, the Nov 11 2024 high. Key short-term support has been defined at 0.6373, the Jun 23 low.
EURJPY TECHS: Northbound
- RES 4: 171.88 High Jul 19 ‘24
- RES 3: 171.28 1.382 proj of the Feb 28 - Mar 18 - Apr 7 price swing
- RES 2: 171.09 High Jul 23 ‘24
- RES 1: 170.61 High Jul 03
- PRICE: 170.22 @ 16:04 BST Jul 04
- SUP 1: 169.04 Low Jul 02
- SUP 2: 167.87 20-day EMA
- SUP 3: 167.13 Low Jun 20
- SUP 4: 165.66 50-day EMA
EURJPY traded higher on Thursday resulting in a print above 170.47, the 76.4% retracement of the Jul 11 - Aug 5 sell-off. A clear break of this price point would strengthen bullish conditions and signal scope for extension. This would open 170.28 next, a Fibonacci projection. The trend is overbought, a pullback would unwind this condition. Support to watch lies at 167.87, the 20-day EMA.