USDCAD TECHS: Support Remains Exposed
- RES 4: 1.4200 Round number resistance
- RES 3: 1.4196 Channel top drawn from Jul 23 low
- RES 2: 1.4140/67 High Nov 5 / 50.0% of the Feb 3 - Jun 16 bear leg
- RES 1: 1.4131 High Nov 21
- PRICE: 1.4032 @ 16:21 GMT Nov 27
- SUP 1: 1.4029/3993 Low Nov 27 / 50-day EMA
- SUP 2: 1.3920 Bull channel base drawn from the Jul 23 low
- SUP 3: 1.3888 Low Oct 29 and a key support
- SUP 4: 1.3833 Low Sep 24
The move lower in USDCAD Wednesday once again highlights a short-term bear threat. Attention is on support at the 50-day EMA, at 1.3993. A clear breach of the average would strengthen a bear theme and expose the base of a bull channel at 1.3920. The channel is drawn from the Jul 23 low. On the upside, a resumption of gain would open 1.4140, the Nov 5 high and the next key resistance.
Want to read more?
Find more articles and bullets on these widgets:
Historical bullets
USDCAD TECHS: Corrective Pullback
- RES 4: 1.4200 Round number resistance
- RES 3: 1.4167 50.0% retracement of the Feb 3 - Jun 16 bear leg
- RES 2: 1.4111 High Apr 10
- RES 1: 1.4080 High Oct 16 and the bull trigger
- PRICE: 1.3946 @ 16:39 GMT Oct 28
- SUP 1: 1.3936/3914 Low Oct 28 / 50-day EMA
- SUP 2: 1.3836 Bull channel base drawn from the Jul 23 low
- SUP 3: 1.3769 Low Sep 19
- SUP 4: 1.3727 Low Aug 29 and a bear trigger
USDCAD is in consolidation mode and is trading at its recent lows. The trend condition is bullish and the latest move down is considered corrective. Moving average studies are in a bull-mode position, highlighting a dominant uptrend. A resumption of gains would open 1.4111, the Apr 10 high, and further out, scope is seen for an extension towards 1.4167, a Fibonacci retracement. First key support lies at 1.3914, the 50-day EMA.
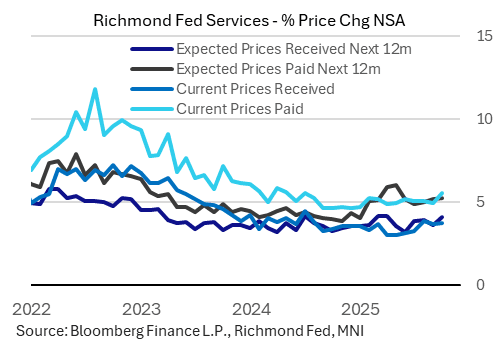
US DATA: Richmond Services Inflation Showing Some Signs Of Picking Up (2/2)
For Richmond Services inflation gauges, expressed in one-year lookback terms, current prices paid jumped to 5.5% from 5.0% to mark a joint-17 month high; meanwhile prior prices received picked up only slightly (to 3.8% from 3.7%, around recent levels).
- Conversely, expected prices received rose 0.5pp to 4.1% for a 6-month high, with expected paid steady at 5.2%.
- This stood out vs fairly flat readings in recent months, as well as the other 4 major regional Fed services surveys that all saw current prices paid gauges fall in October vs September.
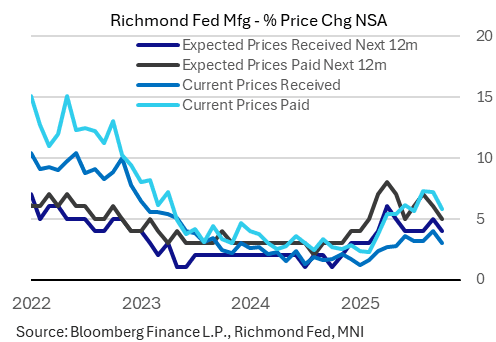
- In manufacturing, though, current prices paid fell to a 3-month low 5.8% (7.2% in the prior 2 months), with received also pulling back (to 3.0%, a 5-month low, from September's 27-month high 4.0%). Expected prices paid and received (next 12 months) also fell 1.0pp apiece, to 5.0%/4.0% respectively.
- This stood out: only Richmond and Dallas saw prices paid diminish vs September (NY, Philly, KC all accelerated on the month).
- Overall we would characterize inflation in regional manufacturing as elevated but diminishing from 2025's highest rates, while services inflation has remained relatively steady but shows some signs of picking up.
AUDUSD TECHS: Recovery Extends
- RES 4: 0.6660/6707 High Sep 18 / 17 and a bull trigger
- RES 3: 0.6646 2.0% 10-dma Envelope
- RES 2: 0.6629 High Sep 30 & Oct 01 and key short-term resistance
- RES 1: 0.6586 High Oct 28
- PRICE: 0.6584 @ 16:05 GMT Oct 28
- SUP 1: 0.6440 Low Oct 14
- SUP 2: 0.6415 Low Aug 21 / 22 and a bear trigger
- SUP 3: 0.6373 Low Jun 23
- SUP 4: 0.6357 Low May 12
Tuesday gains in AUDUSD put the price through resistance into the 0.6574 key Fib retracement, tilting the near-term outlook bullish toward 0.6629 resistance. Attention remains on the Oct 14 reversal pattern - a hammer candle. It signals the end of the bear cycle that started Sep 17. The pair has traded through the 50-day EMA - a bullish development. Key support lies at 0.6440, the Oct 14 low. A break of this level would cancel the reversal pattern and reinstate a bear threat.