USDCAD TECHS: Southbound
Jan-29 21:00
* RES 4: 1.3929 High Jan 16 and a reversal trigger * RES 3: 1.3879 High Jan 20 * RES 2: 1.3831 50-da...
Want to read more?
Find more articles and bullets on these widgets:
Historical bullets
US TSYS: Tsys Hold Range, Dec Minutes Varying Opinions on Inflation/Labor/Risks
Dec-30 20:35
- Treasuries hold modestly mixed after the bell, curves twist steeper with the short end outperforming: 2s10s +2.168 at 67.531, 5s30s +.409 at 113.113.
- Inside session ranges on lighter volumes (TYH6 just over 900k, despite some chunky block sales in 5s and 10s) as those present digest the Dec FOMC minutes release with varying opinions on labor, inflation outlooks and risk metrics.
- TYH6 trades 112-20.5 (-2.5) vs. 112-17 low / 112-25.5 high, 10Y yld at 4.1258% (+.0156). Trend theme remains bearish and a break of 111-29 would confirm a resumption of the bear cycle. This would open 111-19, a Fibonacci projection.
- Key short-term resistance has been defined at 112-31, the Dec 18 high, where a break would undermine a bear theme and signal scope for a stronger recovery instead.
- Markets close early (1300ET; 1600ET Globex) Wednesday for New Years eve, re-open/electronic trade Thursday evening for Friday's order of business. Tomorrow's shortened session sees Weekly Jobless Claims (0830ET). Followed by US Treasury supply: 4W, 8W & 17W bills at 1130ET.
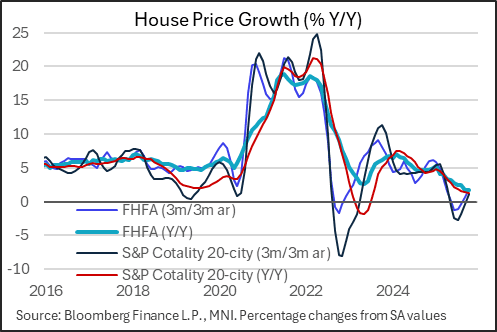
US DATA: House Price Momentum Stabilizes, But Gains Slowing At Elevated Level
Dec-30 20:34
House prices picked up in October at the highest sequential rate since January per the S&P Cotality 20-city index, with the 0.32% M/M rise surpassing the 0.1% expected. That's a third consecutive month of gain in the index, and comes alongside a 0.37% M/M gain in the FHFA index for October.
- Monthly changes are volatile, but looking at longer-run measures there appears to be some stability after a weak summer - something we've seen reflected in house sales data and homebuilder sentiment as well. The 3M/3M annualized growth in the S&P index of 1.2% follows 5 consecutive contractions, with the FHFA rising to a 7-month best 1.9%.
- That's best interpreted as a price momentum indicator; on a Y/Y comparison prices are more evidently weak: the 1.7% rise in the S&P / 1.3% in FHFA represent the softest growth rates since 2023 / 2012.
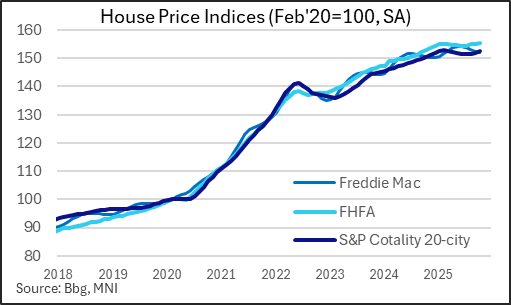
- Of course, prices are up over 50% since the start of the pandemic in 2020 and remain extremely elevated on affordability metrics.
- The latest data continue to show a slowdown in gains rather than an outright softening. For now prices are flat in nominal growth terms and negative vs CPI / wage growth, so hardly strong but also not crashing. But with sales volumes remaining low and few apparent forced sellers, price discovery remains very limited.
US INFLATION: BLS To Use 12-Month Lookback On Housing Prices Next April (2/2)
Dec-30 20:28
The BLS also cleared up a couple of points on future reports that were left uncertain after the latest CPI release.
- Since OER / rents are calculated on a 6-month panel basis, and October 2025 was not collected and assumed to show zero housing inflation, one lingering question was how the BLS would assess inflation in April 2026 (whose 6-month lookback month was October 2025). They write that "The 1-month rent change estimated for April 2026 will be atypical: it will essentially be based on the 1/12th root of 12-month change, instead of the 1/6th root of a 6-month change."
- Some analysts had seen a sizeable jump in OER/rents in April 2026 due to the one-year lookback, assuming that the BLS would use a 1/6th root as normal. Instead the BLS will use the 1/12th root, so the impact should be mitigated (though either way April 2026 housing inflation readings will be unusual).
- Additionally for various measures they will not publish 2-month percentage change readings: "For December 2025, BLS will not publish 2-month percent changes for cities on a bi-monthly, even-month publication schedule because the October 2025 index levels were not published. BLS carried forward all survey prices collected on a bi-monthly, even-month schedule from August 2025 to October 2025. However, 2-month percent change for a few indexes entirely composed of non-survey data will be published."
- This impacts a variety of non-housing inflation categories that are largely non-volatile. To explain: the BLS surveys New York, Los Angeles and Chicago prices monthly, but cities outside of those are surveyed bimonthly (divided into cities that are surveyed in odd months and others in even months). More here under "Repricing and quality adjustment" (link).
- It's not known how much of each price category comes from the bimonthly sample, so the impact on categories and overall inflation is also difficult to ascertain.
- Some analysts had expected that some December bimonthly inflation rates would be skewed higher because they would compare December prices to those carried forward from August given that October wasn't available, but it appears they will simply exclude that subset of city data altogether.