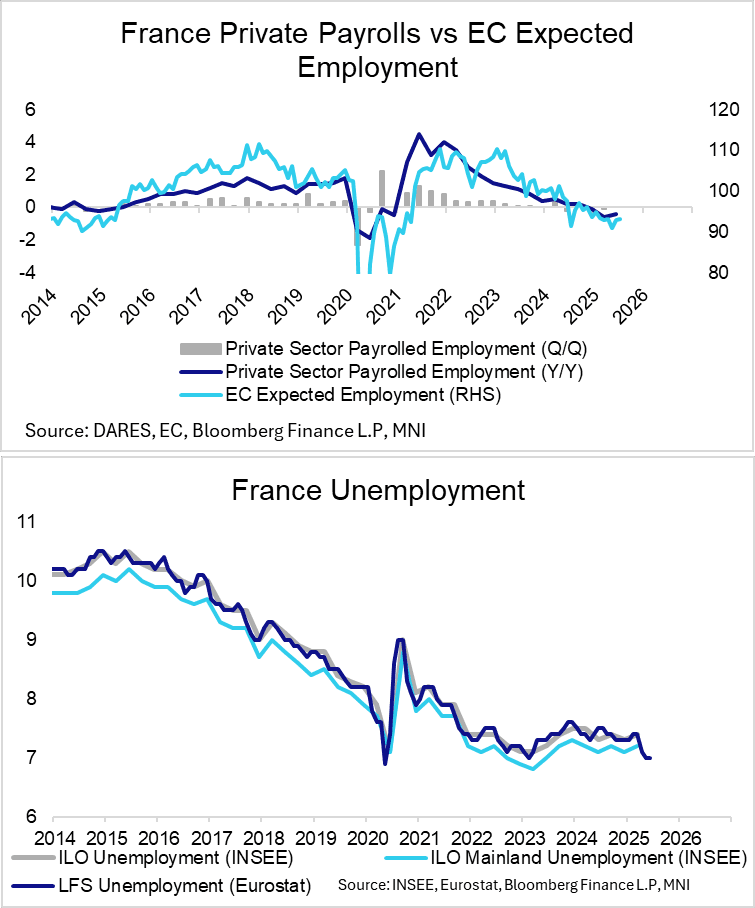
FRANCE DATA: Sequential Private Employment Growth Remains Tepid
French private payrolled employment growth was flat in Q2, according to INSEE’s flash data. That’s a marginal improvement from the -0.1% Q/Q in Q1 and -0.4% Q/Q in Q4 2024. However, on an annual basis private payrolls remain down 0.4% Y/Y.
- The EC’s expected employment indicator has bottomed out in recent months (low of 91.0 in May, rising to 92.9 in June and 93.2 in July), but further data is needed to signal scope for a return to positive sequential employment growth.
- Across industries, agriculture (-1.6% Q/Q), industry (-0.1% Q/Q) and construction (-0.5% Q/Q) saw sequential falls in payrolled employment in Q2. Meanwhile, market-based tertiary sector employment growth was flat, with non-market tertiary sector growth rising 0.2% Q/Q.
Want to read more?
Find more articles and bullets on these widgets:
Historical bullets
USDCAD TECHS: Trend Structure Remains Bearish
- RES 4: 1.3920 High May 21
- RES 3: 1.3862 High May 29
- RES 2: 1.3798 High Jun 23
- RES 1: 1.3667/3769 20- and 50-day EMA values
- PRICE: 1.3649 @ 08:09 BST Jul 7
- SUP 1: 1.3557 Low Jul 03
- SUP 2: 1.3540 Low Jun 16 and the bear trigger
- SUP 3: 1.3503 1.618 proj of the Feb 3 - 14 - Mar 4 price swing
- SUP 4: 1.3473 Low Oct 2 2024
The trend needle in USDCAD continues to point south and last week’s move down reinforces current conditions. S/T gains between Jun 16 - 23 appear to have been corrective. Sights are on key support and the bear trigger at 1.3540, Jun 16 low. Clearance of this level would resume the downtrend and open 1.3503, a Fibonacci projection. Pivot resistance is at the 50-day EMA, at 1.3769. A clear break of it would signal scope for a stronger recovery.
AUDUSD TECHS: Pullback Appears Corrective
- RES 4: 0.6700 76.4% retracement of the Sep 30 ‘24 - Apr 9 bear leg
- RES 3: 0.6688 High Nov 7 ‘24
- RES 2: 0.6603 High Nov 11 ‘24
- RES 1: 0.6590 High Jul 01
- PRICE: 0.6508 @ 08:03 BST Jul 07
- SUP 1: 0.6500 Intraday low
- SUP 2: 0.6471/6373 50-day EMA / Low Jun 23 and a reversal trigger
- SUP 3: 0.6357 Low May 12
- SUP 4: 0.6275 Low Apr 14
The trend set-up in AUDUSD remains bullish and the latest pullback appears corrective - for now. Recent gains maintain the bullish price sequence of higher highs and higher lows, the definition of an uptrend. Note too that moving average studies are in a bull-mode position, highlighting a dominant uptrend. Sights are on 0.6603 next, the Nov 11 2024 high. Initial firm support to watch is 0.6471, the 50-day EMA.
GILT TECHS: (U5) Monitoring Resistance
- RES 4: 93.76 High Jul 1 and key resistance
- RES 3: 93.41 High Jul 2
- RES 2: 93.26 76.4% retracement of the Jul 1 -2 sell-off
- RES 1: 92.79 High Jul 4
- PRICE: 92.38 @ Close Jul 4
- SUP 1: 92.12/91.63 Low Jul 3 / 2
- SUP 2: 91.50 61.8% retracement of the May 22 - Jul 1 bull leg
- SUP 3: 91.16 Low Feb 2
- SUP 4: 90.97 76.4% retracement of the May 22 - Jul 1 bull leg
Gilt futures faced strong selling pressure on Jul 2. The move down has cancelled a recent bullish theme - price breached the 20-day EMA and traded through a key support at 92.23, the Jun 16 low. The break suggests potential for an extension towards 91.50 next, a Fibonacci retracement. Price action is volatile. Initial resistance to watch is 92.79, the Jul 4 high. A resumption of gains would open the 93.41 high instead.