IRAN: Senior Cleric-'We Are Close To Selecting New Supreme Leader'
State TV reports comments from Ayatollah Ahmad Khatami, Temporary Friday Imam of Tehran and a senior member of the Assembly of Experts, saying that 'Leadership candidates have been identified and we are close to selecting the new supreme leader. The new leader will be chosen at the earliest opportunity, but the current situation is wartime, so we are taking all precautions.'
- As noted earlier (IRAN: Mojtaba Khamenei Survived Strikes, Seen as Possible Next Leader: RTRS), the late Supreme Leader Ayatollah Ali Khamenei's son, Mojtaba, is reported to have survived US/Israeli strikes and is well positioned to be confirmed as the next Iranian leader. The selection of Khamenei's son would not be a knee-jerk reaction. Shortlists from analysts and observers have included his name for many years.
- In a statement earlier today, Israeli Defence Minister Israel Katz said in a statement that the next supreme leader will be an “unequivocal target for elimination" adding, “It does not matter what his name is or where he hides.”
- Katz: "We will continue to act with full force, together with our American partners, to dismantle the regime’s capabilities and create the conditions for the Iranian people to overthrow and replace it.”
- Israeli intelligence in the early stages of the conflict has proved extremely effective in identifying how and when to take out senior targets. It remains to be seen whether such accuracy can be maintained amid the fog of war, and with a much more cautious Iranian high command.
Want to read more?
Find more articles and bullets on these widgets:
Historical bullets
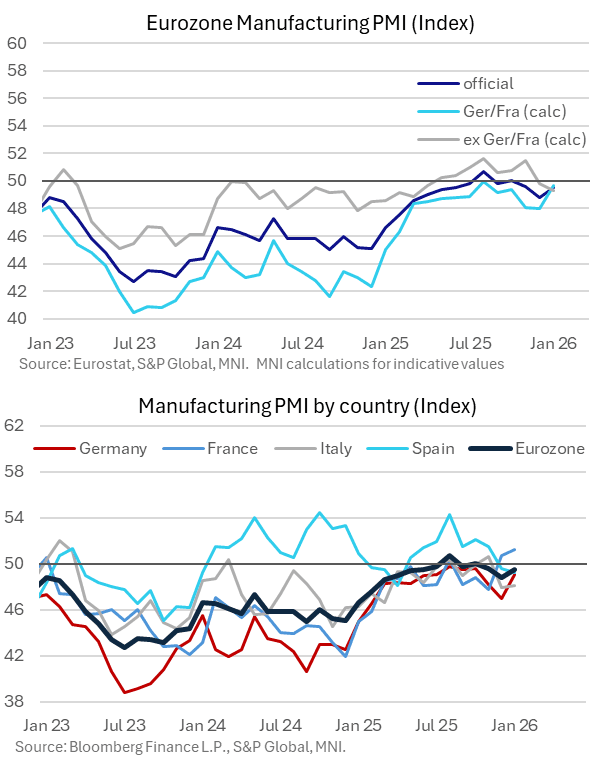
EUROZONE DATA: Weak New Export Order Signals From January Manuf PMIs
The Eurozone January manufacturing PMI was 49.5 (vs 49.4 flash), above December’s 48.8 reading but nonetheless the third consecutive contractionary print. There were weak trends in new export orders (including intraregional trade) across major Eurozone economies.
- We have previously highlighted that EZ merchandise trade has been resilient in the face of US tariffs, with increased intraregional trade offsetting falls in extraregional exports. See here
- However, the PMIs suggest the external sector still represents a downside growth risk in 2026. This will increase the burden on domestic demand to drive the anticipated cyclical recovery.
Some highlights from this morning’s manufacturing PMIs:
- Eurozone: “The volume of new work received by eurozone goods producers fell for a third successive month at the beginning of the year, although the contraction slowed and was only marginal. New export orders likewise decreased, in line with the trend since last July”
- Germany: “New export sales remained in contraction, albeit falling only marginally and at the weakest rate for three months”.
- France: “The level of new work received from external markets decreased solidly during the latest survey period — a contrast from December's uplift. Panellists linked the fall to competition, geopolitical tensions and less interest from clients in key foreign markets such as Germany”.
- Italy: “Challenges persisted on international markets as export sales fell again, but only modestly”.
- Spain: “Panellists reported a hesitancy amongst clients in committing to new contracts and investment. This was the case for both domestic and international clients. With tariffs, a higher euro/US dollar rate, and weak demand from European markets-- also reported by firms, new export orders declined for a fifth month in a row and to the greatest degree since last April”.
COMMODITIES: Gold Continues to Unwind Extreme Overbought Condition
A bull cycle in WTI futures remains intact. However, today’s strong bearish start to this week’s session highlights the beginning of a corrective phase. Attention is on support at the 20-day EMA, at $60.89. The 50-day EMA lies at $59.64. A clear breach of the 50-day average would highlight a stronger reversal and open $58.53, the Jan 20 low. Key resistance and the bull trigger has been defined at $66.48, the Jan 30 high. A sharp sell-off in Gold confirms a top in the long-term trend - for now - and from a short-term perspective, marks an unwinding of the recent extreme overbought condition. The metal has traded through the 20-day EMA, and has pierced the 50-day EMA, at $4546.7. A break of this average would signal scope for a deeper retracement and open $4274.7, the Dec 31 ‘25 low. Initial firm resistance is at 4885.1, today’s intraday high so far.
- WTI Crude down $3.18 or -4.88% at $62.02
- Natural Gas down $0.68 or -15.66% at $3.667
- Gold spot down $177.02 or -3.62% at $4720.75
- Copper down $10.35 or -1.75% at $581.55
- Silver down $3.33 or -3.91% at $82.0401
- Platinum down $119.66 or -5.45% at $2077.58
EQUITIES: Short-Term Weakness for Eurostoxx 50 Futures Considered Corrective
A bull cycle in Eurostoxx 50 futures remains intact and S/T weakness is - for now - considered corrective. The next important support to monitor lies at the 50-day EMA at 5851.01. A clear breach of this average would signal scope for a deeper retracement. Moving average studies are in a bull-mode position, highlighting a dominant uptrend. A resumption of gains would open the key resistance and bull trigger at 6072.00, the Jan 14 / 15 high. The trend in S&P E-Minis is bullish and the pullback from last week’s high is considered corrective. However, note that a doji candle pattern on Jan 28 and a hammer candle on Jan 29, continues to signal scope for a deeper retracement near-term. Today’s move down reinforces the importance of these two patterns. A continuation lower would expose key S/T support at 6814.50, the Jan 21 low. The bull trigger is at 7043.00, the Jan 28 high.
- Japan's NIKKEI closed lower by 667.67 pts or -1.25% at 52655.18 and the TOPIX ended 30.19 pts lower or -0.85% at 3536.13.
- Elsewhere, in China the SHANGHAI closed lower by 102.202 pts or -2.48% at 4015.746 and the HANG SENG ended 611.54 pts lower or -2.23% at 26775.57.
- Across Europe, Germany's DAX trades higher by 33 pts or +0.13% at 24573.19, FTSE 100 lower by 6.95 pts or -0.07% at 10216.39, CAC 40 up 2.39 pts or +0.03% at 8128.92 and Euro Stoxx 50 down 13.2 pts or -0.22% at 5934.61.
- Dow Jones mini down 138 pts or -0.28% at 48870, S&P 500 mini down 39 pts or -0.56% at 6926.75, NASDAQ mini down 216 pts or -0.84% at 25454.