USDCAD TECHS: Sell-Off Extends
- RES 4: 1.4314 61.8% retracement of the Feb 3 - Jun 16
- RES 3: 1.4200 Channel top drawn from Jul 23 low
- RES 2: 1.4140/67 High Nov 5 / 50.0% of the Feb 3 - Jun 16 bear leg
- RES 1: 1.4047/1.4131 20-day EMA / High Nov 21
- PRICE: 1.4032 @ 16:21 GMT Nov 27
- SUP 1: 1.3972 Low Nov 18
- SUP 2: 1.3923 Bull channel base drawn from the Jul 23 low
- SUP 3: 1.3888 Low Oct 29 and a key support
- SUP 4: 1.3833 Low Sep 24
A bear theme in USDCAD remains intact and today’s sell-off reinforces this theme. The pair has traded through the 50-day EMA, at 1.3995. A clear break of this average would signal scope for an extension towards the base of a bull channel at 1.3923. The channel is drawn from the Jul 23 low. On the upside, a reversal higher is required to refocus attention on 1.4140, the Nov 5 high and a key resistance. Initial resistance is 1.4047, the 20-day EMA.
Want to read more?
Find more articles and bullets on these widgets:
Historical bullets
US TSY OPTIONS: US 5yr Put buyer
FVZ5 108.75p, bought for '04 in 2k.
BOC: Monetary Policy Report Returns To Base-Case Forecast
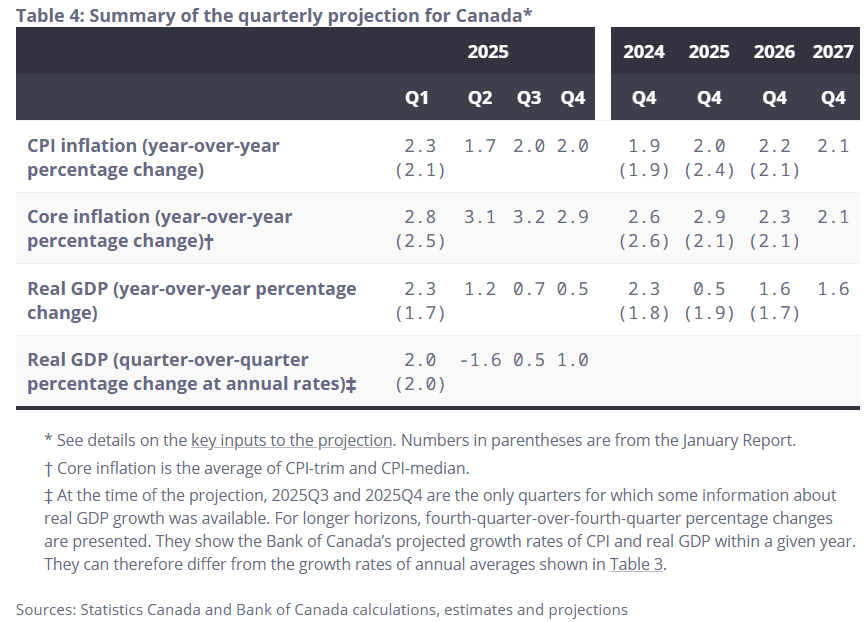
As expected, the BOC's quarterly Monetary Policy Report (MPR) returns to a base-case forecast, after the scenario-based April and July reports. Even so as we cautioned in our meeting preview, we wouldn't put much stock in the new central projections because it was unlikely that the BOC itself would have a high degree of confidence in them (and indeed, the rate decision statement notes of the MPR: "Because US trade policy remains unpredictable and uncertainty is still higher than normal, this projection is subject to a wider-than-usual range of risks.")
- October's forecasts are presented relative to January's, so obviously a lot has changed.
- Versus that report, 2025 GDP is seen slower (1.2% vs 1.8%) as is 2026's (1.1% vs 1.8%), but compared with July's base-case tariff projections the GDP downgrades are minimal (was 1.3% 2025/1.1% 2026 in July). Potential output is seen as substantially lower vs January (2026 between 0.4-1.4%, vs 0.9-2.2% then).
- Inflation forecasts vs July's current tariff scenario are also a little higher, now 2.0% for 2025 (vs 2.3% Jan projection, 1.9% Jul) with 2026 2.1% (2.1% Jan, 2.0% Jul)
- Real GDP is seen picking up from -1.6% Q/Q SAAR in Q2, to +0.5% in Q3 and 1.0% in Q4, the Q3 figure being weaker than in July's current tariff scenario (1.0%), while core inflation is seen steadying out - from 3.1% Y/Y in Q2, to 3.2% in Q3 and 2.9% in Q4 (falling to 2.3% in Q4 2026), a slightly higher profile than seen in July's projections (3.1% in both Q2 and Q3, falling to 2.4% by Q4 2026).
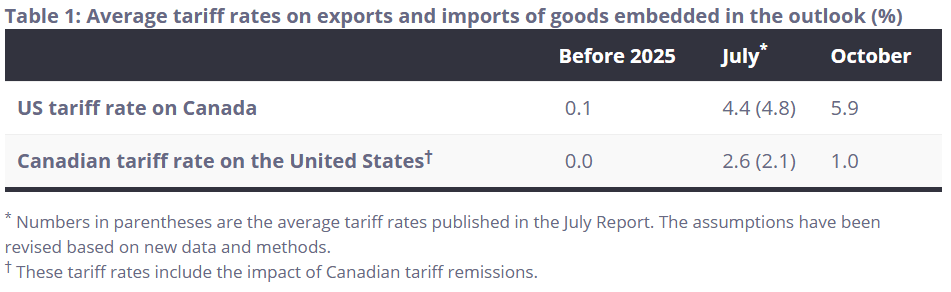
- Among other findings - the average tariff rates overall have obviously risen since pre-2025 amid the US-Canada trade conflict, but "only slightly since the July Report" with Canadian counter-tariffs on the US having been lowered since the July report. - see table. Echoing other estimates we've seen, "If steel, aluminum, motor vehicles and energy are excluded, then 94% of the value of goods entered the United States tariff-free."
EQUITY TECHS: E-MINI S&P: (Z5) Bull Cycle Extends
- RES 4: 7000.00 Psychological round number
- RES 3: 6993.12 3.500 proj of the Aug 20 - 28 - Sep 2 price swing
- RES 2: 6974.04 3.382 proj of the Aug 20 - 28 - Sep 2 price swing
- RES 1: 6953.25 2.000 proj of the Aug 1 - 15 - 20 price swing
- PRICE: 6944.00 @ 14:21 GMT Oct 29
- SUP 1: 6812.25/6765.36 High Oct 9 / 20-day EMA
- SUP 2: 6666.16 50-day EMA
- SUP 3: 6540.25 Low Oct 10 and a key short-term support
- SUP 4: 6506.50 Low Sep 5
The trend condition in S&P E-Minis remains bullish and price has traded higher this week. The fresh cycle high confirms a resumption of the primary uptrend and maintains the bullish price sequence of higher highs and higher lows. The 6900.00 handle has been cleared, opening 6953.25 next, a Fibonacci projection. Initial firm support to watch lies at 6748.48, the 20-day EMA.