CANADA DATA: Precious Metals Obscure Trend Rise In Industrial Product Inflation
Canadian industrial product price pressures continued to run on the hot side in July, keeping IPPI on a rising path though underlying price growth momentum appears to be relatively subdued.
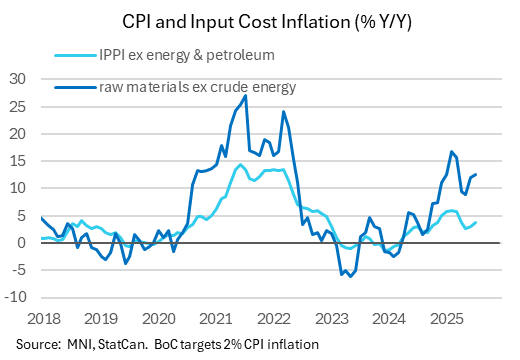
- The overall index (IPPI) rose 2.6% Y/Y in July, the fastest rate since March, with the ex-energy/petroleum products reading up 3.8%, highest since April (energy and petroleum product prices fell 6.7% Y/Y, the 5th consecutive decline, helping relieve upside pressure on the headline index).
- However, the ex-energy readings themselves are exaggerated by a rise in gold prices, which have been inflated due to safe haven/monetary demand as opposed to indicative of underlying industrial demand.
- Per the StatCan report: "The unwrought gold, silver, and platinum group metals, and their alloys (+33.7%) subgroup was the largest contributor to the IPPI's year-over-year gain in July. High prices for gold were mainly supported by strong safe-haven investment demand over the past 12 months. Other key upward contributors included fresh and frozen beef and veal (+16.5%) and softwood lumber (+12.0%)."
- The raw material price index rose 0.8% Y/Y (ex-energy was a 4month high 12.6%), though again this was exaggerated by soaring precious metal prices.
- To be sure, the 0.5% M/M rise was high from a seasonal perspective for a 2nd consecutive month - though this is difficult to make a clear conclusion from this as it follows two lower-than-usual moths in April and May.
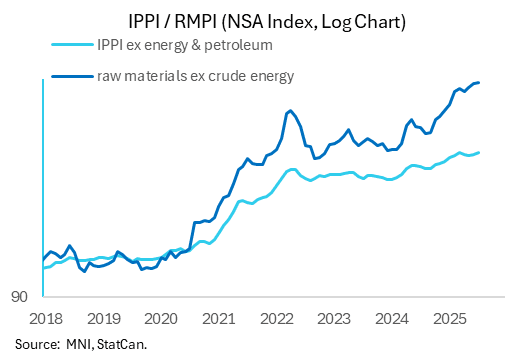
- From a longer-term perspective, there has been a continued rise in the price level of both industrial and raw materials ex-crude energy since late 2023, ending a period of flatlining between 2022-late 2023. These prices tend to steady out for a multi-year period before breaking higher for a couple of years, such as in the pandemic reopening episode. That's started to happen again though the influence of precious metals prices obscures the signal.
Want to read more?
Find more articles and bullets on these widgets:
Historical bullets
USDCAD TECHS: Key Short-Term Resistance Intact For Now
- RES 4: 1.3920 High May 21
- RES 3: 1.3862 High May 29
- RES 2: 1.3798 High Jun 23
- RES 1: 1.3744/74 50-day EMA / High Jul 17
- PRICE: 1.3640 @ 16:03 BST Jul 22
- SUP 1: 1.3631/3557 Low Jul 22 / 03
- SUP 2: 1.3540 Low Jun 16 and the bear trigger
- SUP 3: 1.3503 1.618 proj of the Feb 3 - 14 - Mar 4 price swing
- SUP 4: 1.3473 Low Oct 2 2024
Resistance in USDCAD at 1.3744, the 50-day EMA, remains intact for now. It has been pierced, however, a clear break of it is required to highlight a possible stronger short-term reversal. This would open 1.3798 initially, the Jun 23 high. For now, a bear trend remains in place. A resumption of weakness would refocus attention on key support at 1.3540, the Jun 16 low. Clearance of this level would confirm a resumption of the downtrend.
US TSYS: Tsys Back at July 10 Lvls, Philly Fed Non-Mfg Improves, Costs Elevated
- Treasuries bounced off early Tuesday lows, initially tracking a similar move in German Bunds - before settling into a narrow range near session highs since midmorning.
- The US$ resumed its weakening trend on Tuesday, extending the pullback from last week’s highs to ~1.6% in recent trade, further eroding the cautious recovery that had been seen across the first half of July.
- Tsy Sep'25 10Y futures are +7 at 111-13 after the bell vs. -14.5 high, briefly through resistance at 111-13+, the Jul 10 high. A clear break of this hurdle would highlight a stronger reversal. Key support lies at 110-08+, the low on Jul 14 and 16. A move through this support would reinstate the recent bearish theme.
- The Philadelphia Fed's Nonmanufacturing Business Outlook Survey continued to show improvement in July, though cost pressures remained elevated. The regional current general activity index rose to a 6-month high -10.3 from -25.0 prior. This was the 3rd consecutive improvement since bottoming at -42.7 in April amid tariff policy concerns.
- The Johnson Redbook Retail Sales Index continues to post solid gains, rising 5.1% Y/Y in the week ending Jul 19, fairly steady compared with 5.2% the prior week.
- Look ahead: Wednesday's data limited to MBA Mortgage Applications at 0700ET, Existing Home Sales follow at 1000ET.
AUDUSD TECHS: Support At The 50-Day EMA Remains Exposed
- RES 4: 0.6700 76.4% retracement of the Sep 30 ‘24 - Apr 9 bear leg
- RES 3: 0.6688 High Nov 7 ‘24
- RES 2: 0.6603 High Nov 11 ‘24
- RES 1: 0.6595 High Jul 11 and the bull trigger
- PRICE: 0.6545 @ 16:01 BST Jul 22
- SUP 1: 0.6455 Low Jul 17
- SUP 2: 0.6435 23.6% retracement of the Sep 9 - Jul 11 bull leg
- SUP 3: 0.6373 Low Jun 23 and a bear trigger
- SUP 4: 0.6357 Low May 12
The trend set-up in AUDUSD remains bullish. Support around the 50-day EMA, at 0.6492, has been breached, however, the pair has found support just below the average. A clear break of this EMA would highlight a stronger reversal and signal scope for an extension initially towards 0.6435, a Fibonacci retracement. Key short-term resistance has been defined at 0.6595, clearance of this hurdle would resume the uptrend.