JAPAN DATA: PPI Above Forecast, But Suggests Steady CPI Trend
Earlier Japan PPI data was a touch above forecasts. It rose 0.3%m/m (0.1% was expected and -0.2% was prior), while in y/y terms we rose 2.7%, (2.5% was forecast). This leaves the y/y outcome unchanged on the August outcome. The chart below plots this y/y metric against headline CPI for Japan. At face value, it is consistent with a steady, albeit still elevated inflation backdrop.
- Via our Japan policy team: The index was supported by higher prices for nonferrous metals (+9.6% vs. +6.2% in August) but was weighed down by a smaller increase in agriculture, forestry and fishery products (+30.5% vs. +41.0%). Export prices for automobiles to the U.S. fell 16.3% on a yen basis and 18.8% on a contract currency basis, compared with August’s declines of 19.9% and 20.5%, respectively, suggesting that Japanese carmakers continue to lower export prices, squeezing profits.
Fig 1: Japan PPI & CPI Y/Y
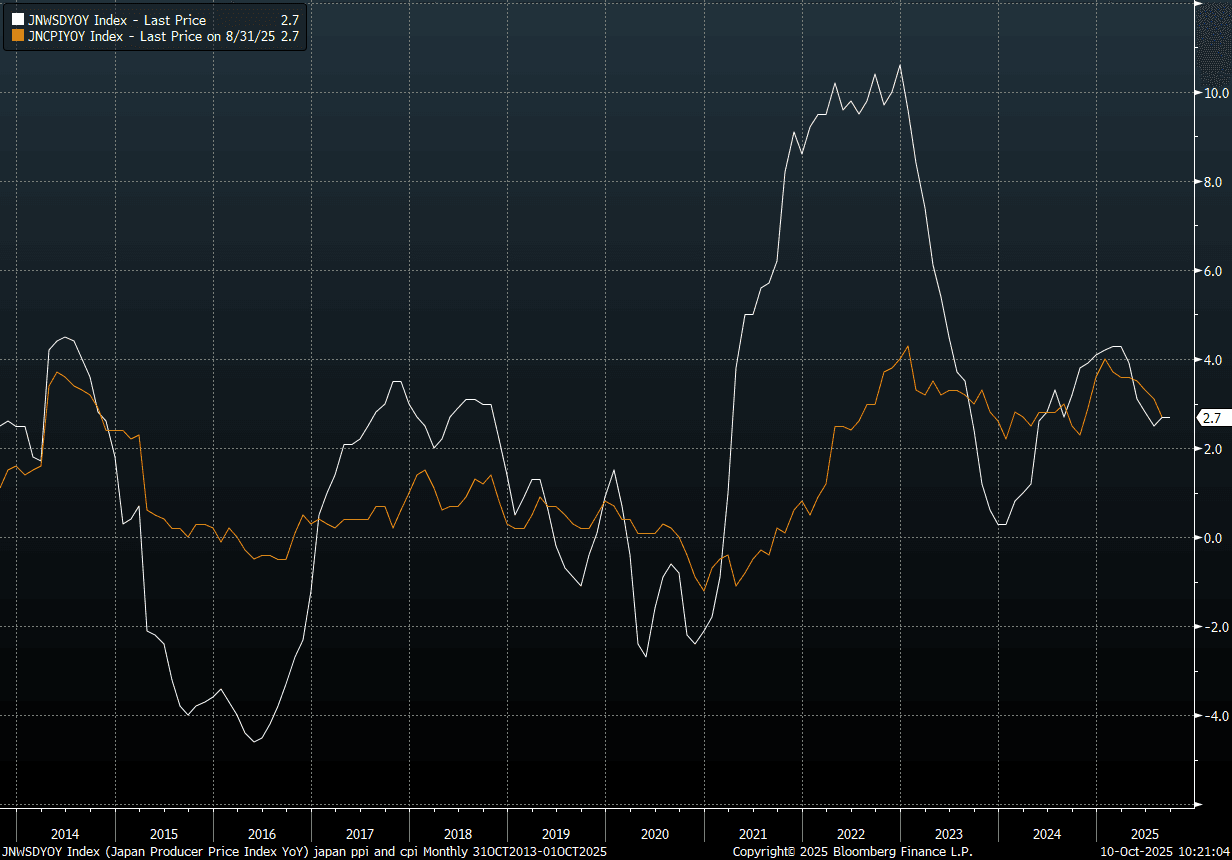
Source: Bloomberg Finance L.P./MNI
Want to read more?
Find more articles and bullets on these widgets:
Historical bullets
LNG: European Gas Off Low After Israel’s Strike In Qatar
European gas prices fell 1.2% to EUR 32.68 but are up 3.3% this month. They reached a high of EUR 33.35 early in the session and then fell to EUR 32.11 but Israel’s strike on Hamas leaders in major natural gas producer Qatar drove a recovery. The US unusually reproached Israel. It seems unlikely at this stage that Qatari LNG exports will be impacted but any disruption could be a problem for Europe this close to winter. Developments will be monitored closely.
- The FT reported that President Trump told European representatives that he’s prepared to impose the same tariffs as Europe on China and India for buying Russian energy. The US will also follow the EU with any new Russian sanctions. However, Trump said he had spoken with his “good friend” Indian PM Modi.
- European LNG imports were at a 3-month high, according to Bloomberg, helping it to refill. Storage is now close to 80% full despite scheduled Norwegian maintenance.
- In terms of global supplies, there is maintenance in Australia, Africa and the Middle East but milder hurricane activity this year has meant US output has been steady. Bloomberg reports that the US Golden Pass facility should see its first LNG shipment around December.
- US gas rose 0.4% to $3.102 to be 3.5% higher in September driven by forecasts for warmer weather in mid-September which should boost cooling demand. After rising to $3.165 it fell to $3.046. Lower flows due to pipeline maintenance, which has been extended a week to 15 September, have been supportive prices.
- The EIA in its short-term energy outlook expects Henry Hub gas spot prices to rise to $3.70/MMBtu in Q4 and then average $4.30 in 2026 supported by “relatively flat” production as US LNG exports rise. US gas production in 2026 is projected to be in line with 2025.
US TSYS: Cash Open
TYZ5 is trading 113-08, down 0-03 from its close.
- The US 2-year yield opens around 3.552%, down 0.01 from its close.
- The US 10-year yield opens around 4.084%.
- MNI US DATA: For PPI, current Bloomberg consensus is for a cooling after July’s hot print, with M/M final demand PPI at 0.3% (0.9% prior) and “core” (ex-food/energy/trade) also at 0.3% (0.6% prior). Core PCE estimates are for 0.31% M/M vs 0.27% prior, with no analysts seeing core PCE printing above core CPI. That could change based on various PPI components that feed into PCE, but as it stands, the M/M core PCE estimate would be the highest since February.
- Given increasing focus on labor risks it’s hard to imagine a set of inflation readings that stops the Fed from cutting 25bp as expected, but it could help shape the updated rate and economic projections to be released at the meeting (including the 2025 “dot” median), as well as Chair Powell’s tone.
- Zerohedge on X: “If the Fed knew how bad the labor market truly was, it would have cut 25bps in March and another 25bps in June/July. There is every case to be made for a 50bps rate cut in Sept.”
- 10-Year Yields have broken through its support as the market reacts to a labour market that is rapidly cooling. This move should now see buyers return on bounces with the first buy-zone between 4.15%-4.20%. First target the 4.00% zone then the 3.80% area.
- Data/Events: MBA Mortgage Applications, PPI, Wholesale Inventories/Sales
JAPAN DATA: Rtrs Monthly Tankan At Multi Yr Highs, Official Q3 Print Due Oct 1
Headlines crossed earlier from Reuters from its monthly survey tracking the BoJ's quarterly Tankan survey - "Manufacturers' sentiment index +13 in September vs +9 in August" (Rtrs). It added, "...showed the manufacturers' mood index improved to 13 in September from 9 in August, marking a third month of increases and the highest reading since August 2022."
- "Multiple managers in the transport machinery sector said they were receiving solid orders, while some referred to stagnant domestic production in recent months given a shrinkage in exports" (via Rtrs). However, the report also noted more caution around the outlook, reflecting concerns on the domestic economic backdrop.
- The official Q3 Tankan report will be out on Oct 1 and will be a key watch point for the BoJ, as it looks to gauge fallout from the US-Japan trade deal.
- The last Tankan survey for Q2 painted a resilient backdrop for large manufacturers, while the all industry capex estimate was also nudged higher. The chart below plots this capex estimate against total capex investment y/y.
- A resilient Q3 outcome could give the BoJ renewed confidence in the economic outlook and ring rate hikes back onto the agenda. We saw late yesterday some hawkish headlines via BBG, indicating there is a "chance of" a hike this year despite the political turmoil following PM Ishiba's resignation Sunday, which also weighed on USD/JPY (but follow through to the downside was limited). "Some officials are even of the view that a hike might be appropriate as early as October", the Bloomberg article added.
- Market pricing for a hike in Oct remains fairly modest at this stage though.
Fig 1: Tankan Capex Estimate & Capital Investment Y/Y
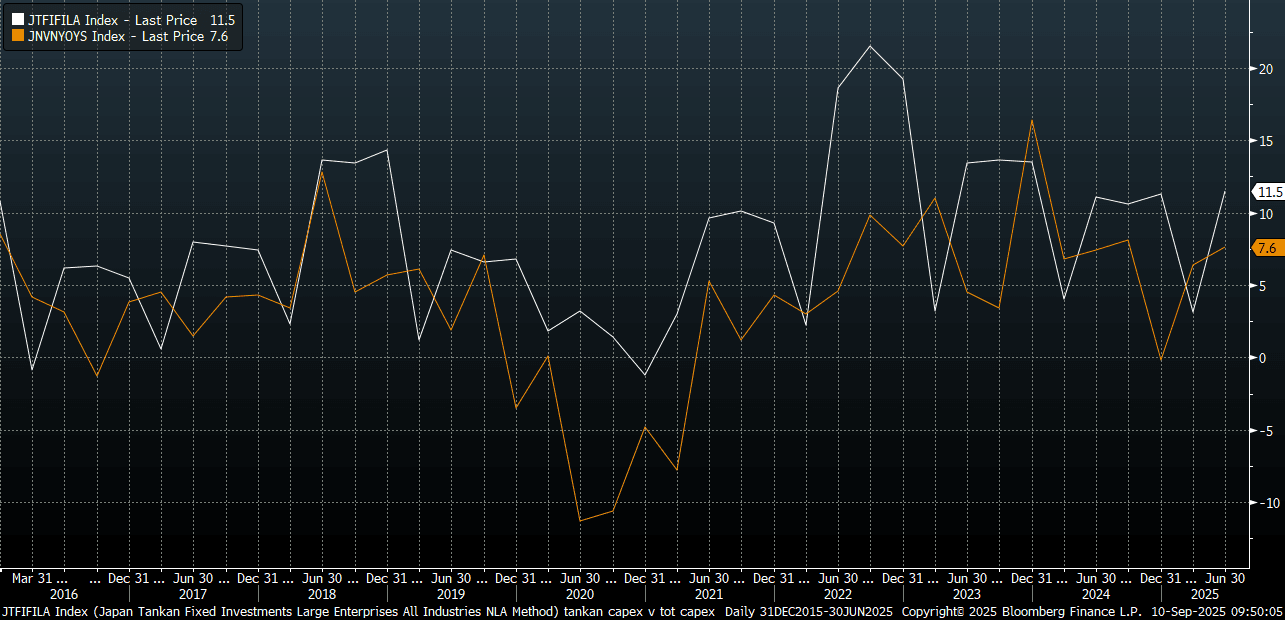
Source: Bloomberg Finance L.P/MNI