MEXICO: Peso Retains Attractiveness in Crosses, GBPMXN Lowest Since August 2024
- With MXN remaining resilient to broader USD strength on Monday amid ongoing equity strength, multiple peso crosses have moved towards their extremes for the cycle today. In particular, GBPMXN has fallen a further 0.5% to its lowest levels since August 2024, with the pair dipping to a low of 24.25 in recent trade, narrowing the gap to support around the 24.00 handle.
- Given recent pressures on the Yen, MXNJPY is also testing recent cycle highs around 8.35, marking the highest level for the pair since end July 2024. A break above here would open the door for a move to 8.50 and beyond as moving average indicators continue to highlight a dominant uptrend.
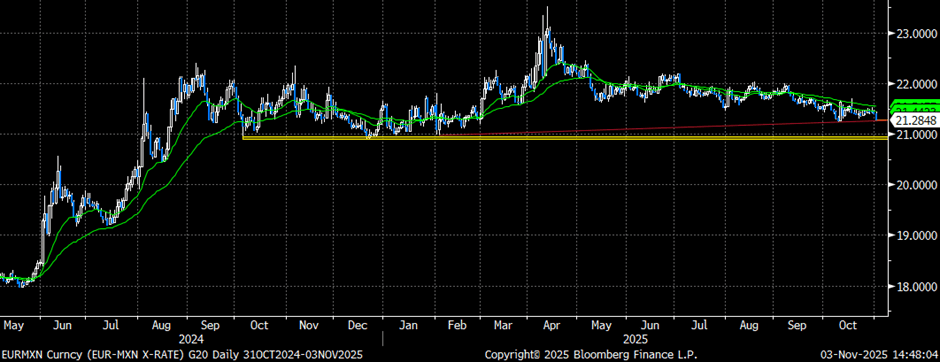
- Similarly, EURMXN is down by 0.4% around 21.31, leaving the pair just above October’s 8-month lows at 21.2365. A break below here would signal scope for a move towards a cluster of daily lows and key support just below the 21.00 handle. (See Chart below.)
- Ongoing peso resilience comes ahead of Thursday’s Banxico meeting when a further 25bp cut to 7.25% is widely expected amid continued pressures on growth, as shown by the contraction in Q3 GDP last week. Nonetheless, persistent core CPI pressures are likely to lead to another split vote, with Deputy Governor Heath voting to remain on hold again.
Today’s earlier Banxico survey highlighted those concerns about core inflation, as analysts raised their core CPI forecasts to fresh highs. As such, Banxico is likely to remain cautious in its easing cycle, ensuring that the peso maintains an attractive carry buffer for the time being. Optimism around US trade talks also remain a near-term support, with President Sheinbaum saying today that she expects to reach a deal with the US over an airline dispute.
Want to read more?
Find more articles and bullets on these widgets:
Historical bullets
USDCAD TECHS: Fresh Cycle High
- RES 4: 1.4111 High Apr 10
- RES 3: 1.4045 3.0% Upper Bollinger Band
- RES 2: 1.4019 38.2% retracement of the Feb 3 - Jun 16 bear leg
- RES 1: 1.3989 200-dma
- PRICE: 1.3953 @ 16:02 BST Oct 3
- SUP 1: 1.3897/3825 Low Sep 30 / 50-day EMA
- SUP 2: 1.3727 Low Aug 29 and a bear trigger
- SUP 3: 1.3689 Low Jul 28
- SUP 4: 1.3637 Low Jul 25
A bull cycle in USDCAD remains intact and yesterday’s break above the late September’s high, firms the bullish theme. This move higher also maintains the bullish price sequence of higher highs and higher lows. Note too that moving average studies are in a bull-mode position, highlighting a dominant uptrend. Sights are on 1.4019, a Fibonacci retracement point. On the downside, first key support lies at 1.3825, the 50-day EMA.
AUDUSD TECHS: Support Remains Intact For Now
- RES 4: 0.6763 1.382 proj of the Jun 23 - Jul 24 - Aug 21 price swing
- RES 3: 0.6726 1.236 proj of the Jun 23 - Jul 24 - Aug 21 price swing
- RES 2: 0.6660/6707 High Sep 18 / 17 and key resistance
- RES 1: 0.6629 High Sep 30 & Oct 01
- PRICE: 0.6603 @ 16:01 BST Oct 3
- SUP 1: 0.6527/21 61.8% of the Aug 21 - Sep 17 bull leg / Low Sep 26
- SUP 2: 0.6484 76.4% retracement of the Aug 21 - Sep 17 bull leg
- SUP 3: 0.6463/6415 Low Aug 27 / Low Aug 21 / 22 and a bear trigger
- SUP 4: 0.6373 Low Jun 23
The AUDUSD uptrend remains intact and recent weakness appears to have been a correction. Support to watch lies at the 50-day EMA, at 0.6558. A clear break of this average would signal scope for a deeper retracement and expose 0.6527 once again, a Fibonacci retracement. For bulls, a stronger reversal higher would refocus attention on 0.6707, the Sep 17 high. Initial resistance to watch is 0.6629, the Sep 30 and Oct 1 high.
US TSYS/SUPPLY: September's Coupon Auctions Were Generally Solid (2/2)
September’s coupon auctions were generally solid, with three lines trading through, two coming out on the screws and two tailing slightly.
- Looking through the lens of MNI’s Relative Strength Indicator (RSI), five lines saw positive readings while two saw negative readings.
- The 3-year sale was the strongest auction of the month according to MNI’s RSI. The 3-year line traded through 0.7bps, the largest stop through in seven months. Meanwhile, the primary dealer take-up was just 8.4%, the lowest on record (data going back to 2003).
- The weakest sale of the month was the last – the 7-year line. This line saw the second consecutive 0.5bp tail, with the 12.0% primary dealer take-up above August’s 9.8% and July’s record low 4.1%.
September Auction Review:
- 2Y Note on-the-screws: 3.571% vs. 3.571% WI.
- 2Y FRN: 0.200% high margin vs. 0.195% prior
- 3Y Note trade-through: 3.485% vs. 3.492% WI.
- 5Y Note tail: 3.710% vs 3.709% WI.
- 7Y Note tail: 3.953% vs. 3.948% WI.
- 10Y Note trade-through: 4.033% vs. 4.047% WI.
- 10Y TIPS: 1.734% high yield vs. 1.985% prior
- 20Y Bond trade-through: 4.613% vs 4.615% WI.
- 30Y Bond on-the-screws: 4.651% vs. 4.651% WI.
